Build a visual
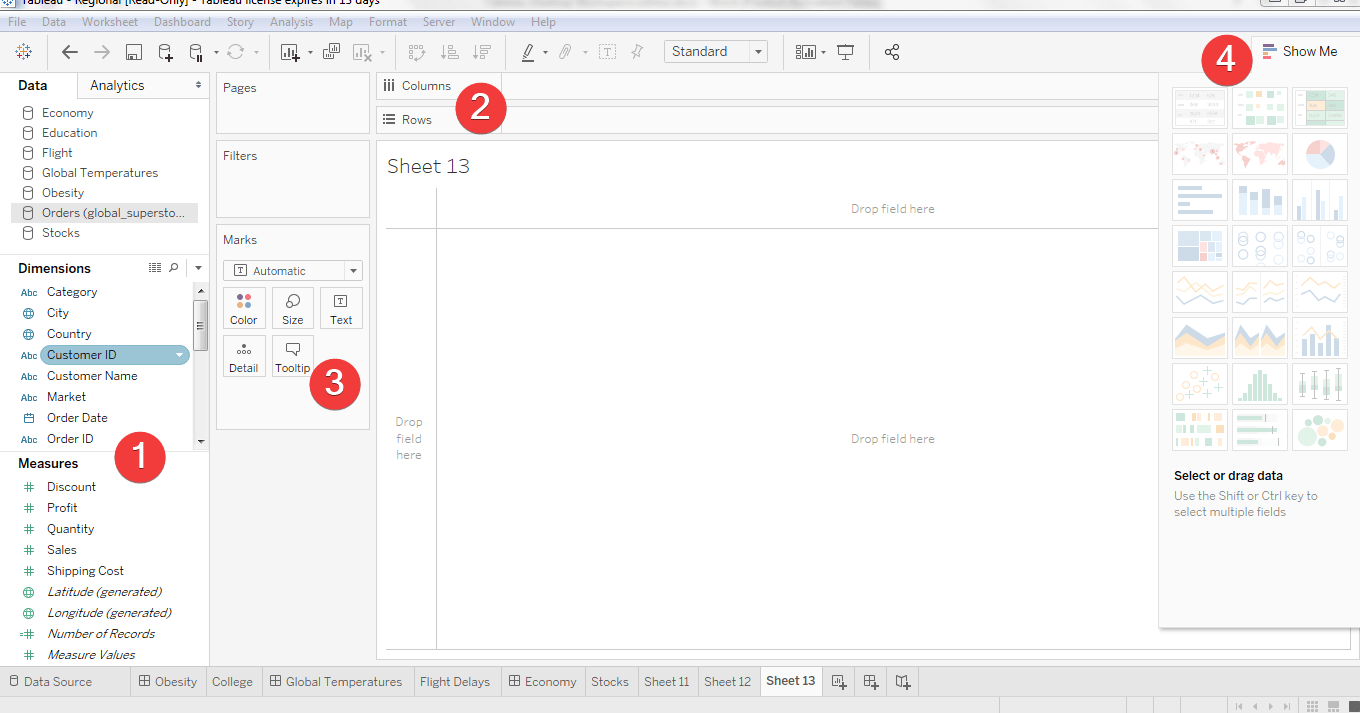
As a Tableau analyst, you create a visual by:
Selecting the fields that you want to visualize.
Dragging the fields to the Columns or Rows shelf.
Refining the visual by adjusting the Marks card.
By using the Show Me drop-down menu.
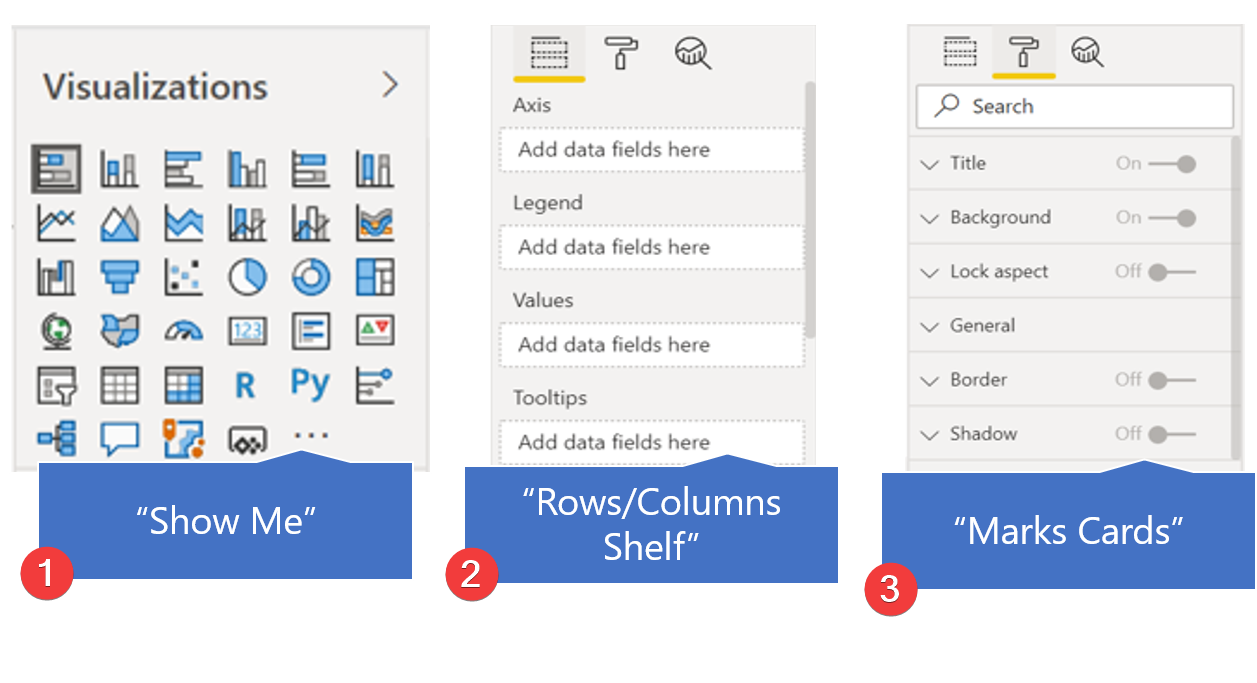
The steps for creating a visual in Microsoft Power BI differ.
Start with the visual in which you're interested by selecting one from the Visualizations pane (similar to the Show Me feature in Tableau).
Select the data that you want to visualize (similar to the Rows/Columns shelf in Tableau).
Refine the visual by adjusting the formatting (similar to the Marks cards in Tableau).

