Visualize content distribution status
Applies to: Configuration Manager (current branch)
Starting in version 2203, you can monitor content distribution path and status in a graphical format. The graph shows distribution point type, distribution state, and associated status messages. This visualization allows you to more easily understand the status of your content package distribution. It helps you answer questions like:
- Has the site successfully distributed the content?
- Is the content distribution in progress?
- Which distribution points have already processed the content?
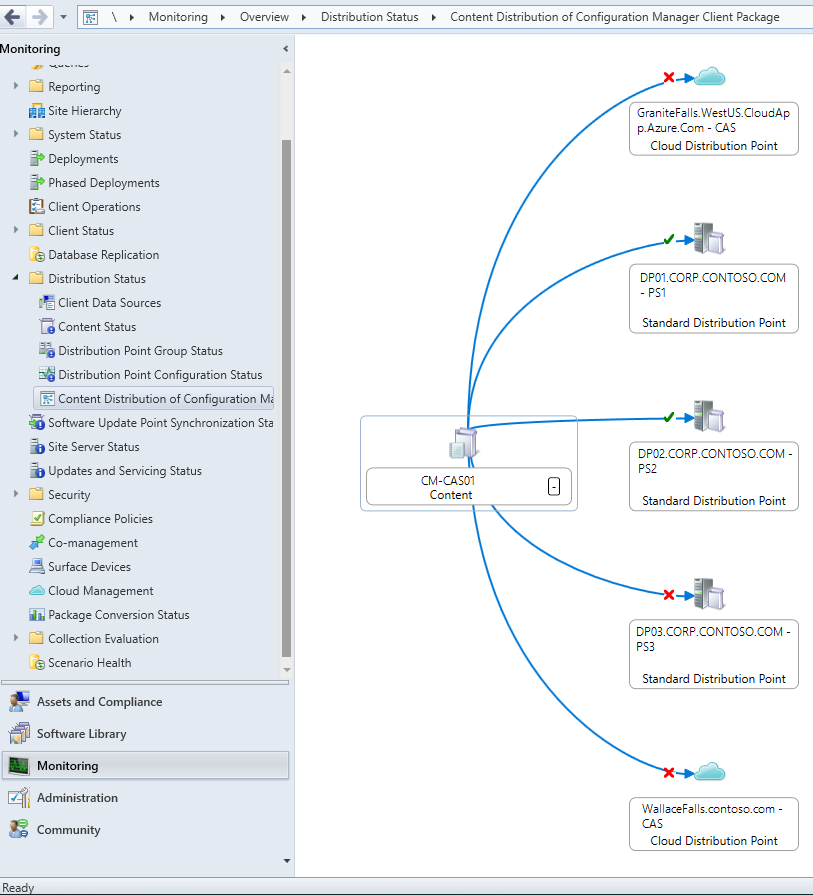
This example shows a graph for the content distribution status of the Configuration Manager client package in an example hierarchy. It lets you easily see the following information:
- The solid blue line from the site server to each distribution point indicates that the rate limit is Unlimited. For more information, see Rate limits.
- The green check mark on
DP01andDP02indicates that the content was successfully distributed to these site systems. - The red
XonDP03and both cloud distribution points indicates that there's an error in distributing the content to these site systems.
View content distribution
In the Configuration Manager console, go to the Monitoring workspace, expand Distribution Status and select the Content Status node.
If this node doesn't show anything, first distribute content.
Select a distributed content item. For example, the Configuration Manager client package.
In the ribbon, select View Content Distribution. This action displays the distribution graph for the selected content.
Hover over the status icon to quickly view more information. Select the path or the status icon to view status messages for the content.
Hover over the title of the site system to quickly view more information. Select it to drill through to the Distribution Points node.
Navigation tips
Use the following tips to navigate the relationship viewer:
Select the plus (
+) or minus (-) icons next to the server name to expand or collapse members of a node.The style and color of the line between the servers determines the type of distribution. If you hover over a specific line, a tooltip shows the type.
The maximum number of child nodes displayed depends upon the level of the graph:
- First level: five nodes
- Second level: three nodes
- Third level: two nodes
- Fourth level: one node
If there are more objects than the graph can display at that level, you'll see the More icon.
When the size of the tree is larger than the window, use the green arrows to view more.
When a node of the tree is larger than the available space, select More to change the view to just that node.
To navigate to a prior view, select the Back arrow. Select the Home icon to return to the main page.
Use the Search box to locate a server in the current tree view.
Use the Navigator to zoom and pan around the tree. You can also print the current view.
Tip
Hold the Ctrl key and scroll the mouse wheel to zoom the graph.
For more information on how to navigate the graph with a keyboard, see Accessibility features for the collection relationship diagram.
Next steps
Feedback
Coming soon: Throughout 2024 we will be phasing out GitHub Issues as the feedback mechanism for content and replacing it with a new feedback system. For more information see: https://aka.ms/ContentUserFeedback.
Submit and view feedback for