Meetings insights score – People experiences (Previous Version)
Adoption Score provides insights into your organization's digital transformation journey through its use of Microsoft 365 and the technology experiences that support it. Your organization's score reflects people and technology experience measurements and can be compared to benchmarks from organizations similar to yours. The meetings category is part of the people experiences measures. To learn more, check out the Adoption Score overview and read Microsoft's Privacy Statement.
Prerequisites
To get started with Meetings insights, people in your organization need to be licensed for:
- Microsoft Teams
For more information, see assign licenses to users.
After people have been active in Teams at least once in the last 28 days, you will start to see the insights.
Why your organization's meetings score matters
Meetings, where people explore ideas, plan, solve problems, and make decisions, are a fundamental pillar for organizational productivity. Research indicates that when people use online meeting tools effectively, they tend to save up to 104 minutes per week.
How we calculate the meetings score
We provide a primary insight in the experience that contains the key metrics for this category. Then, a scoring framework, detailed below, is used for these metrics to calculate your organization's score.
Primary insight
Microsoft Teams integrates with Outlook calendar and provides a host of capabilities to make your meetings more engaging and effective. The primary insight looks at all Microsoft Teams online meetings that were held in your organization. The Primary insight also tracks how many meetings follow at least one of the best practices for Teams meetings.
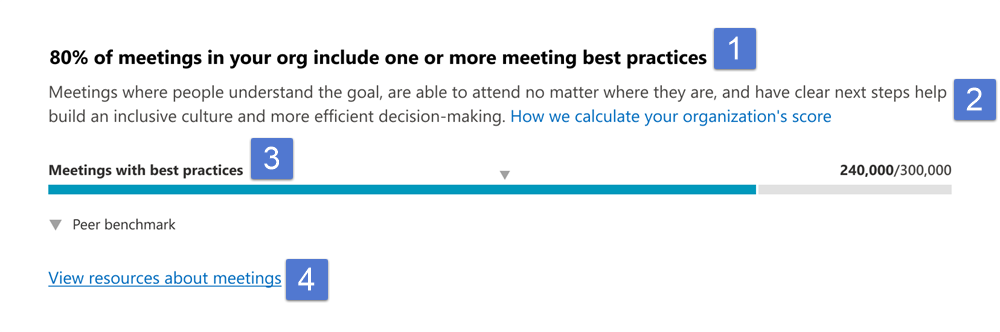
Header: Shows the percentage of online meetings on Microsoft Teams held in the past 28 days that had video or screen sharing during the meeting.
Body: Provides more information on how following best practices for engagement during a meeting, such as use of video or screen sharing, can make meetings more effective.
Visualization (current state):
- In this horizontal bar chart, the blue (colored) portion represents the percentage shown in the header
- The fraction (numerator/denominator) is used for calculating the percentage shown in the header
- Numerator: The number of online Microsoft Teams meetings including people from your organization who have used video or screen sharing.
- Denominator: The number of online Microsoft Teams meetings including people from your organization that were held in the last 28 days.
- The peer benchmark value of the key metric is also shown as a percentage.
Link to resources: Select this link to view help content.
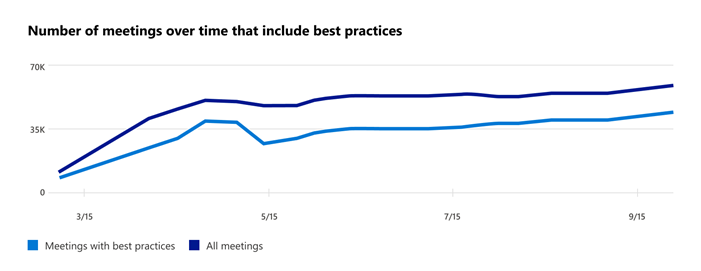
Trend visualization of the primary insight
The following chart shows the trend-lines of both the numerator and the denominator of the key metric from the primary insight. In other words, it shows the number of online Microsoft Teams meetings with best practices, such as video or screen sharing, and the total number of online Microsoft Teams meetings held over the last 180 days. Each data point on the line chart is an aggregate of activity for the last 28 days.
Scoring framework
The meetings score for your organization measures the degree to which online Microsoft Teams meetings in your organization followed best practices in the last 28 days. It is weighted based on the number of people in your org attending the meetings and the meetings' duration.
Explore more about meetings in your organization
We also provide you with supporting information to help you understand how people in your organization, as an aggregate, conduct meetings. These additional metrics don't directly contribute to your Adoption Score, but can help you create an action plan as part of your digital transformation.
Breakdown of how many meetings follow best practices
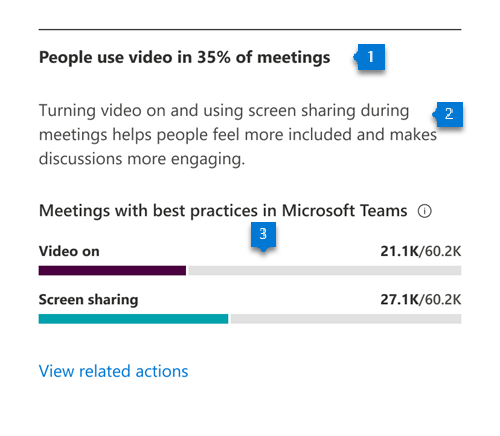
- Header: Highlights the percentage of online Microsoft Teams meetings that use video best practices considered in the primary insight and scoring.
- Body: Provides information on the value of using these practices during meetings to make them more engaging.
- Visualization: The breakdown in the visualization is meant to represent the extent to which online Microsoft Teams meetings are following each of the following best practices:
- Video: The colored portion and the fraction represent the percentage of online Microsoft Teams meetings that have video turned on. The fraction is constructed from:
- Numerator: Online Microsoft Teams meetings held in the last 28 days that had video from at least one participant turned on.
- Denominator: The total number of online Microsoft Teams meetings held in your organization in the last 28 days
- Screen sharing: The colored portion and the fraction represent the percentage of online Microsoft Teams meetings in which people used the screen-sharing feature. The fraction includes:
- Numerator: Online Microsoft Teams meetings held in the last 28 days that had at least one participant sharing their screen.
- Denominator: The total number of online Microsoft Teams meetings conducted in your organization in the last 28 days
- Video: The colored portion and the fraction represent the percentage of online Microsoft Teams meetings that have video turned on. The fraction is constructed from:
Distribution of time spent by people in meetings
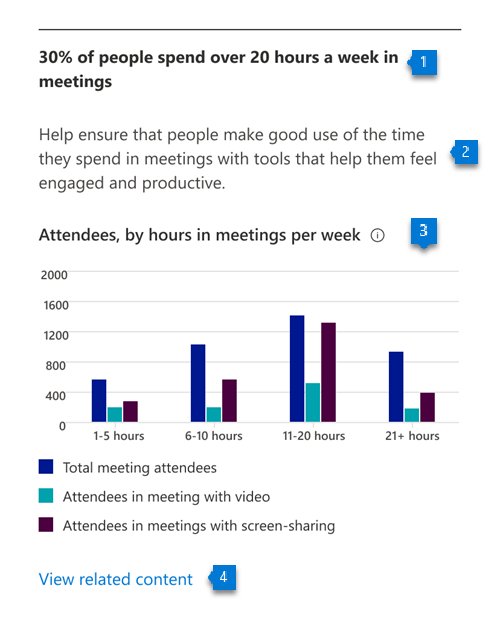
- Header: Shows the percentage of people in your organization who attend online Microsoft Teams meetings for more than 20 hours per week on average, based on their activity in the last 28 days.
- Body: Provides details on the value of using meeting best practices to make meetings engaging and productive
- Visualization: Provides a view of people in your organization based on their average time spent per week in meetings within the last 28 days. The following information is provided for each category:
- Total meeting attendees: Shows the number of people in your organization who attended meetings, based on the average meeting duration range, in the last 28 days. For example, the 6-10 hours category indicates the number of people who attended meetings for an average of that many hours per week in the last 28 days.
- Attendees in meetings with video: For each category, this shows how many people in your organization were in any meeting with video in the last 28 days.
- Attendees in meetings with screen sharing: For each category, this shows how many people were in a meeting that included screen sharing in the last 28 days.
Distribution of meeting length by type
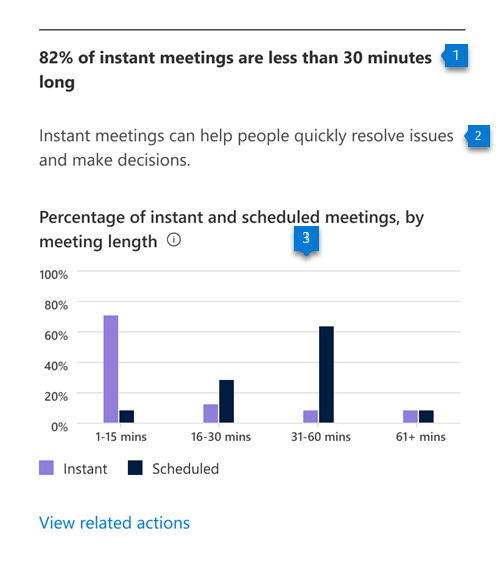
Header: Shows the percentage of instant (not previously scheduled) online Microsoft Teams meetings in the last 28 days that are under 30 minutes long.
Body: Provides information about the value of using instant meetings to resolve issues quickly.
Visualization: Provides the distribution of length (in minutes) of instant and scheduled meetings that took place in your organization in the last 28 days. The distribution categorizes each meeting into 1-15 minutes, 16-30 minutes, 31-60 minutes, and greater than 60 minutes.
Note
the scheduled meetings include all meetings that appeared on people's calendars. The instant meetings include calls, including both 1:1 and group calls, as well as meetings started using the "Meet now" feature in Microsoft Teams channels.
Use of different meeting types

- Header: Highlights the percentage of instant online Microsoft Teams meetings over the preceding 28 days that are less than 30 minutes long.
- Body: Provides information about the value of using "Meet now" in the Microsoft Teams channel feature.
- Visualization: Shows what type of meetings are being attended by people who are attending any online Microsoft Teams meetings. Each meeting type is represented as a horizontal bar, where the colored portion and the fraction represent the following:
- Instant 1:1 calls:
- Numerator: The number of people attending 1:1 calls in the last 28 days
- Denominator: The number of people attending any online Microsoft Teams meeting in the last 28 days
- Instant group calls:
- Numerator: The number of people attending group calls in the last 28 days
- Denominator : The number of people attending any online Microsoft Teams meeting in the last 28 days
- Instant Meet now in channel:
- Numerator: The number of people using "Meet now" feature within Microsoft Teams channels (for instant meetings) in the last 28 days
- Denominator: The number of people attending any online Microsoft Teams meeting in the last 28 days
- Scheduled one-off meetings:
- Numerator: The number of people attending one-off online Microsoft Teams meetings on their calendar (scheduled) in the last 28 days
- Denominator: The number of people attending any online Microsoft Teams meeting in the last 28 days
- Scheduled recurring meetings:
- Numerator: The number of people attending instances of recurring meetings on their calendar (scheduled) in the last 28 days
- Denominator: The number of people attending any online Microsoft Teams meeting in the last 28 days
- Instant 1:1 calls:
Related content
Microsoft 365 apps health – Technology experiences (article)
Communication – People experiences (article)
Content collaboration – People experiences (article)
Mobility – People experiences (article)
Privacy controls for Adoption Score (article)
Teamwork – People experiences (article)
Feedback
Coming soon: Throughout 2024 we will be phasing out GitHub Issues as the feedback mechanism for content and replacing it with a new feedback system. For more information see: https://aka.ms/ContentUserFeedback.
Submit and view feedback for