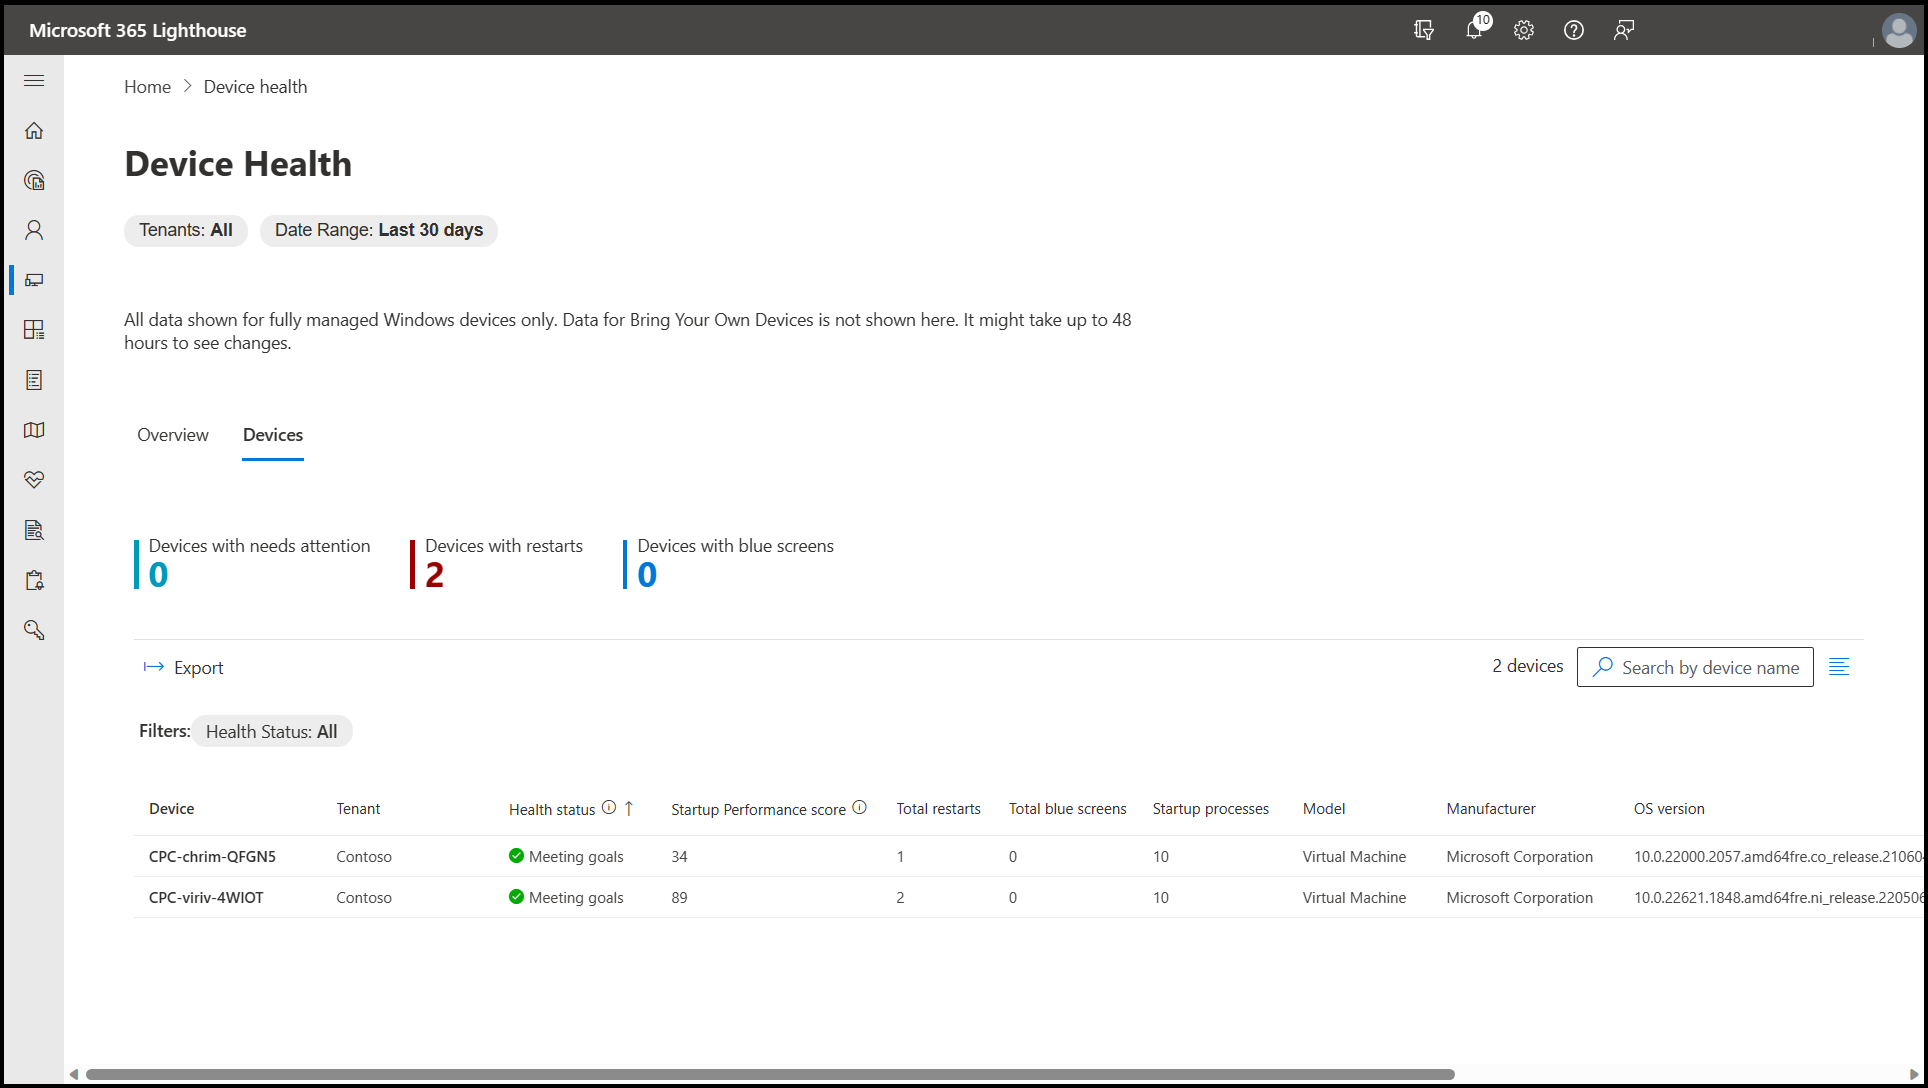
Overview of the Device health page in Microsoft 365 Lighthouse
Microsoft 365 Lighthouse brings the features of Microsoft Endpoint analytics for devices into a simplified multi-tenant management view. Performance issues and other problems can go undetected by a tenant for an extended period, impacting end-user experience and increasing support costs. The Device health page brings these problems to the surface faster and across multiple tenants to save time and end-user pain by allowing you to gain insights and remedy problems.
The Device health page provides a subset of device analytics offered through Endpoint analytics, specifically device performance and startup processes. Example data includes device health status, total restarts, total blue screens, top processes, and hardware specifications. The data only reflects fully managed Windows devices. Data on Bring Your Own Devices isn't supported.
Note
This page provides the number of tenants for which data is unavailable because they do not have the required licenses.
Requirements
Devices must be enrolled in Microsoft Intune. For more information on enrollment, see What is Endpoint analytics? Once a device is enrolled, the Device health page automatically populates with data. It may take up to 48 hours to see updates.
Note
If data doesn't show up for a specific tenant, verify that the policy is enabled. From the tenant's deployment plan, under Set up device enrollment, verify that Device health monitoring policy is compliant. If not compliant, deploy the policy.
Overview tab
The Overview tab provides a multi-tenant view of device health, including the total number of restarts and blue screens. Select a tenant from the list to see device-specific details.
The Overview tab also includes the following options:
Tenants filter: Filter by tenant or tag.
Date filter: Filter by date range.
Export: Select to export device data to an Excel comma-separated values (.csv) file.
Devices tab
The Device tab provides device health insights for all managed Windows devices, including,
Health status (Needs attention, Meeting goals, Insufficient data)
Start up performance score – To learn more, see Scores, baselines, and insights in Endpoint analytics.
Total restarts
Total blue screens
Startup processes
Hardware model, manufacturer, OS version, and disk type
Select a device from the list for more detailed device information, including a comprehensive list of startup processes on that device. A shortcut is provided to view the device in Microsoft Endpoint Manager, where you can see more insights and recommendations.
The Devices tab also includes the following options:
Tenants filter: Filter by tenant or tag.
Date filter: Filter by date range.
Export: Select to export device data to an Excel comma-separated values (.csv) file.
Search: Enter keywords to quickly locate a specific device in the list.
Choose Columns: Select which columns to show.
Related content
What is Endpoint analytics? (article)
Scores, baselines, and insights in Endpoint analytics (article)
Overview of the Apps page in Microsoft 365 Lighthouse (article)
Feedback
Coming soon: Throughout 2024 we will be phasing out GitHub Issues as the feedback mechanism for content and replacing it with a new feedback system. For more information see: https://aka.ms/ContentUserFeedback.
Submit and view feedback for

