Debug background services
The Background Services section of Microsoft Edge DevTools is a collection of tools for the Web APIs that enable your website to send and receive data even when a user doesn't use your website, and enable the browser to report production problems to your server.
Microsoft Edge DevTools considers each of the following APIs to be a background service:
- Background Fetch
- Background Sync
- Notifications
- Payment Handler
- Periodic Background Sync
- Push Messages
- Reporting API
The Background Services section logs API events, even when you're not using DevTools, to help you make sure that events are being sent and received as expected.
Background Fetch
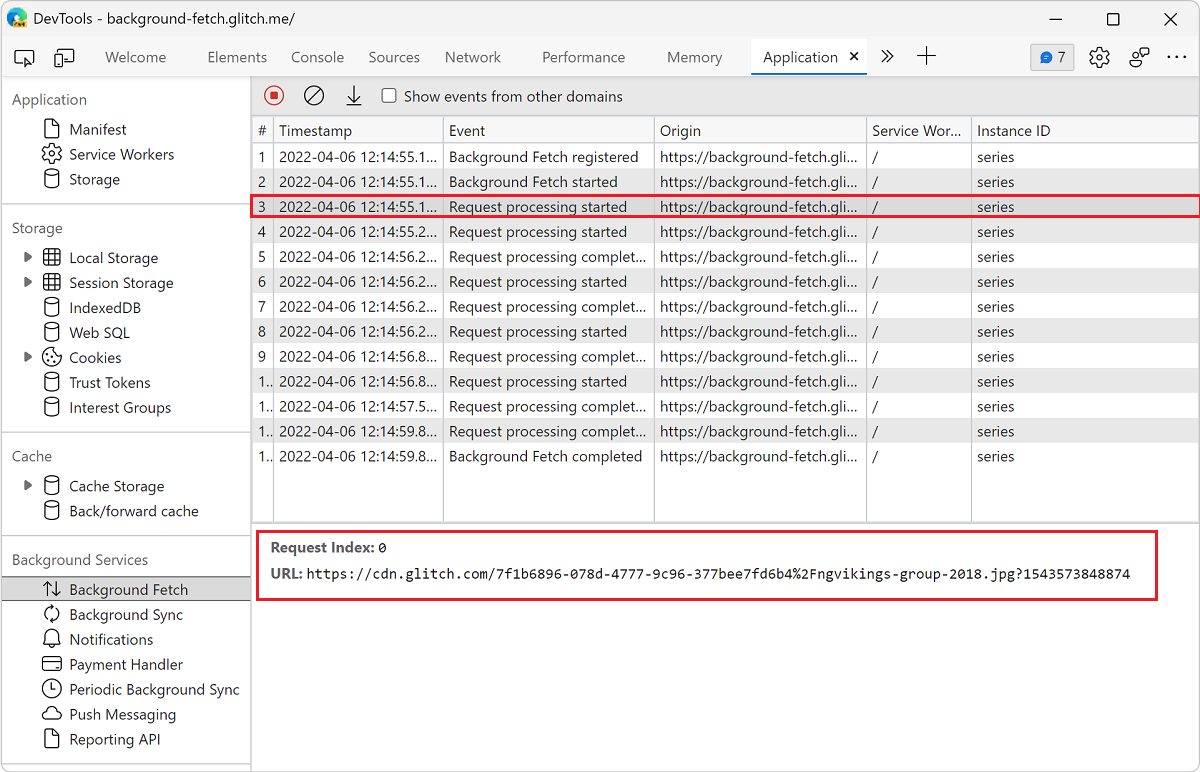
The Background Fetch API enables the service worker of a Progressive Web App to reliably download large resources, like movies or podcasts, as a background service. To log Background Fetch events for 3 days, even when DevTools isn't open:
Open DevTools by right-clicking the webpage and selecting Inspect. Or by pressing Ctrl+Shift+I (Windows, Linux) or Command+Option+I (macOS).
In DevTools, on the main toolbar, select the Application tab. If that tab isn't visible, click the More tabs (
 ) button, or else the More Tools (
 ) button.
On the left, in the Background Services section, select Background Fetch. The Background Fetch page opens.

Click Record (
 ).
After triggering some Background Fetch activity, DevTools logs the events to the table.
).
After triggering some Background Fetch activity, DevTools logs the events to the table.
Click an event to view its details in the space below the table.
Background Sync
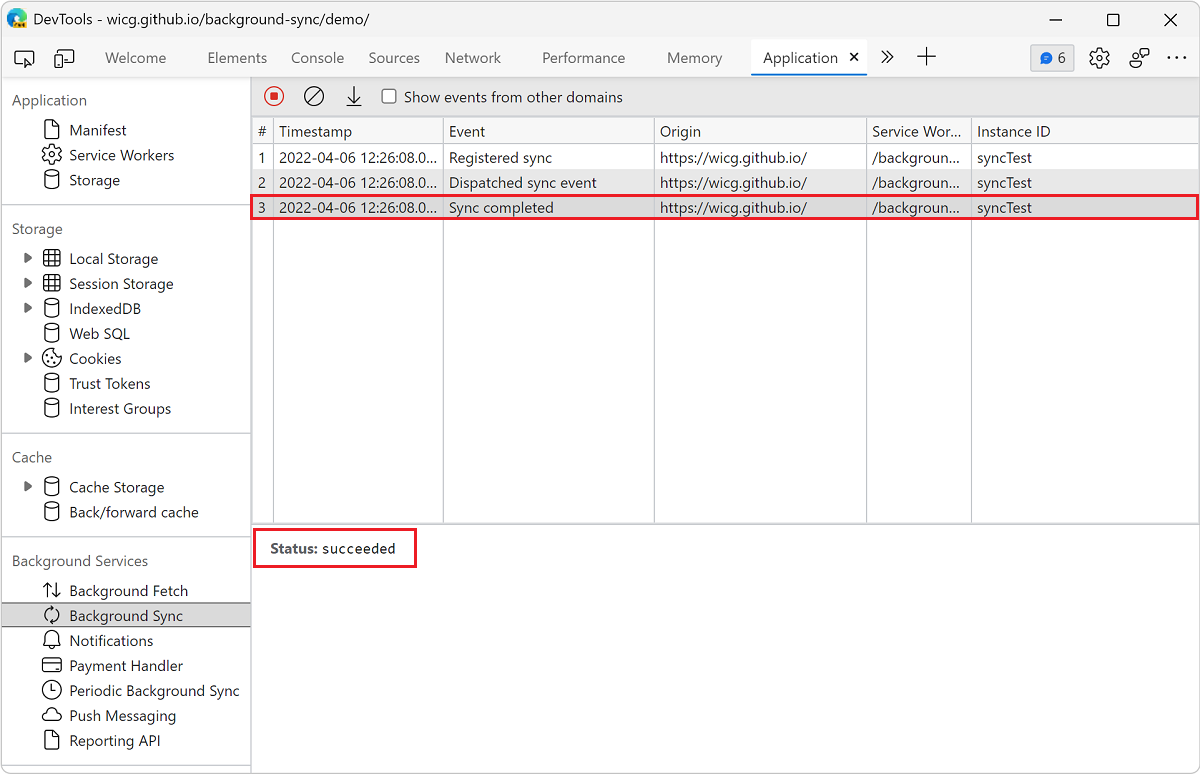
The Background Sync API enables the offline service worker of a Progressive Web App to send data to a server once it has re-established a reliable internet connection. To log Background Sync events for 3 days, even when DevTools isn't open:
Open DevTools by right-clicking the webpage and selecting Inspect. Or by pressing Ctrl+Shift+I (Windows, Linux) or Command+Option+I (macOS).
In DevTools, on the main toolbar, select the Application tab. If that tab isn't visible, click the More tabs (
) button, or else the More Tools () button.On the left, in the Background Services section, select Background Sync. The Background Sync page opens.

Click Record (
). After triggering some Background Sync activity, DevTools logs the events to the table.
Select an event to view its details in the space below the table.
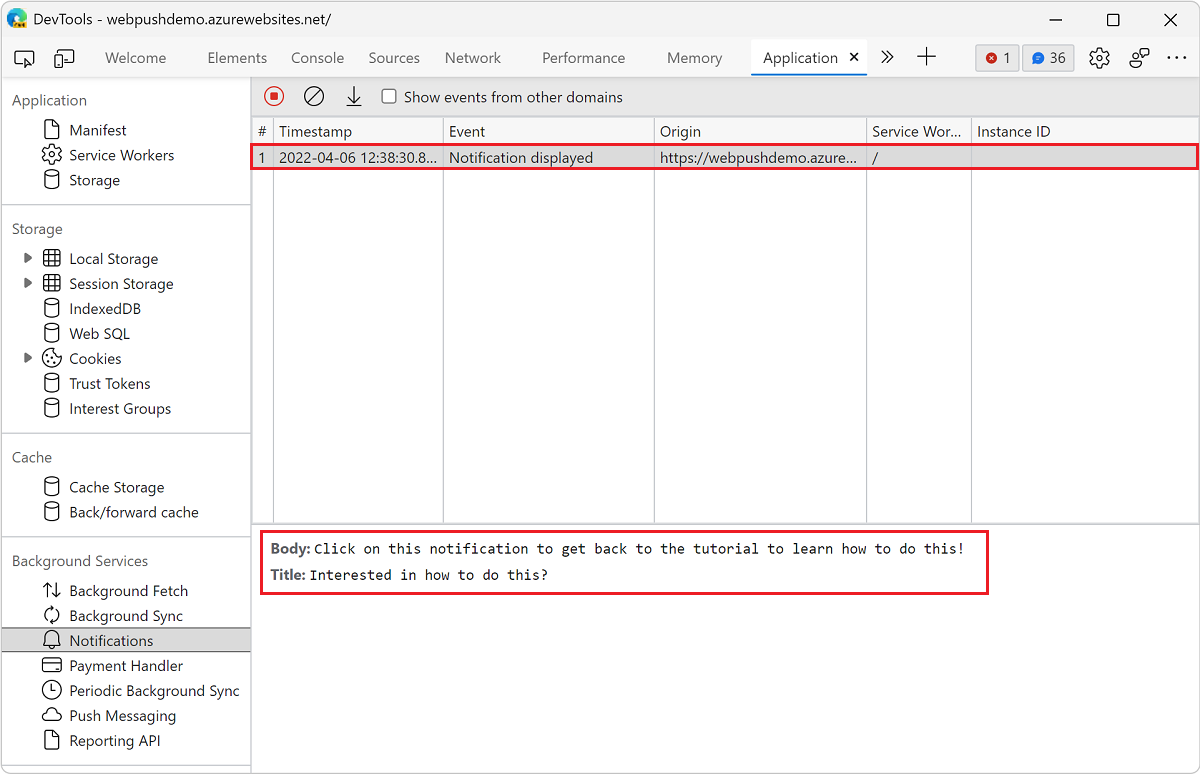
Notifications
After a service worker has received a Push Message from a server, the service worker uses the Notifications API to display the data to a user. To log Notifications for 3 days, even when DevTools isn't open:
Open DevTools by right-clicking the webpage and selecting Inspect. Or by pressing Ctrl+Shift+I (Windows, Linux) or Command+Option+I (macOS).
In DevTools, on the main toolbar, select the Application tab. If that tab isn't visible, click the More tabs (
) button, or else the More Tools () button.On the left, in the Background Services section, select Notifications. The Notifications page opens.
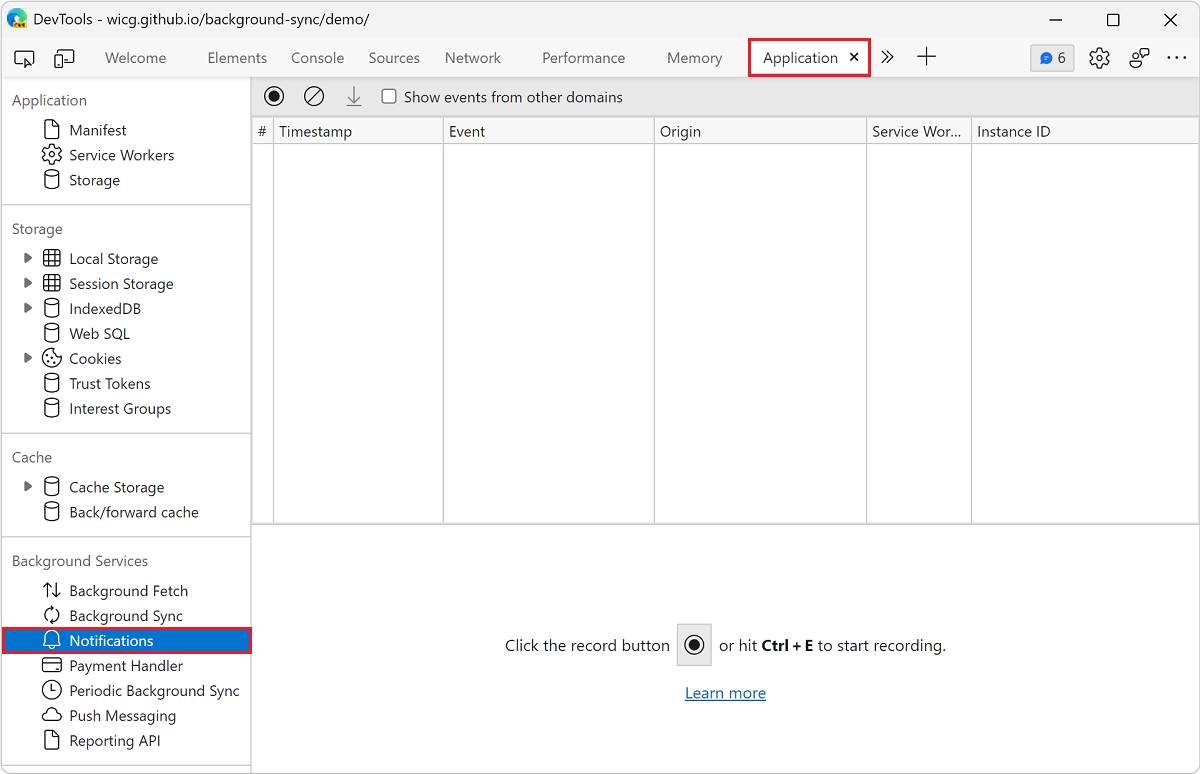
Click Record (
). After triggering some Notifications activity, DevTools logs the events to the table.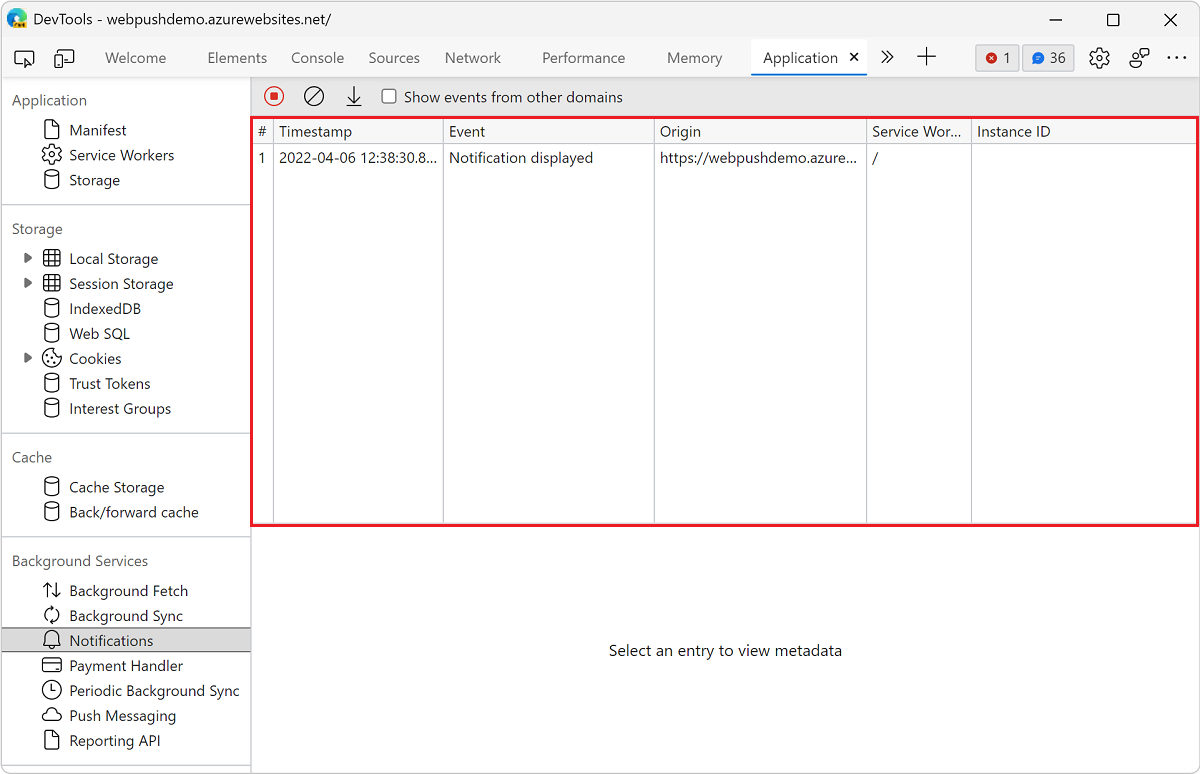
Click an event to view its details in the space below the table.
Payment Handler
The Payment Handler API allows web applications to handle payment requests on behalf of users. To log the payment request and response events for 3 days, even when DevTools isn't open:
Open DevTools by right-clicking the webpage and selecting Inspect. Or by pressing Ctrl+Shift+I (Windows, Linux) or Command+Option+I (macOS).
In DevTools, on the main toolbar, select the Application tab. If that tab isn't visible, click the More tabs (
) button, or else the More Tools () button.On the left, in the Background Services section, select Payment Handler. The Payment Handler page opens.
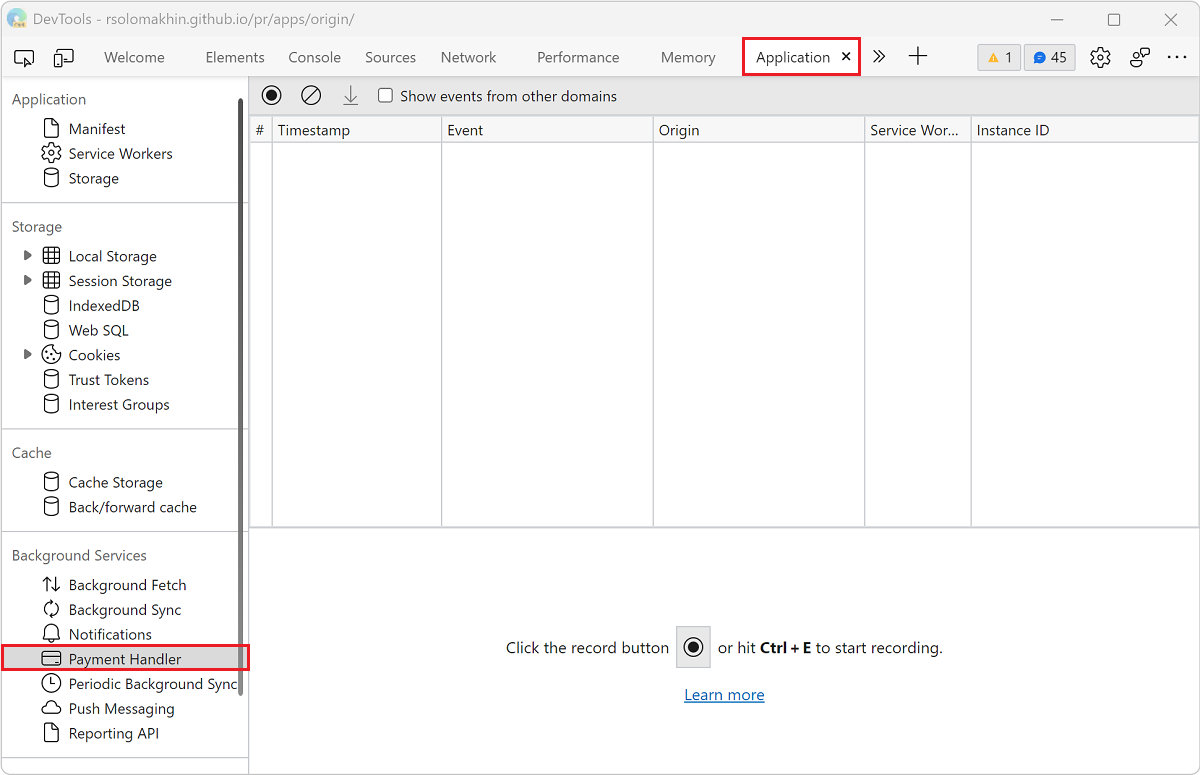
Click Record (
). After triggering some payment requests, DevTools logs the events to the table.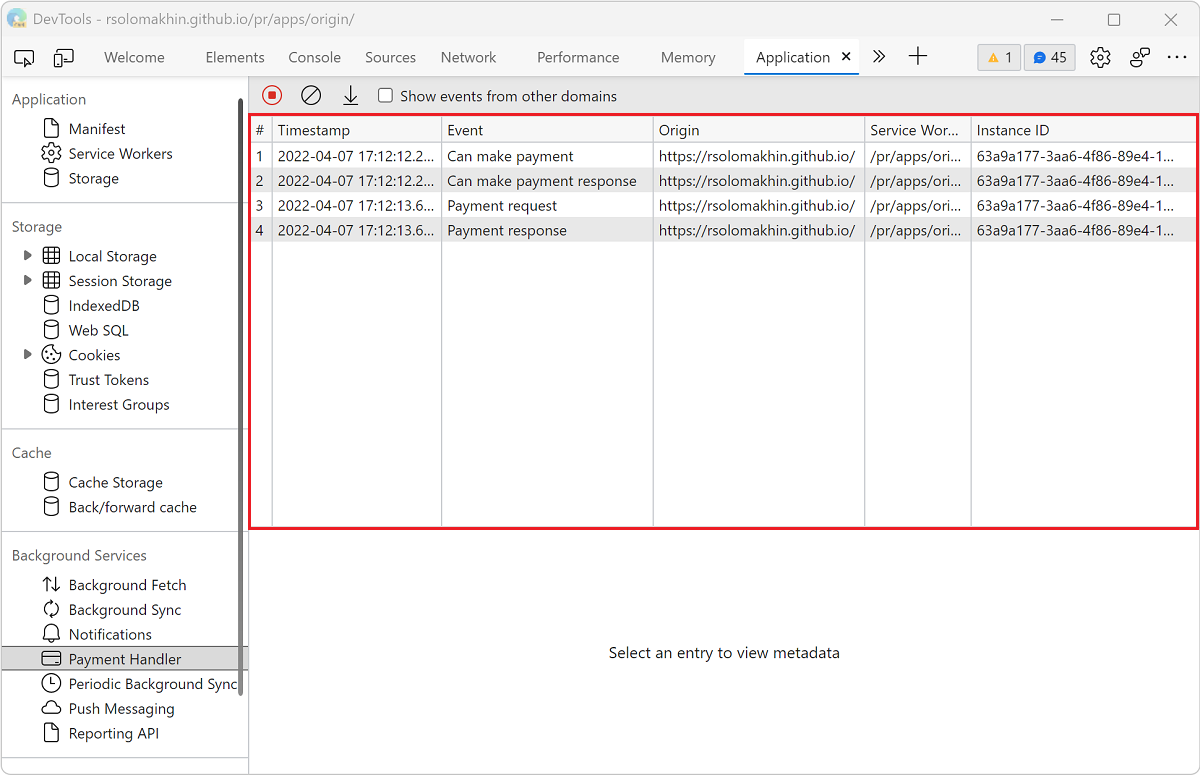
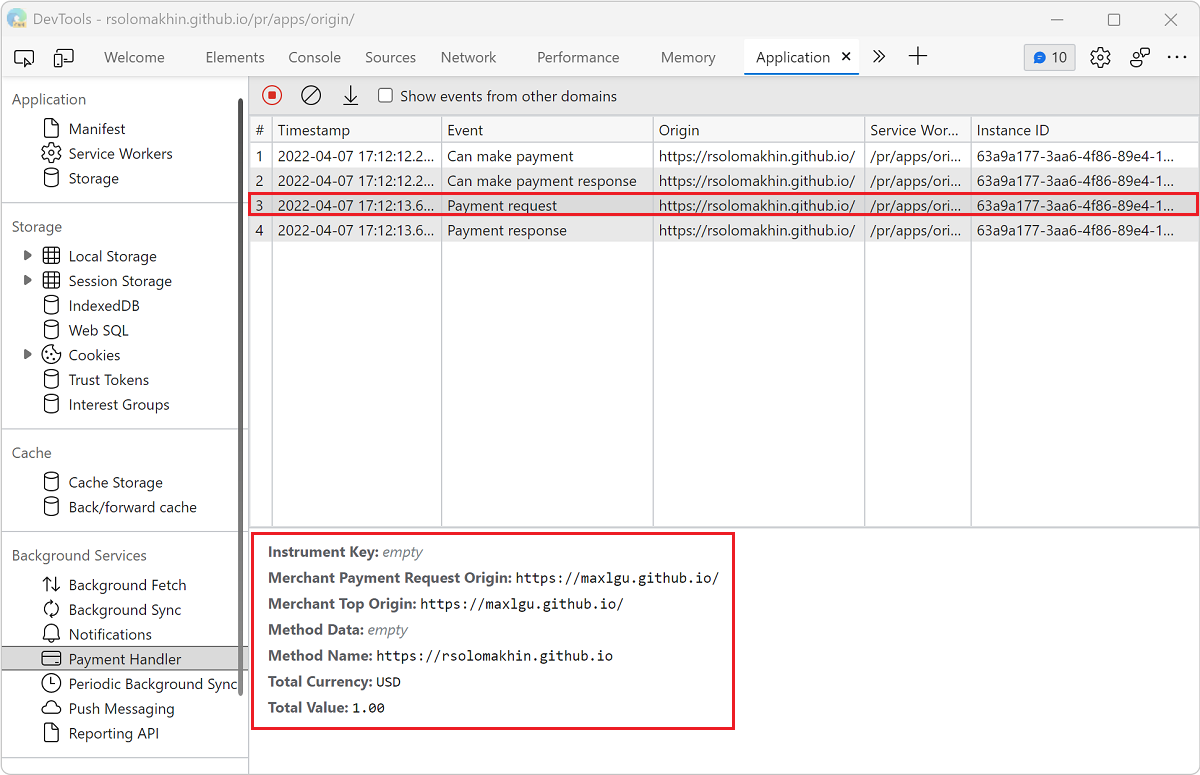
Click an event to view its details in the space below the table.
Periodic Background Sync
The Periodic Background Sync API enables the service worker of a Progressive Web App to retrieve data from a server, periodically, even when the website isn't opened. To learn more about the Periodic Background Sync API, see Use the Periodic Background Sync API to regularly get fresh content.
To log Periodic Background Sync events for 3 days, even when DevTools isn't open:
Open DevTools by right-clicking the webpage and selecting Inspect. Or by pressing Ctrl+Shift+I (Windows, Linux) or Command+Option+I (macOS).
In DevTools, on the main toolbar, select the Application tab. If that tab isn't visible, click the More tabs (
) button, or else the More Tools () button.On the left, in the Background Services section, select Periodic Background Sync. The Periodic Background Sync page opens.
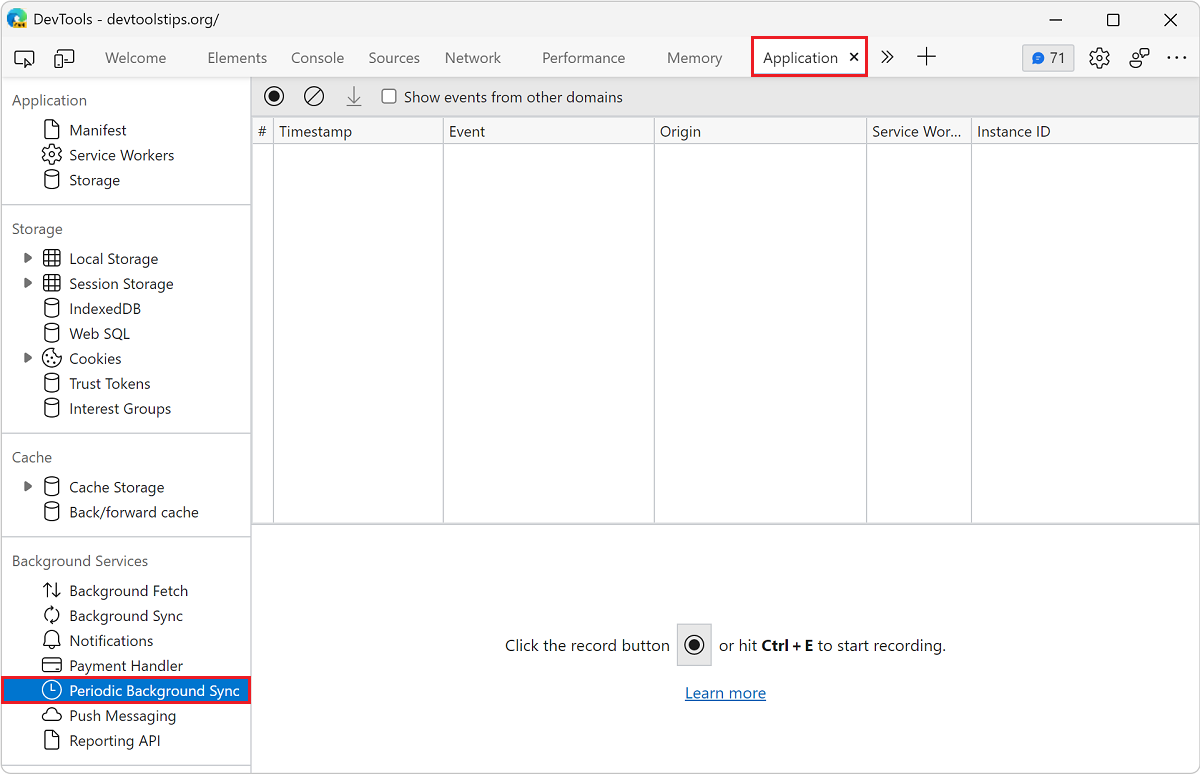
Click Record (
). After triggering some Periodic Background Sync activity, DevTools logs the events to the table.
Push Messages
To display a push notification to a user, the service worker of a Progressive Web App must first use the Push Message API to receive data from a server. When the service worker is ready to display the notification, it uses the Notifications API. To log Push Messages for 3 days, even when DevTools isn't open:
Open DevTools by right-clicking the webpage and selecting Inspect. Or by pressing Ctrl+Shift+I (Windows, Linux) or Command+Option+I (macOS).
In DevTools, on the main toolbar, select the Application tab. If that tab isn't visible, click the More tabs (
) button, or else the More Tools () button.On the left, in the Background Services section, select Push Messaging. The Push Messaging page opens.
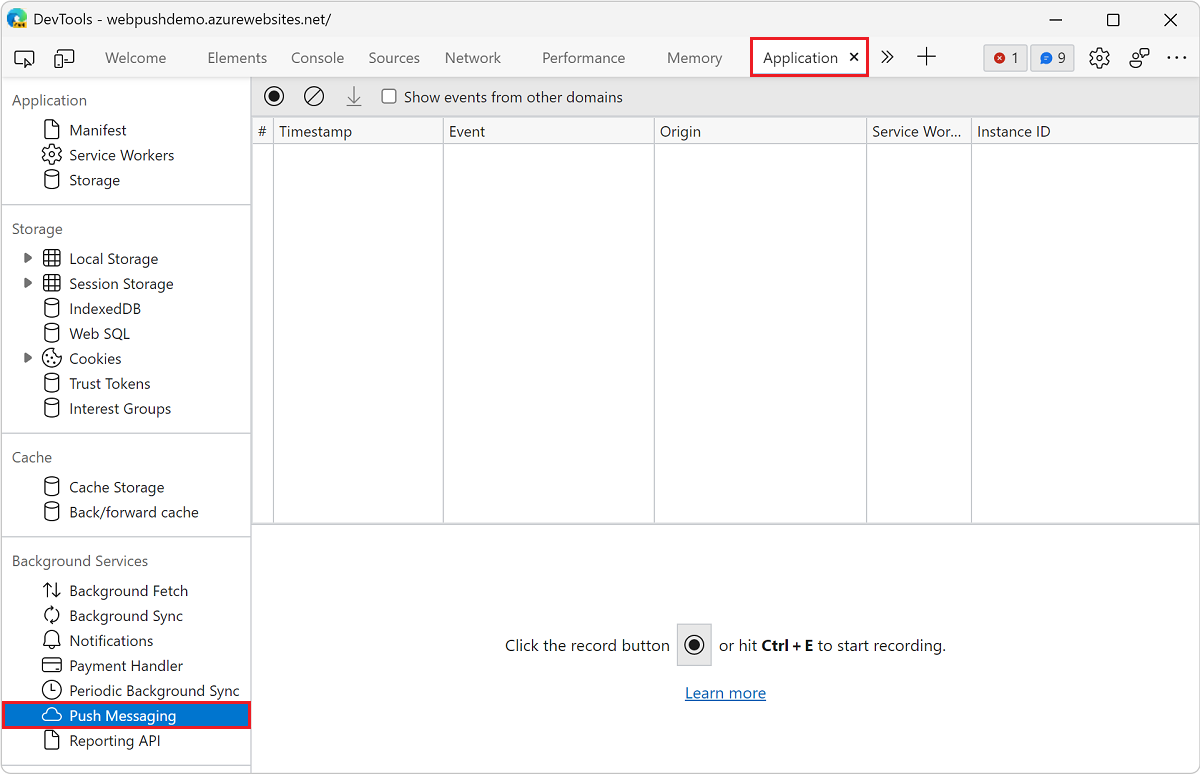
Click Record (
). After triggering some Push Message activity, DevTools logs the events to the table.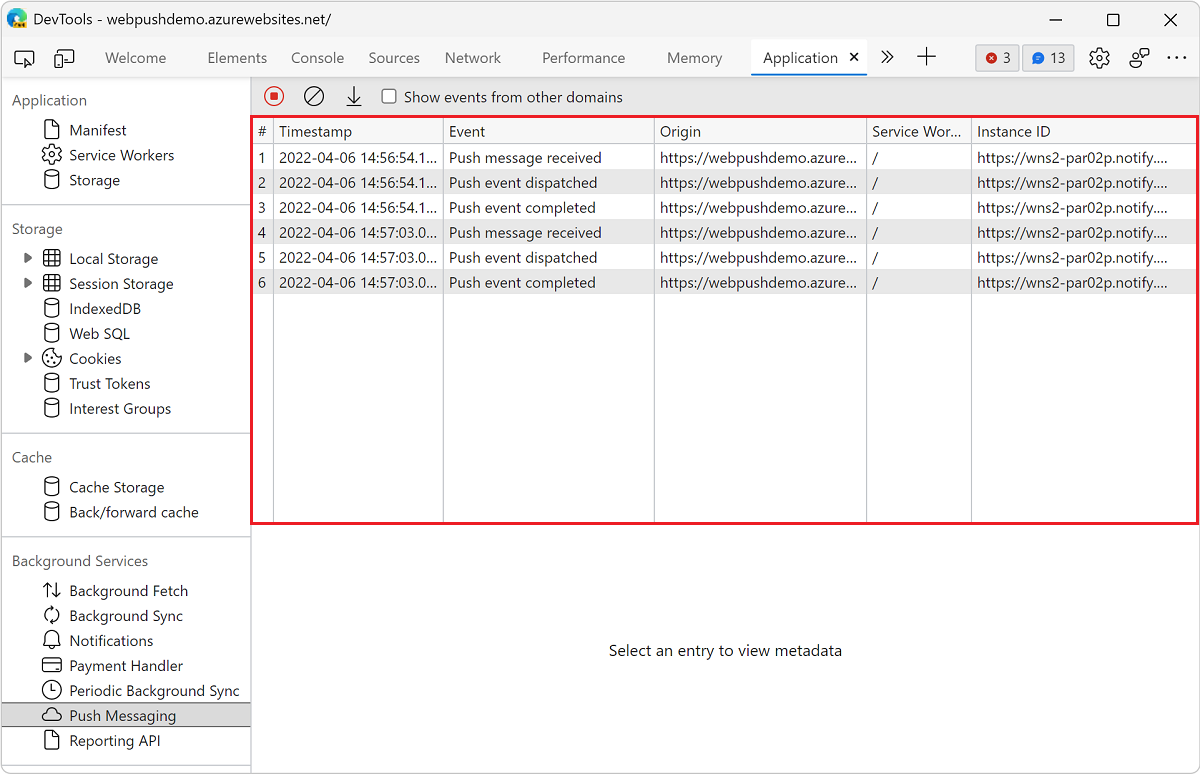
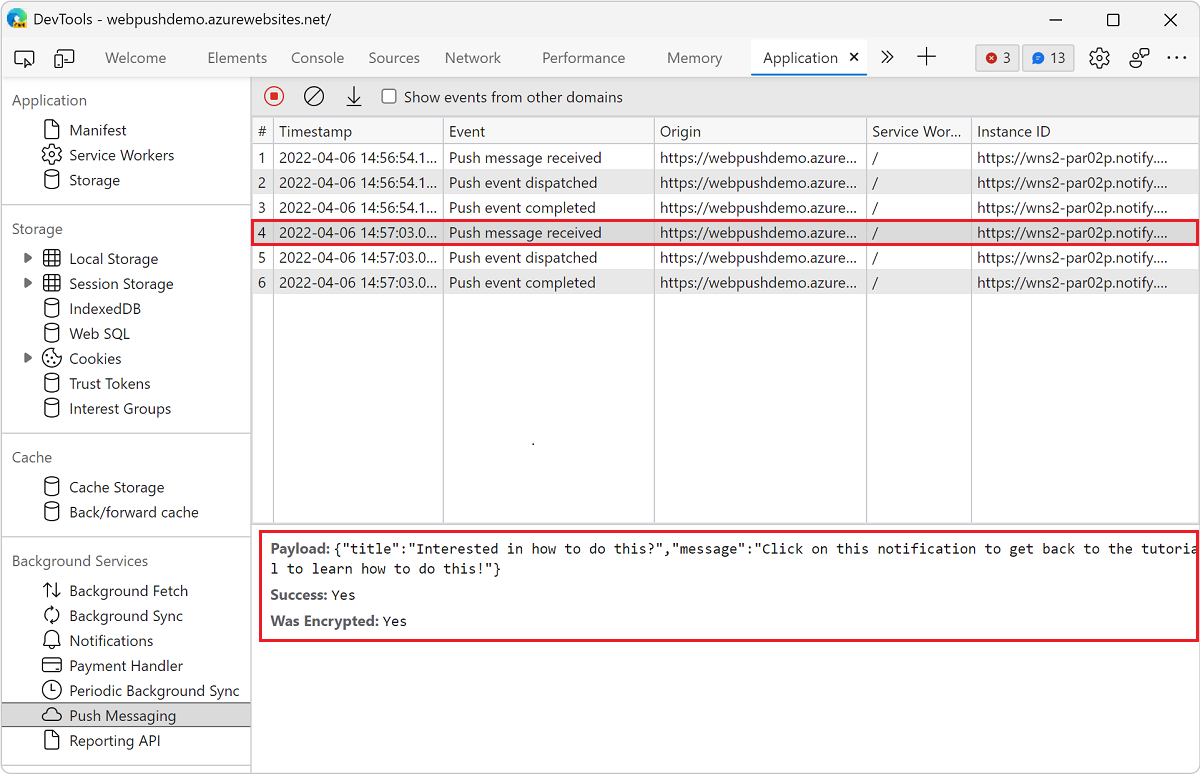
Click an event to view the details in the space below the table.
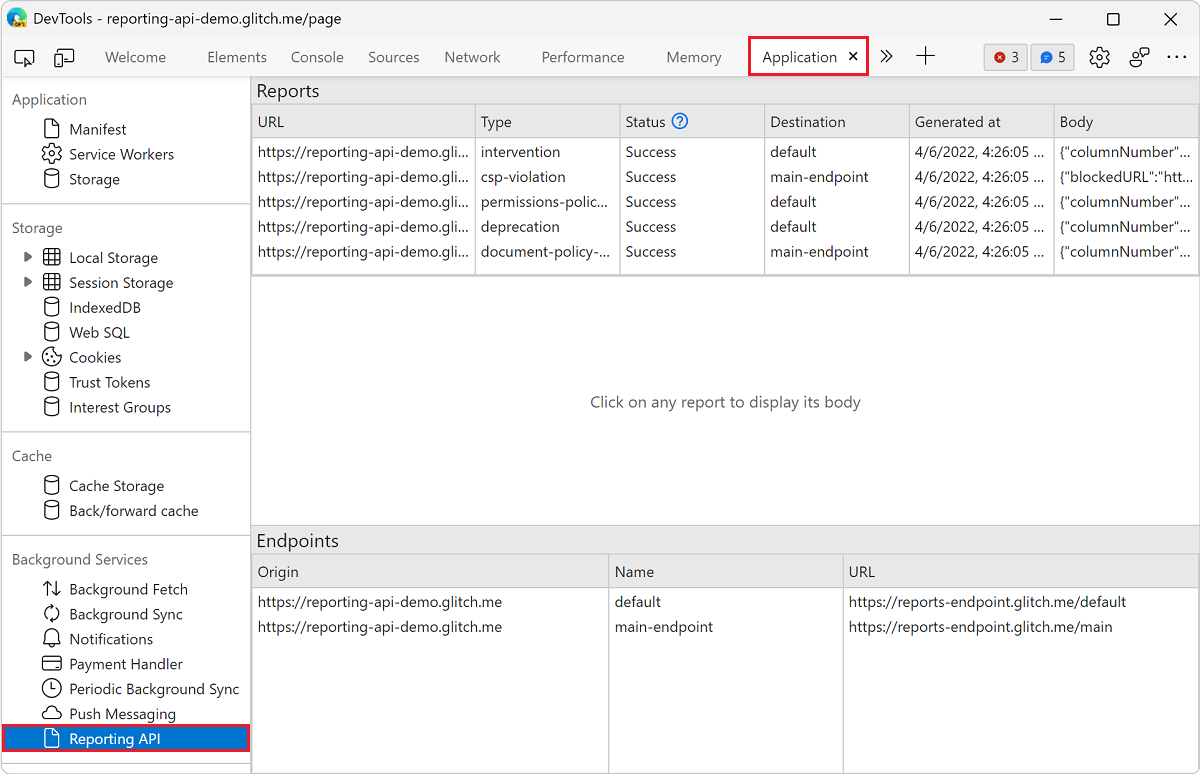
Reporting API
The Reporting API enables web developers to receive reports of security violations, deprecated API calls, and others, from their production websites.
To see reports that have been sent by the browser using the Reporting API:
Open DevTools by right-clicking the webpage and selecting Inspect. Or by pressing Ctrl+Shift+I (Windows, Linux) or Command+Option+I (macOS).
In DevTools, on the main toolbar, select the Application tab. If that tab isn't visible, click the More tabs (
) button, or else the More Tools () button.On the left, in the Background Services section, select Reporting API. The Reporting API page opens.
The Reporting API page displays the reports sent in the table at the top.
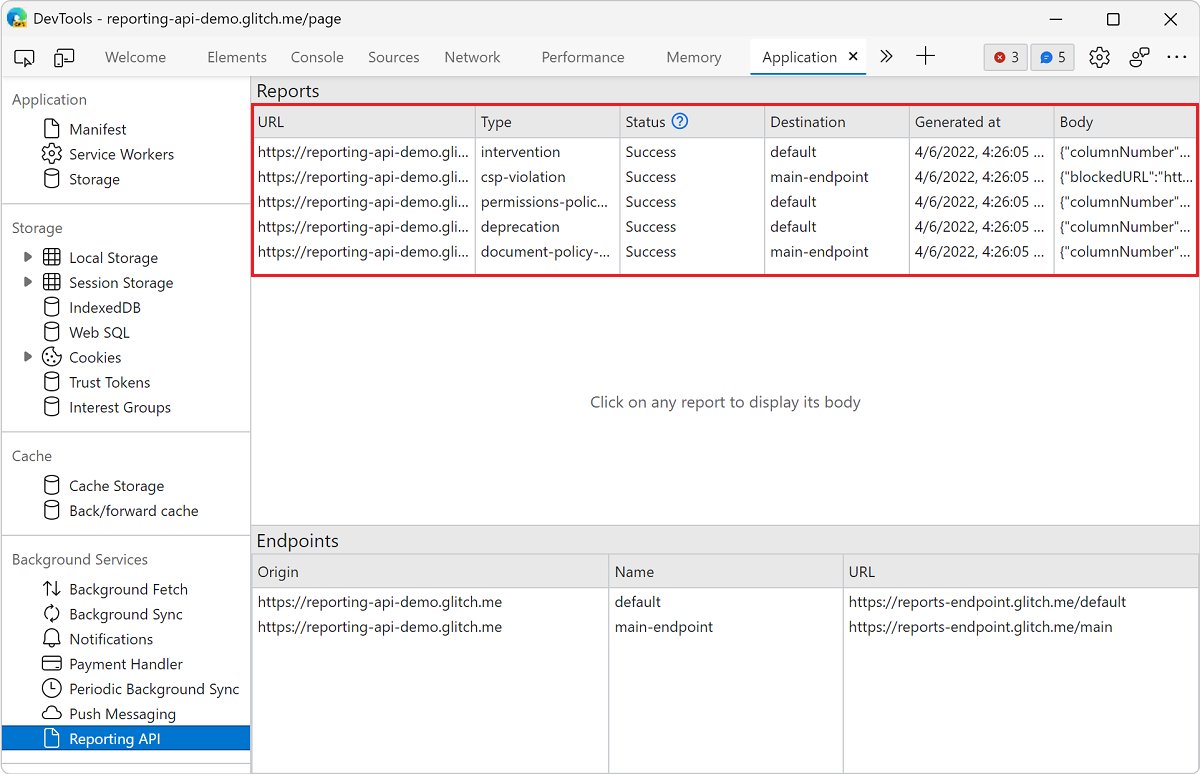
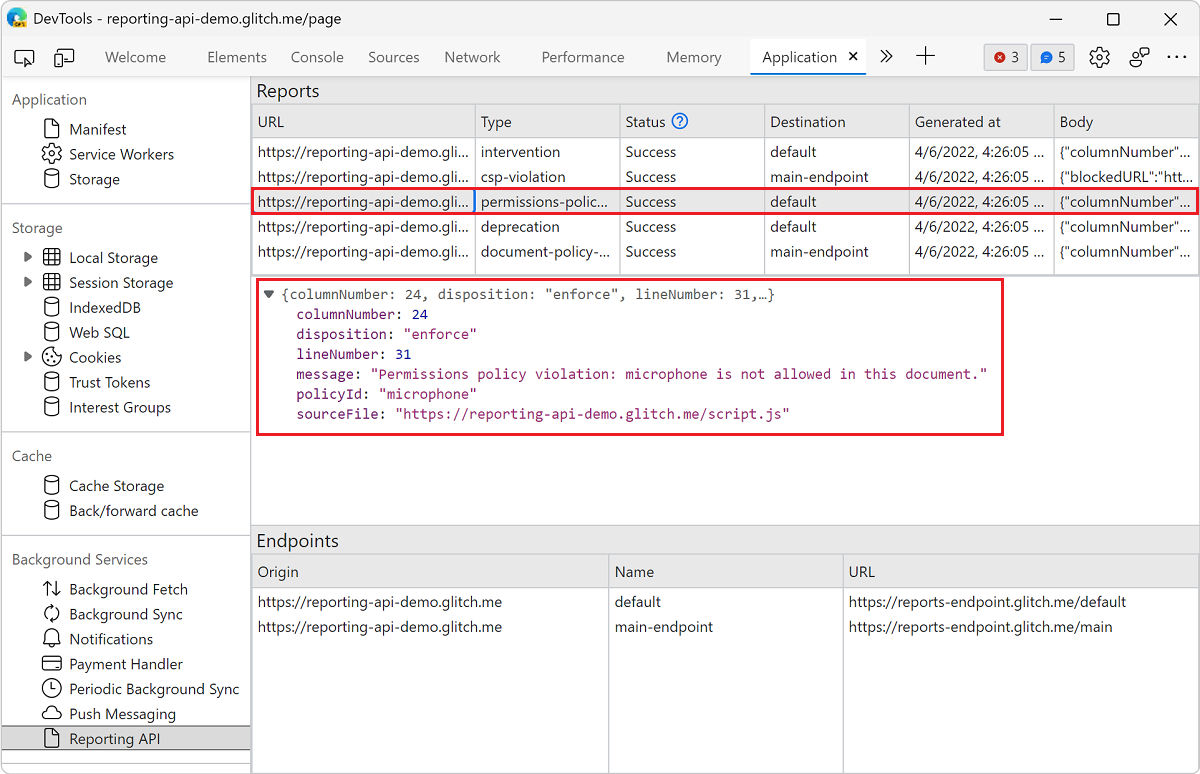
Click a report to view the details in the space below the table.
The Reporting API page also displays the list of reporting endpoints configured via the
Reporting-EndpointsHTTP header in the table at the bottom.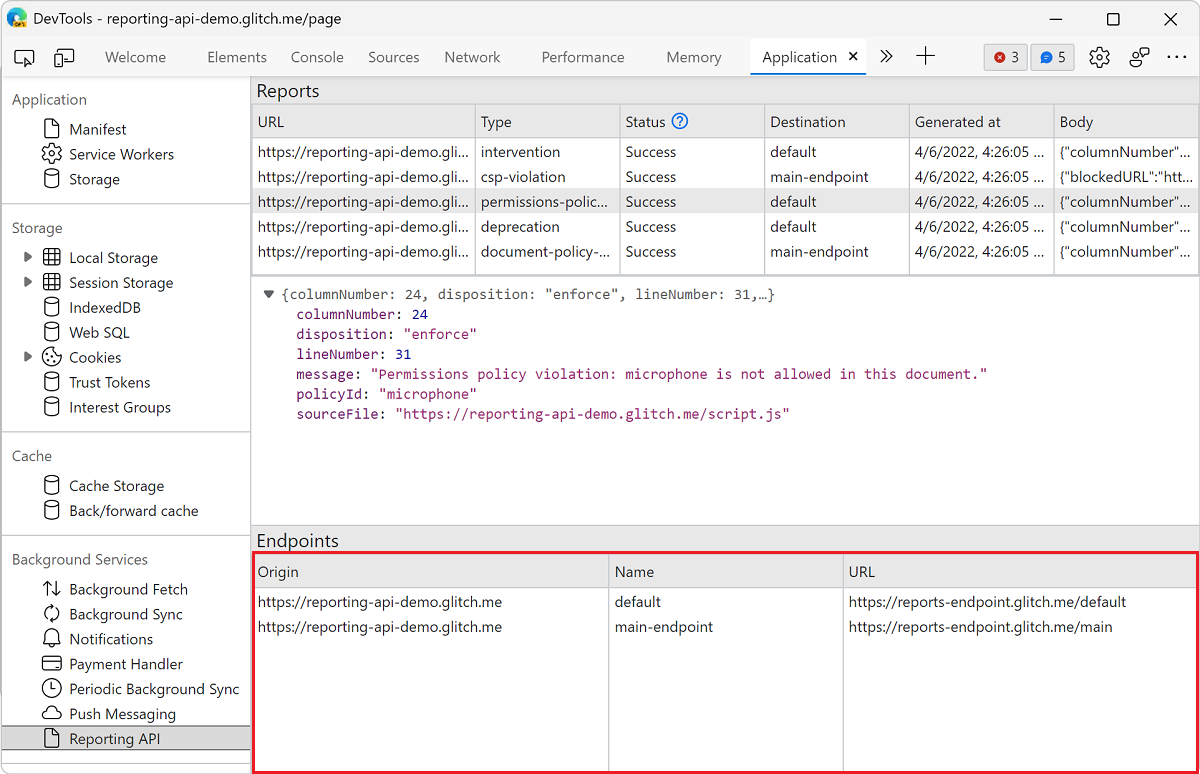
Note
Portions of this page are modifications based on work created and shared by Google and used according to terms described in the Creative Commons Attribution 4.0 International License.
The original page is found here and is authored by Kayce Basques (Technical Writer, Chrome DevTools & Lighthouse).
![]() This work is licensed under a Creative Commons Attribution 4.0 International License.
This work is licensed under a Creative Commons Attribution 4.0 International License.
Feedback
Coming soon: Throughout 2024 we will be phasing out GitHub Issues as the feedback mechanism for content and replacing it with a new feedback system. For more information see: https://aka.ms/ContentUserFeedback.
Submit and view feedback for