What's New in DevTools (Microsoft Edge 84)
To check out the latest features of Microsoft Edge DevTools and the Microsoft Edge DevTools extension for Microsoft Visual Studio Code and Visual Studio, read these announcements.
To stay up to date and get the latest DevTools features, download an Insiders preview version of Microsoft Edge. Whether you're on Windows, Linux, or macOS, consider using Canary (or another preview channel) as your default development browser. The Beta, Dev, and Canary versions of Microsoft Edge run as separate apps, side-by-side with the stable, released version of Microsoft Edge. See Microsoft Edge Insider Channels.
For the latest announcements, follow the Microsoft Edge team on Twitter. To report a problem with DevTools or ask for a new feature, file an issue in the MicrosoftEdge/DevTools repo.
Announcements from the Microsoft Edge DevTools team
Use the DevTools in Windows high contrast mode
Microsoft Edge DevTools is now displayed in high-contrast mode when Windows is in high-contrast mode.
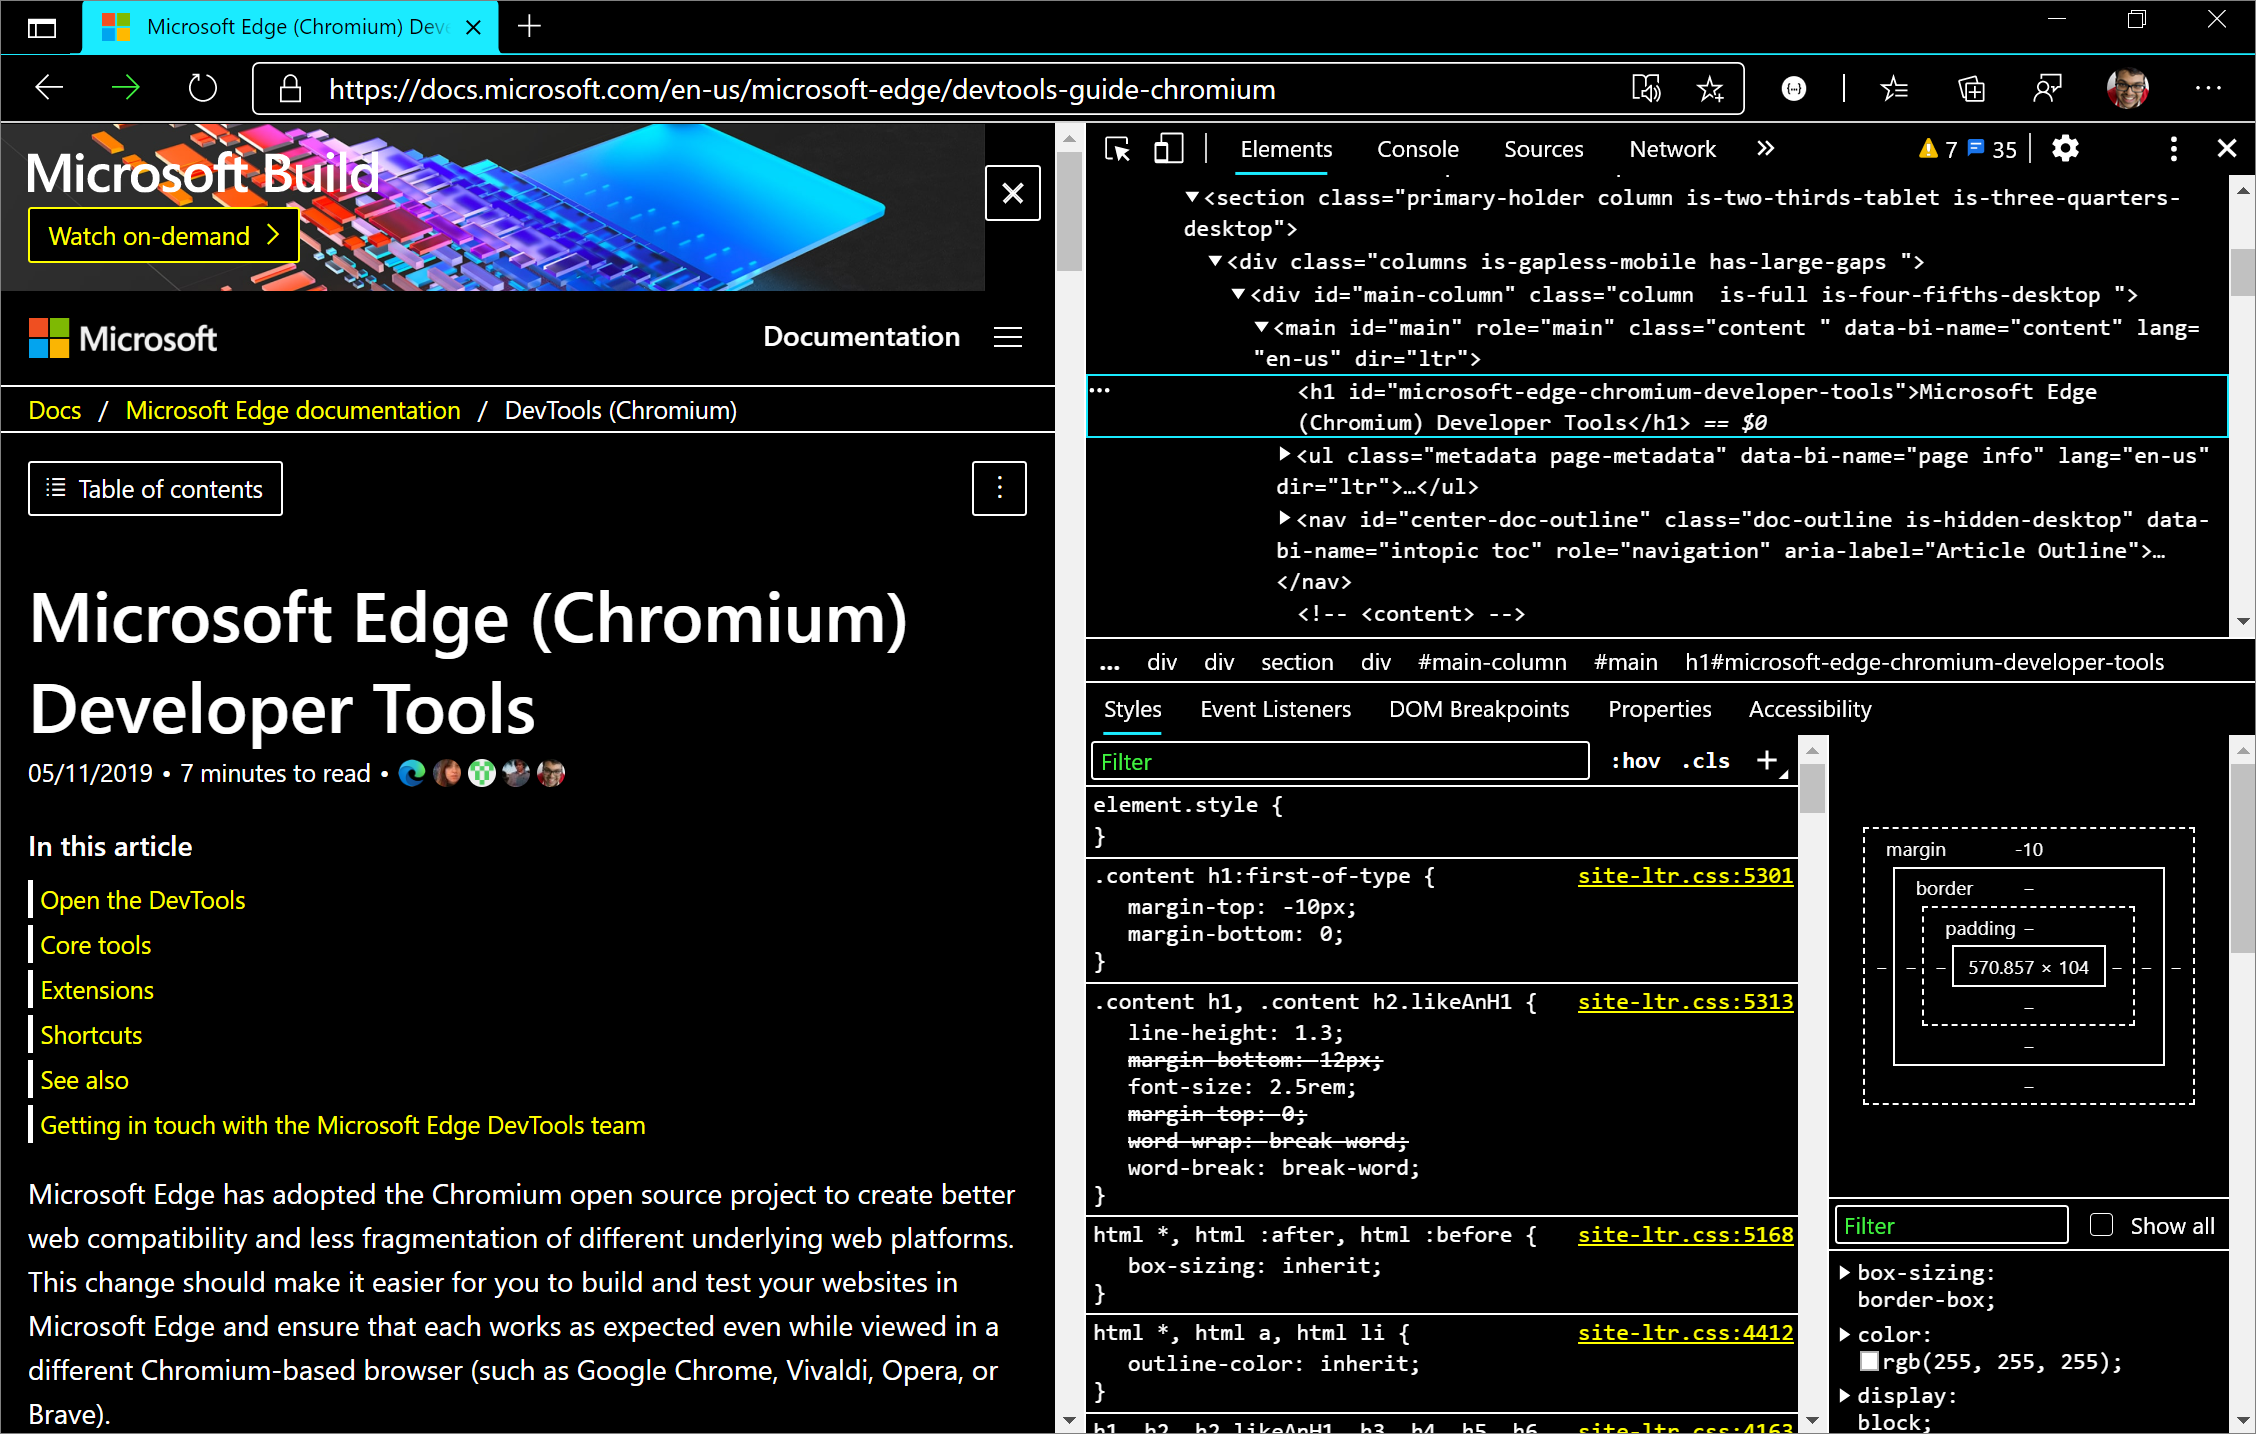
Follow the instructions to turn on high-contrast mode in Windows. To open DevTools in Microsoft Edge, select F12 or Ctrl+Shift+I. DevTools is displayed in high-contrast mode.
Note: DevTools currently supports high-contrast mode on Windows, but not on macOS.
Chromium issue #1048378
See also:
Match keyboard shortcuts in the DevTools to Visual Studio Code
From your feedback and the Chromium public issue tracker, the Microsoft Edge DevTools team learned that you wanted to be able to customize keyboard shortcuts in DevTools. In Microsoft Edge 84, you can now match keyboard shortcuts in DevTools to Visual Studio Code, which is just one of the features the team is working on for shortcut customization.
To try the experiment:
In DevTools, open Settings by pressing ? or clicking the Settings (
 ) icon in DevTools.
In the Experiments section, select the checkbox Enable custom keyboard shortcuts settings tab (requires reload).
Reload DevTools.
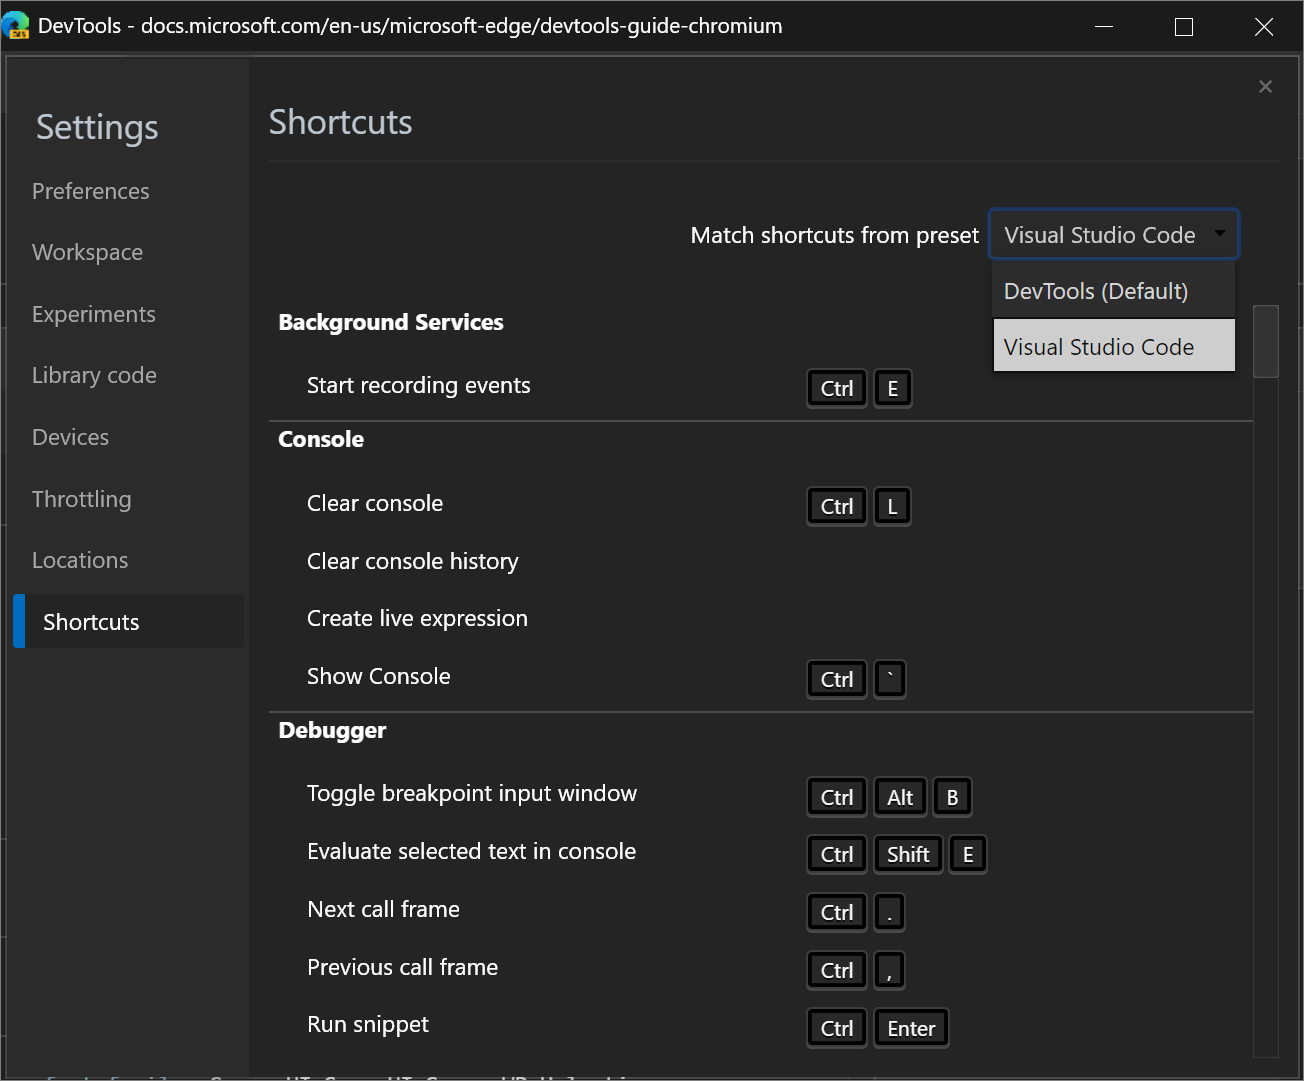
Open Settings again, and select the Shortcuts section.
Click the Match shortcuts from preset dropdown list, select DevTools (Default), and then select Visual Studio Code.
The keyboard shortcuts in DevTools now match the shortcuts for equivalent actions in Visual Studio Code.
For example, the keyboard shortcut for pausing or continuing running a script in Visual Studio Code is F5. With the DevTools (Default) preset, that same shortcut in DevTools is F8, but with the Visual Studio Code preset, that shortcut is now also F5.
The feature is currently available in Microsoft Edge 84 as an experiment, so please share your feedback with the team!
Chromium issue #174309
See also:
Remote debug Surface Duo emulators
You can now remotely debug your web content that's running in the Surface Duo emulator using the full power of Microsoft Edge DevTools.
With the Surface Duo emulator, you can test how your web content renders on a new class of foldable and dual-screen devices. The emulator runs the Android operating system and provides the Microsoft Edge Android app. Load your web content in the Microsoft Edge app and debug it with DevTools:

The edge://inspect page in a desktop instance of Microsoft Edge shows the SurfaceDuoEmulator with a list of the open tabs or PWAs that are running on the Surface Duo emulator:
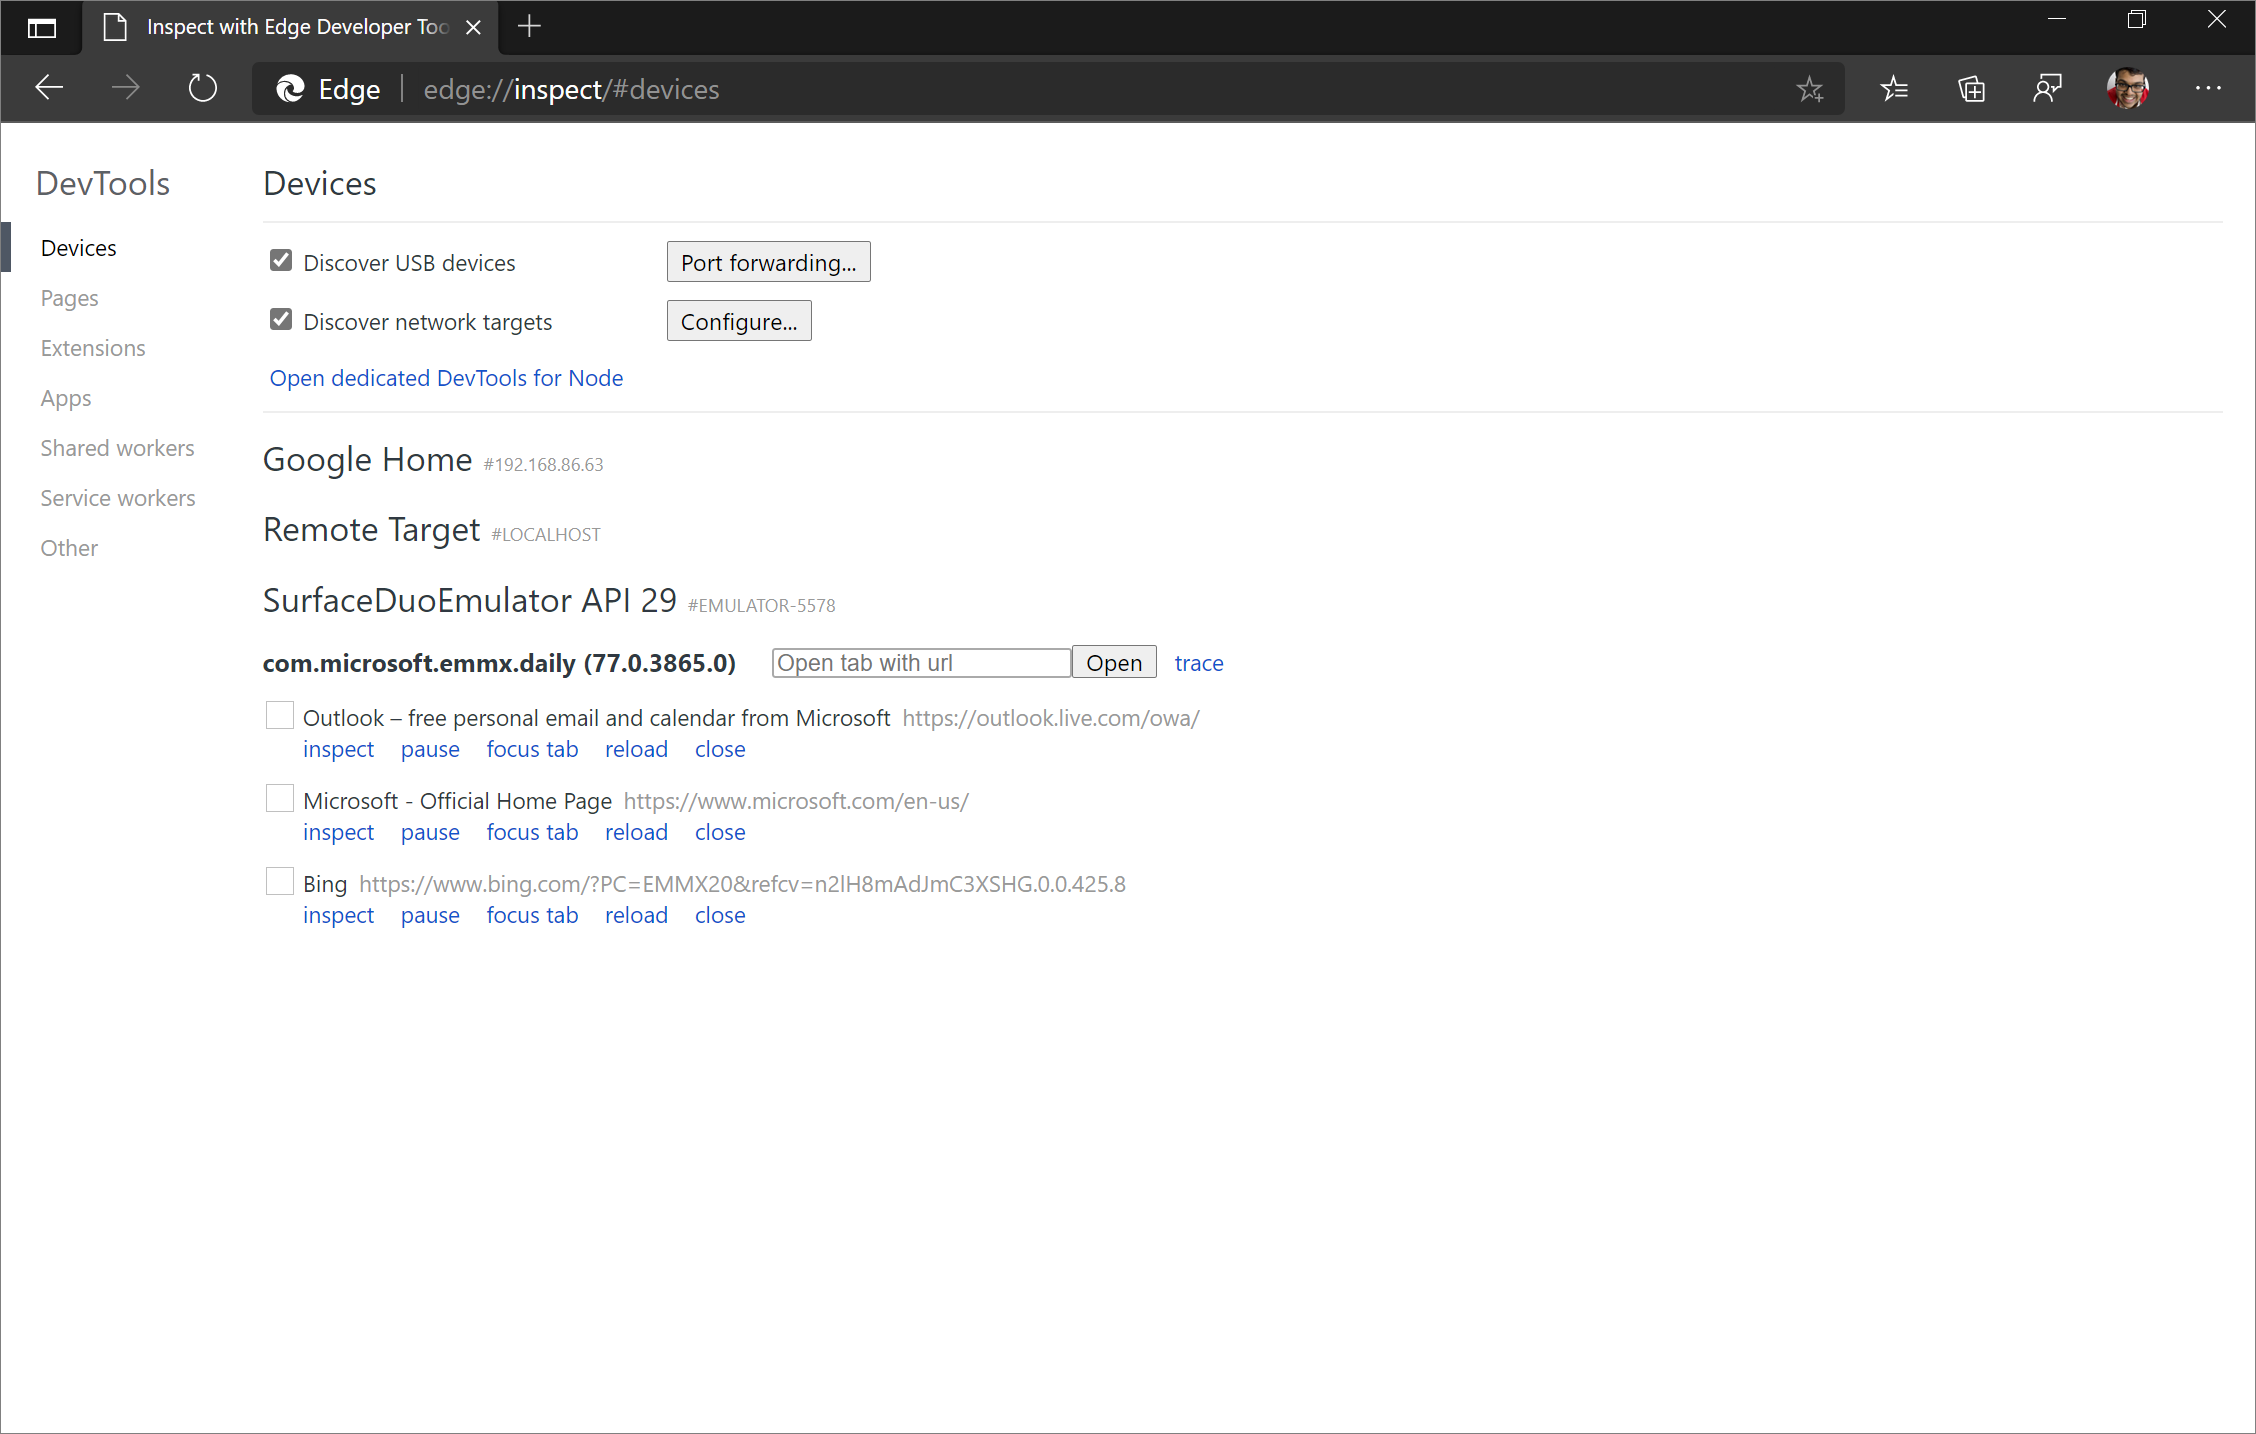
Click inspect for the tab or PWA that you want to debug, to open DevTools. Follow the step-by-step guide to remotely debug your web content on the Surface Duo emulator: Remotely debug Surface Duo emulators.
Resize the DevTools drawer more easily
In Microsoft Edge 83 or earlier, you resized the DevTools Drawer by hovering inside the toolbar of the drawer. The drawer behaved differently than the other resize controls for panes in DevTools where you hover on the border of the pane to resize it. The following image shows how resizing the drawer worked in Microsoft Edge version 83 or earlier:

Starting with Microsoft Edge 84, you can resize the drawer by hovering over the border. This change aligns the behavior for resizing the DevTools drawer with other panes in DevTools. The following image shows how resizing the drawer works in Microsoft Edge 84 or later:

Chromium issue #1076112
Screencasting navigation buttons display focus
When remote debugging an Android device, a Windows 10 or later device, or a Surface Duo emulator, you can toggle screencasting with the ![]() icon in the top-left corner of DevTools. With screencasting enabled, you can navigate the tab in Microsoft Edge on the remote device from the DevTools window.
icon in the top-left corner of DevTools. With screencasting enabled, you can navigate the tab in Microsoft Edge on the remote device from the DevTools window.
In Microsoft Edge 84, these navigation buttons are now also keyboard-accessible. For example, pressing Shift+Tab from the screencasted URL bar puts focus on the Refresh button:

Chromium issue #1081486
Network panel Details pane is now accessible
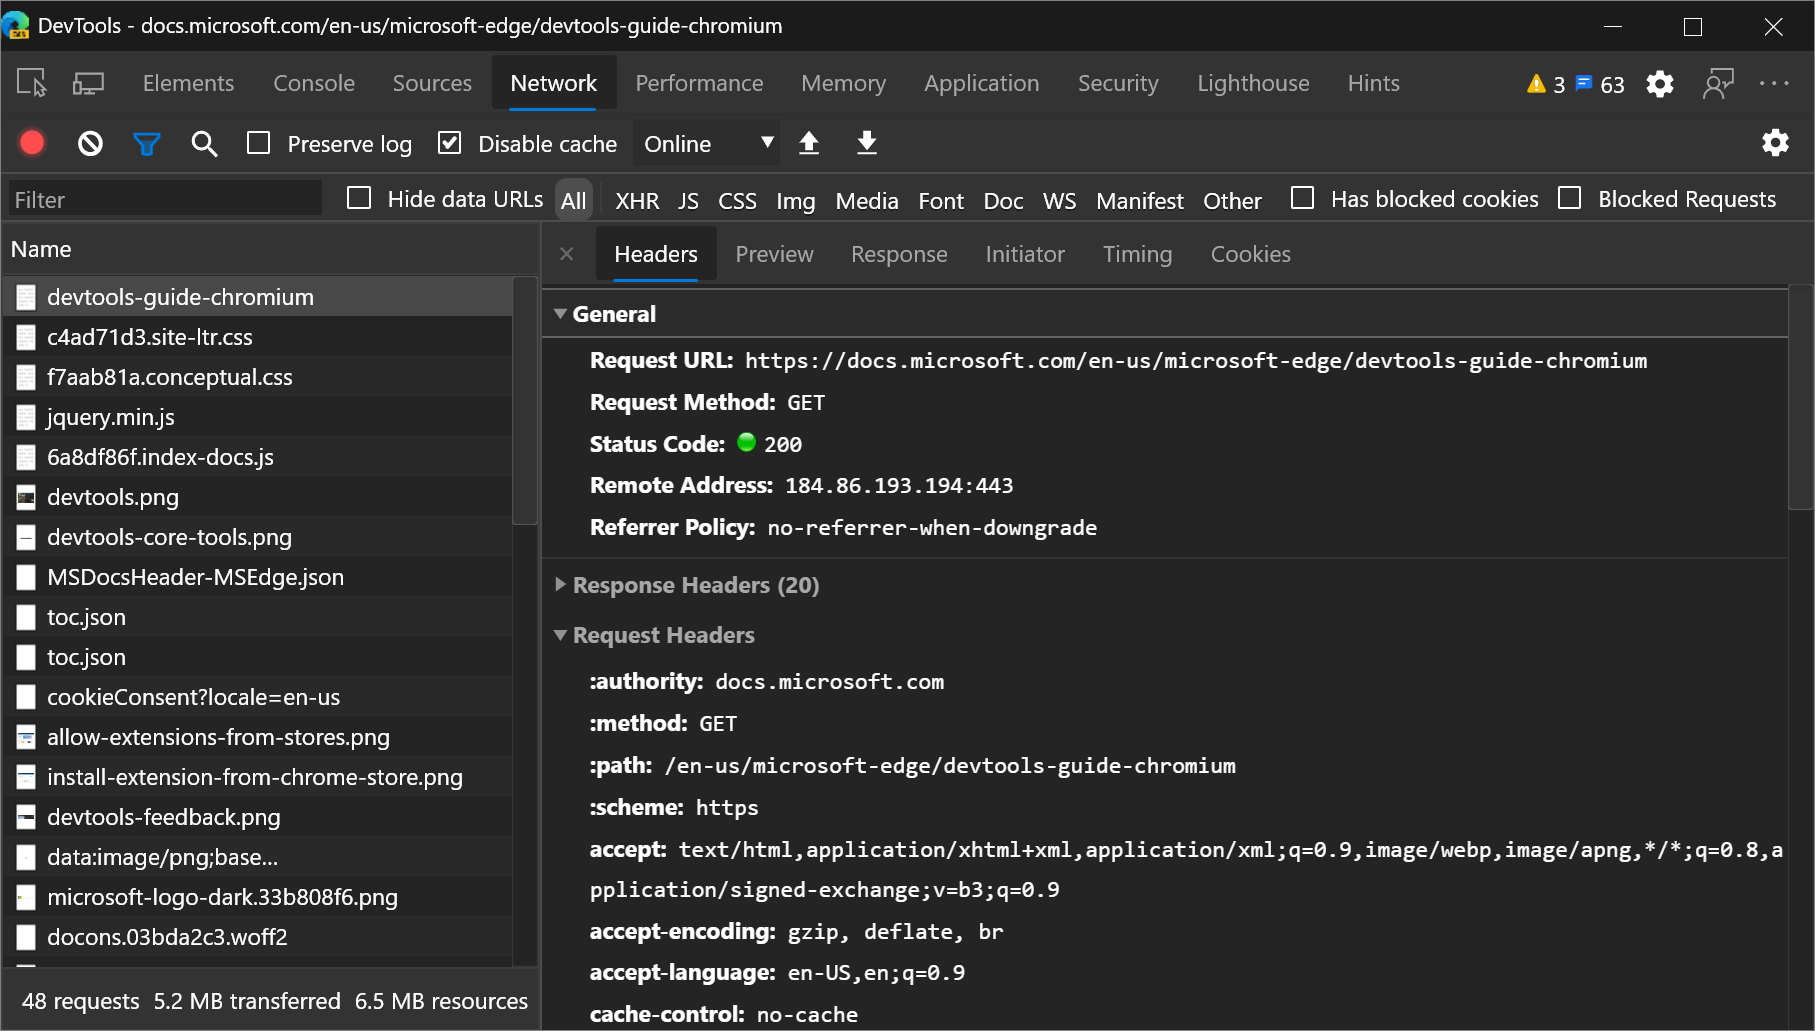
In Microsoft Edge 84, the Details pane in the Network tool now takes focus when you open it for a resource in the Network Log. This change allows screen readers to read out and interact with the content of the Details pane.
Chromium issue #963183
Announcements from the Chromium project
The following sections announce additional features available in Microsoft Edge 84 that were contributed to the open source Chromium project.
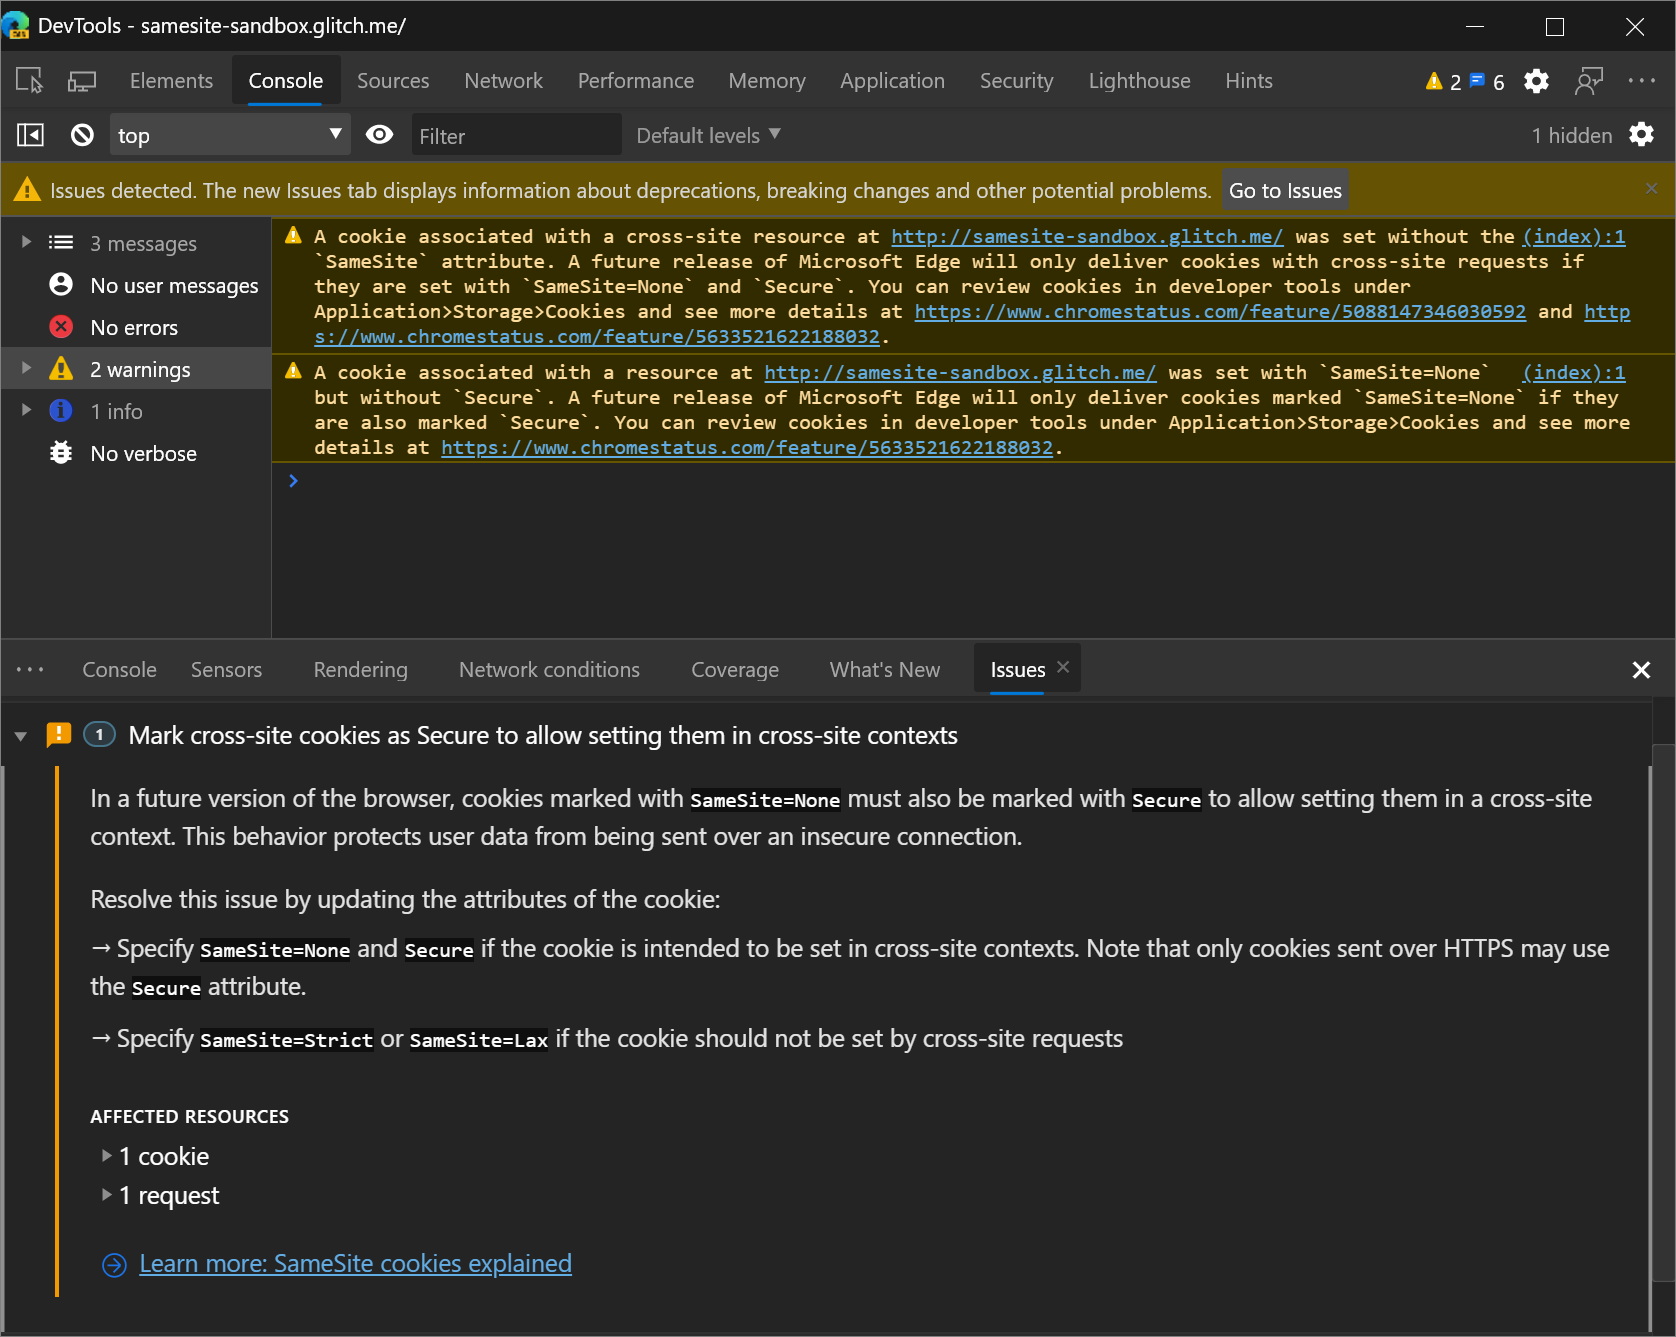
Fix site issues with the new Issues tool in the DevTools Drawer
The new Issues tool in the Drawer at the bottom of DevTools reduces the notification fatigue and clutter of the Console. Currently, the Console is the central place for website developers, libraries, frameworks, and Microsoft Edge to log messages, warnings, and errors. The Issues tool aggregates warnings from the browser in a structured, aggregated, and actionable way. The Issues tool links to affected resources within DevTools, and provides guidance on how to fix the issues.
Over time, more warnings will be surfaced in the Issues tool rather than in the Console, to streamline the Console messages.
To get started, see Find and fix problems using the Issues tool.
Chromium issue #1068116
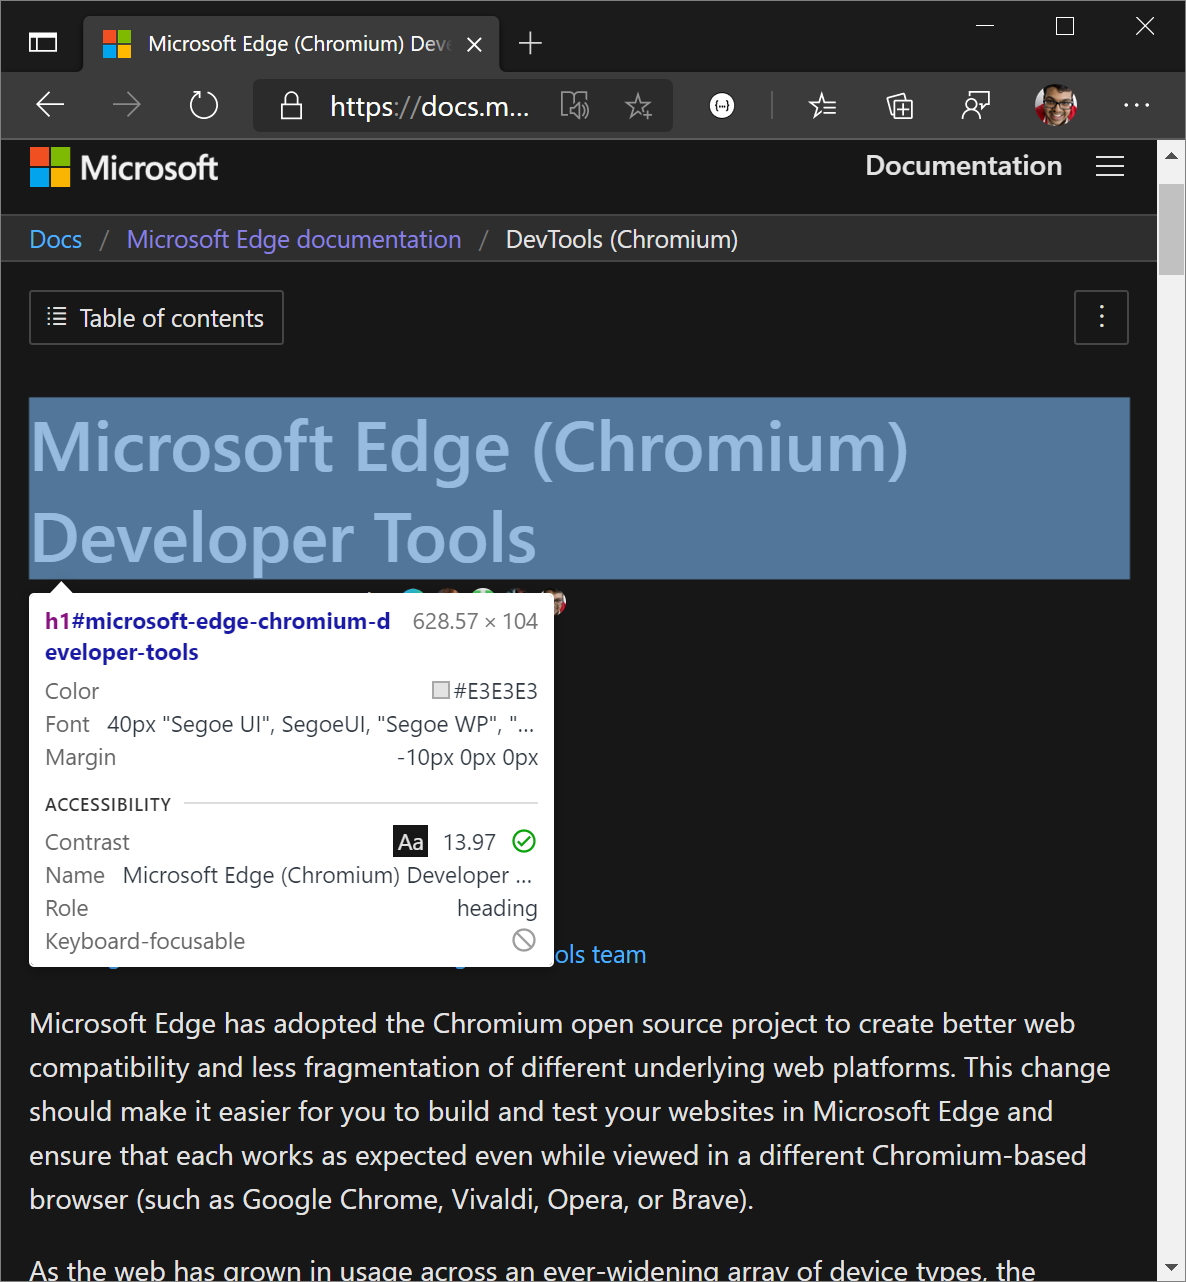
View accessibility information in the Inspect Mode tooltip
The Inspect Mode tooltip now indicates whether the element has an accessible name and role and is keyboard-focusable.
Chromium issue #1040025
See also:
Performance panel updates
See also:
View Total Blocking Time information in the footer
After recording your load performance, the Performance panel now shows Total Blocking Time (TBT) information in the footer. TBT is a load performance metric that helps quantify how long a page takes to become usable. TBT essentially measures how long a page only appears to be usable (because the content is rendered to the screen); but the page isn't actually usable, because JavaScript is blocking the main thread and therefore the page doesn't respond to user input. TBT is the main metric for approximating First Input Delay.
To get Total Blocking Time information, don't use the Refresh Page ![]() workflow for recording page load performance.
workflow for recording page load performance.
Instead, select Record ![]() , manually reload the page, wait for the page to load, and then stop recording.
, manually reload the page, wait for the page to load, and then stop recording.
If Total Blocking Time: Unavailable is displayed, Microsoft Edge DevTools did not get the required information from the internal profiling data in Microsoft Edge.

Chromium issue #1054381
See also:
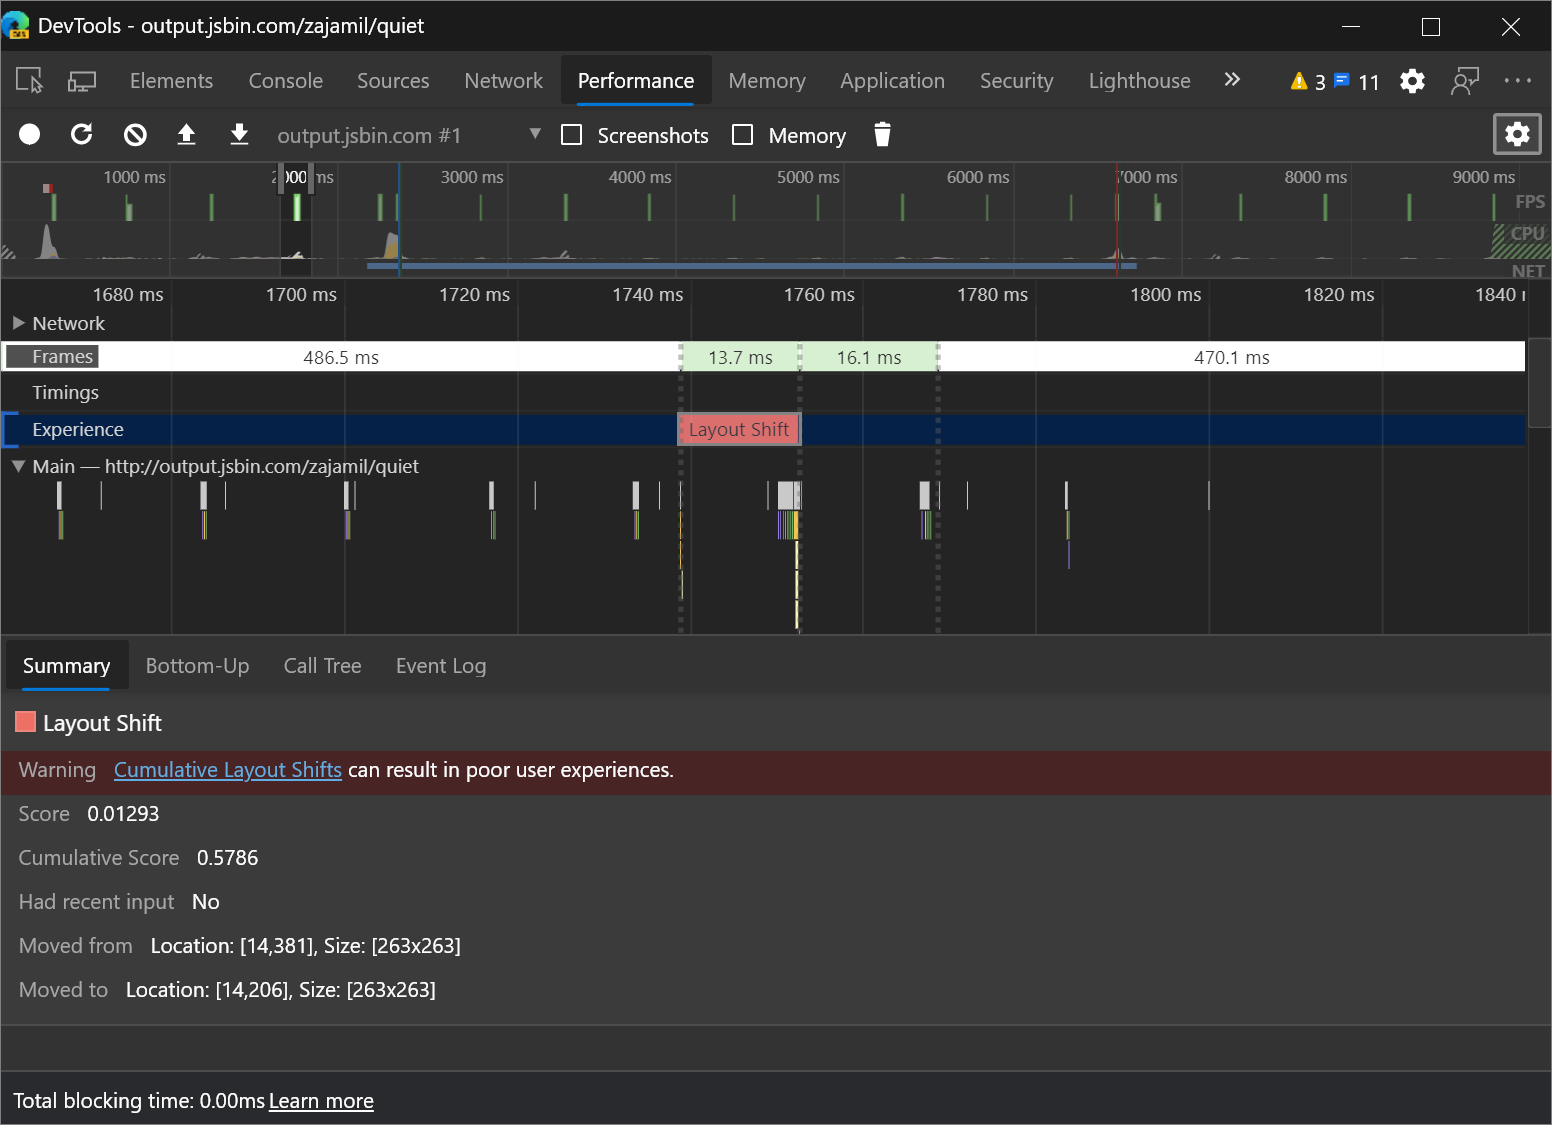
Layout Shift events in the new Experience section
The new Experience section of the Performance panel helps you detect layout shifts. Cumulative Layout Shift (CLS) is a metric that helps you quantify unwanted visual instability.
Click the Layout Shift event to display the details of the layout shift in the Summary pane. Hover on the Moved from and Moved to fields to visualize where the layout shift occurred.
See also:
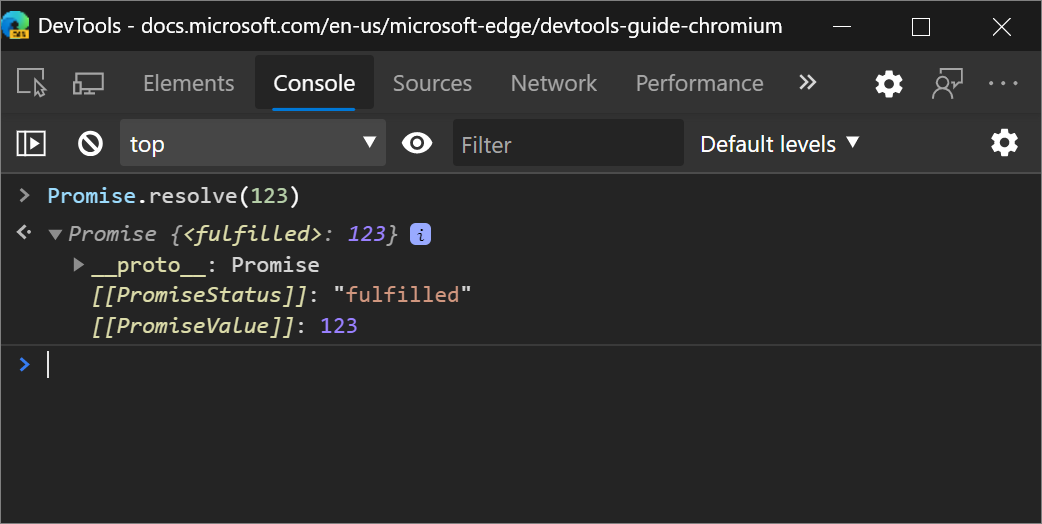
More accurate promise terminology in the Console
When logging a Promise, the Console incorrectly provided PromiseStatus value set to resolved.

The Console now uses the term fulfilled, which aligns with the Promise specification. For more information about the Promise specification, see States and Fates on GitHub.
V8 issue #6751
See also:
Styles pane updates
See also:
Support for the revert keyword
The autocomplete UI of the Styles pane now detects the revert CSS keyword, which reverts the cascaded value of a property to the previous value applied to the styling of the element.

Chromium issue #1075437
See also:
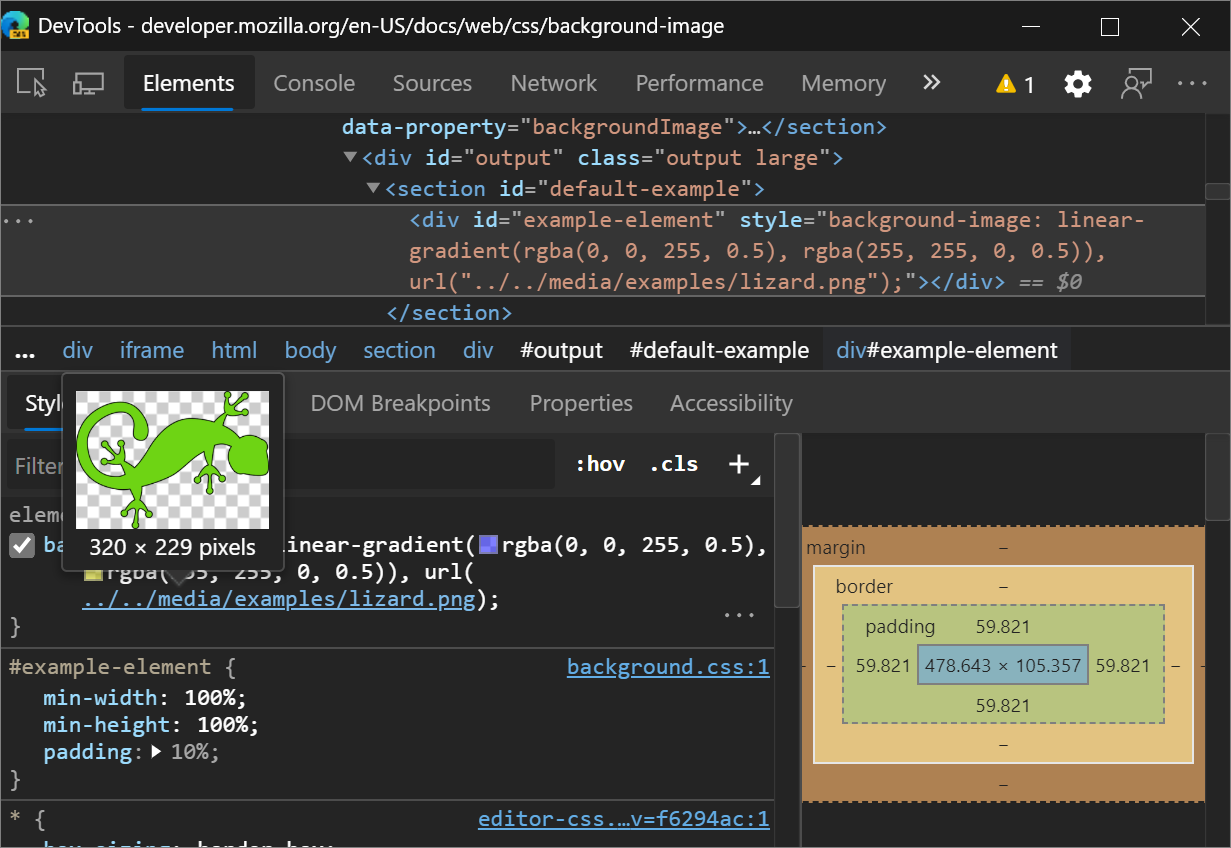
Image previews
Hover on a background-image value in the Styles pane to display a preview of the image in a tooltip.
Chromium issue #1040019
See also:
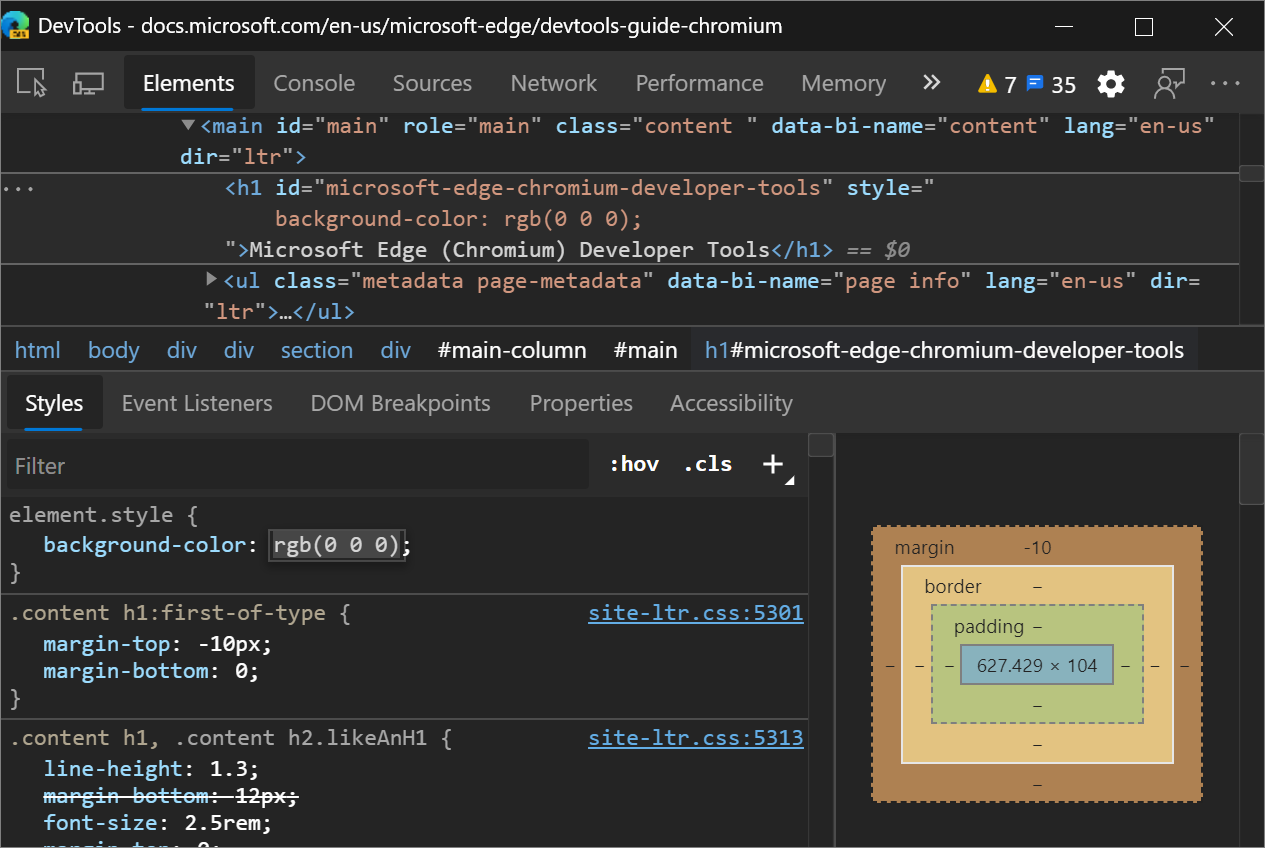
Color Picker now uses space-separated functional color notation
CSS Color Module Level 4 specifies that color functions, such as rgb(), should support space-separated
arguments. For example, rgb(0, 0, 0) is equivalent to rbg(0 0 0).
When you select colors with the Color Picker or alternate between color representations in the Styles pane by holding Shift and selecting the background-color value, the space-separated argument syntax is displayed.
You should also display the syntax in the Computed pane and the Inspect Mode tooltip.
Microsoft Edge DevTools is using the new syntax because upcoming CSS features such as color() don't support the deprecated comma-separated argument syntax.
The space-separated argument syntax has been supported in most browsers for a while. See Can I use: Space-separated functional color notations?
Chromium issue #1072952
Deprecation of the Properties pane in the Elements panel
The Properties pane in the Elements tool is deprecated. Run console.dir($0) in the Console instead.

Reference
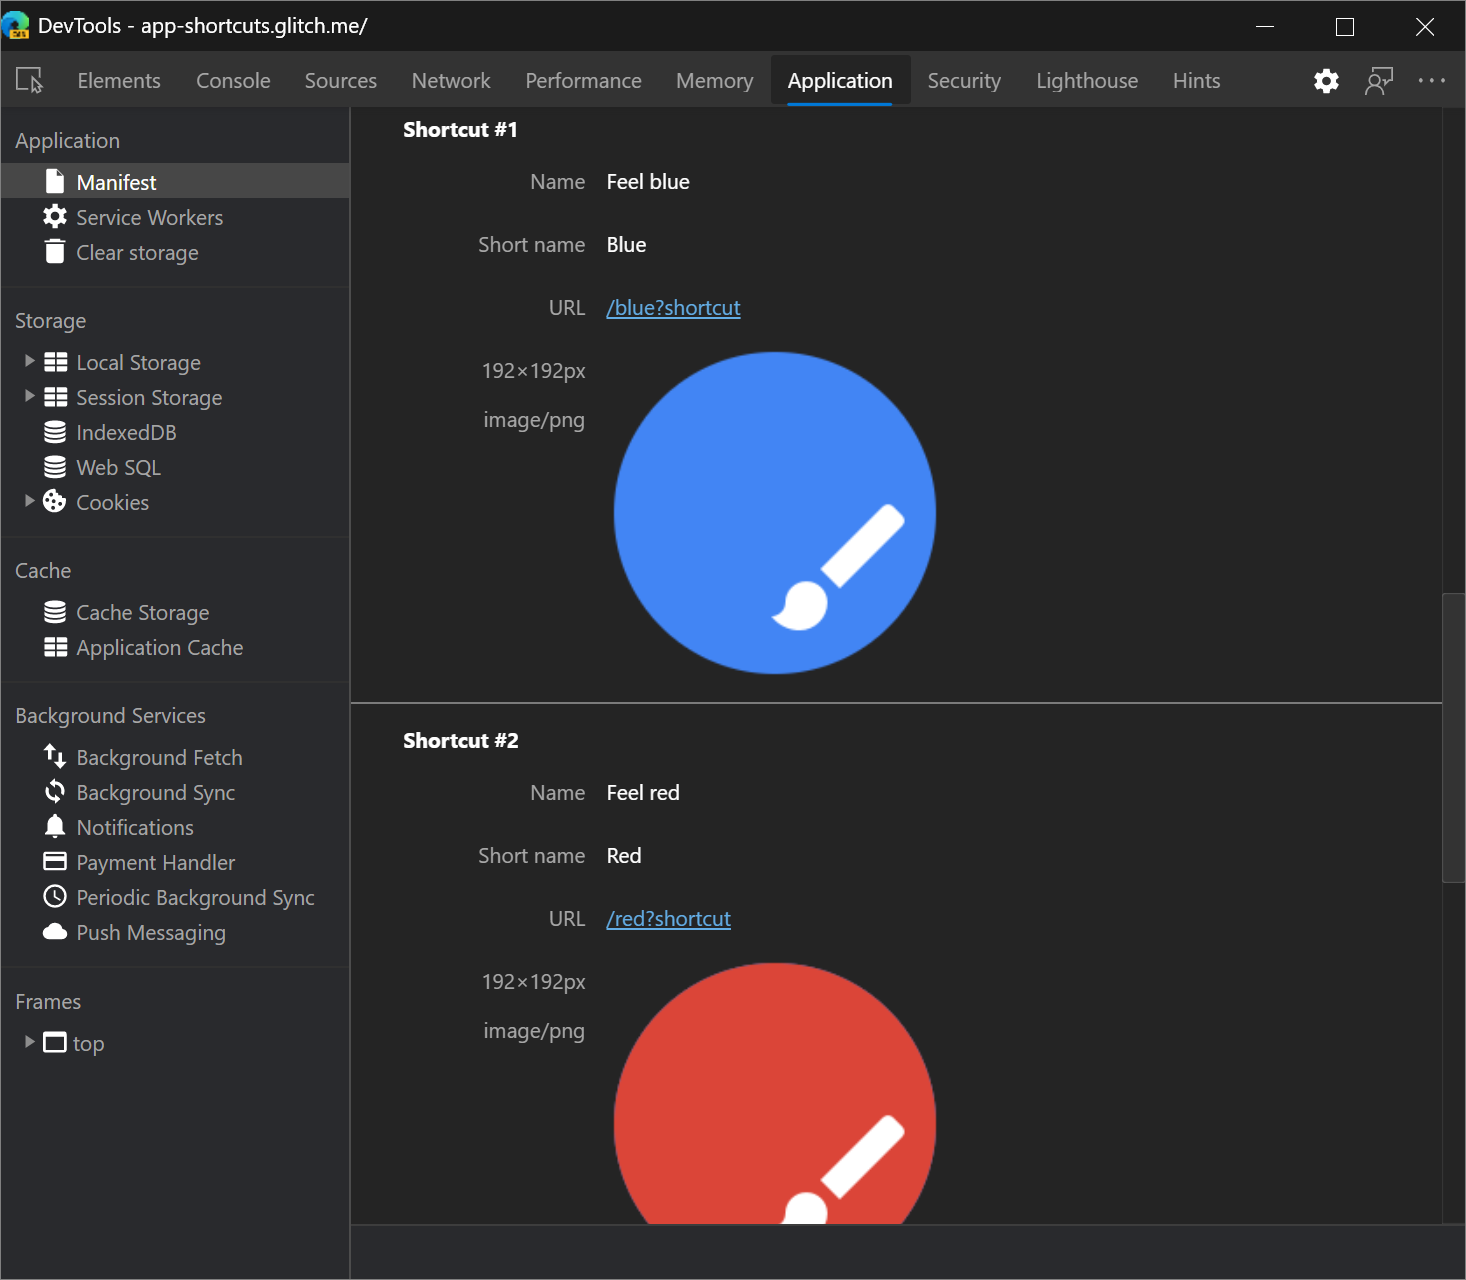
App shortcuts support in the Manifest pane
In the Application tool, the Manifest page now shows app shortcuts. App shortcuts help users quickly start common or recommended tasks within a web app. The app shortcuts menu is shown only for Progressive Web Apps that are installed on the user's desktop or mobile device.
See also:
Note
Portions of this page are modifications based on work created and shared by Google and used according to terms described in the Creative Commons Attribution 4.0 International License. The original page is found here and is authored by Kayce Basques (Technical Writer, Chrome DevTools & Lighthouse).
![]() This work is licensed under a Creative Commons Attribution 4.0 International License.
This work is licensed under a Creative Commons Attribution 4.0 International License.
Feedback
Coming soon: Throughout 2024 we will be phasing out GitHub Issues as the feedback mechanism for content and replacing it with a new feedback system. For more information see: https://aka.ms/ContentUserFeedback.
Submit and view feedback for