Referrals insights summary – A dashboard to know how your referrals are performing
Appropriate roles: Referrals admin
Note
Referral analytics can be accessed from both the Insights workspace and the Referrals workspace.
The Summary page under the Analyze section of Referrals lets you see how your referrals are performing. This section also provides a view on the solutions you've published. Review these metrics regularly to identify trends or areas that need attention and start driving toward your business goal.
- Solutions outlook
- Referrals
- Co-sell opportunities
- Leads
- Referrals distribution
- QRP performance
- Referrals acceptance time
- Referrals win time
- Revenue
Important
This page provides summary of Referrals, that is, leads and co-sell opportunities. Navigate to respective dashboards to view detailed insights.
Navigating the summary dashboard
Summary dashboard has many page level features for improved user experience and usability.
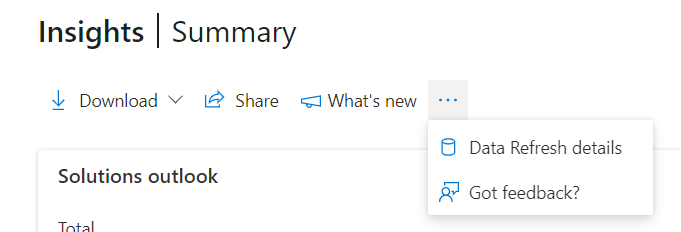
Download
You can download the dashboard as PDF by clicking on Download option.
Share
You can share the link or screenshot to this page via Email or Teams.
What's new
You can view all the updates related to the page in this section. You can also take a Quick tour and Page guide tour from this panel.
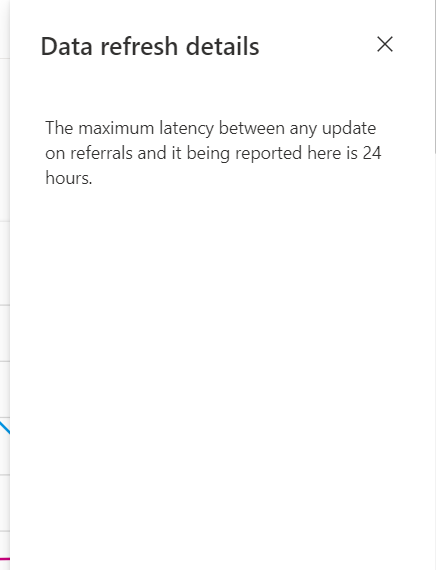
Data refresh details and Feedback
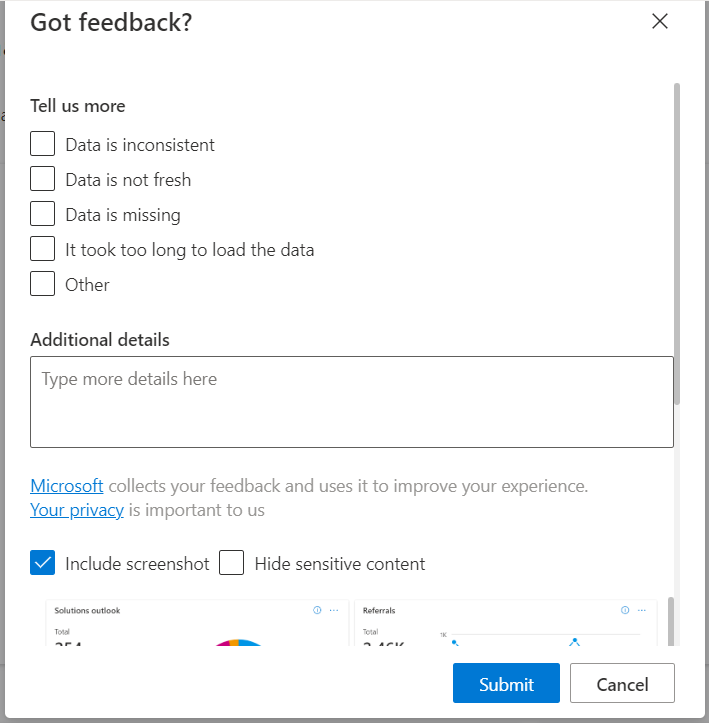
You can view the data refresh details for all the widgets available in the page. You can also share your feedback at page level along with screenshot and other details.
Time range filters
You can find a time range selection at the top-right corner of each page. The output of the overview page graphs can be customized by selecting a time range based on the past 1, 3, 6, or 12 months, or by selecting a custom time range. The default time range selection is three months.
Feedback button
Each widget in the page is incorporated with a feedback button to let you provide instant feedback with screenshots and other details.
Solutions outlook
This widget shows the overview of solutions you've published. You can view the breakup of solutions with co-sell eligibility.
- In market: Solutions that are eligible to be upgraded to co-sell ready
- Co-sell ready: Solutions that meet the requirements for co-sell ready
- Azure IP co-sell eligible: Solutions that have Azure IP co-sell eligibility requirements met
This widget will always show data for current date. Data won't update when the time range is changed. Co-sell ready solutions that have met Azure IP co-sell eligibility requirements aren't counted under the Co-sell ready section to avoid double counting.
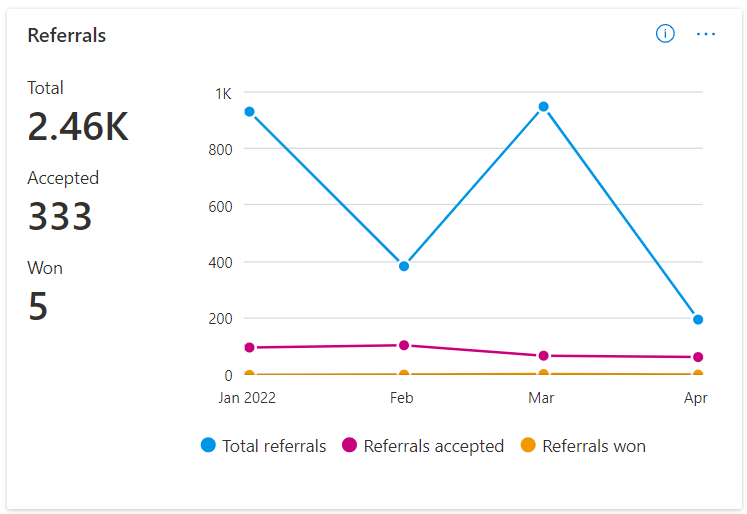
Referrals
This widget shows the total number of referrals, referrals accepted, and referrals marked as won, along with their trends for the selected time range.
Co-sell opportunities
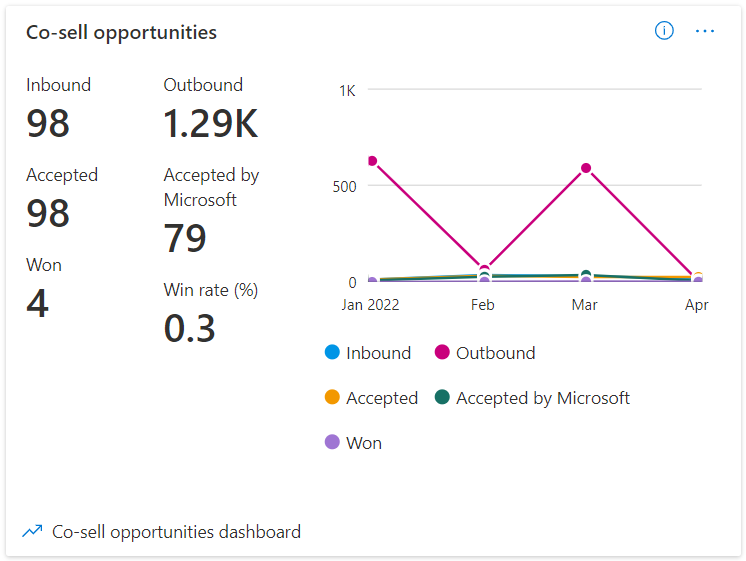
This widget shows the insights for co-sell opportunities for selected time range. You can see the number of inbound co-sell deals, number of outbound co-sell deals, accepted deals, deals accepted by Microsoft, deals marked as won, and win rate. You can also view the trends for the selected period.
- Inbound: Number of inbound co-sell opportunities received in the selected period
- Outbound: Number of outbound co-sell opportunities created by you in the selected period
- Accepted: Number of inbound co-sell opportunities accepted by you in the selected period
- Accepted by Microsoft: Number of outbound co-sell opportunities accepted by Microsoft when help is needed from Microsoft
- Won: Number of co-sell opportunities marked as won in the selected period
- Win rate = Won/(Accepted + Outbound) * 100
Note
You can gain additional insights into your co-sell opportunities by selecting the Co-sell opportunities dashboard link present in the lower-left corner of the widget.
Leads
This widget shows the insights for leads for selected time range. You can see the number of page views, CTA clicks, received leads, accepted, leads marked as won, and win rate. You can also view the trends for the selected period.
- Page views: Number of page views on partner's business profile
- CTA clicks: Number of CTA clicks on partner's business profile
- Received: Number of leads received
- Accepted: Number of leads accepted by partners
- Won: Number of leads marked as won
- Win rate = Won/Accepted * 100
Note
You can gain additional insights into your leads by clicking the Leads dashboard link present in the lower-left corner of the widget.
Referrals distribution
This widget shows the distribution for leads and co-sell opportunities. You can view the current number for different types of referrals at each state.
Note
This widget doesn't show the funnel analysis, but it shows the current number for referrals at each state.
QRP performance
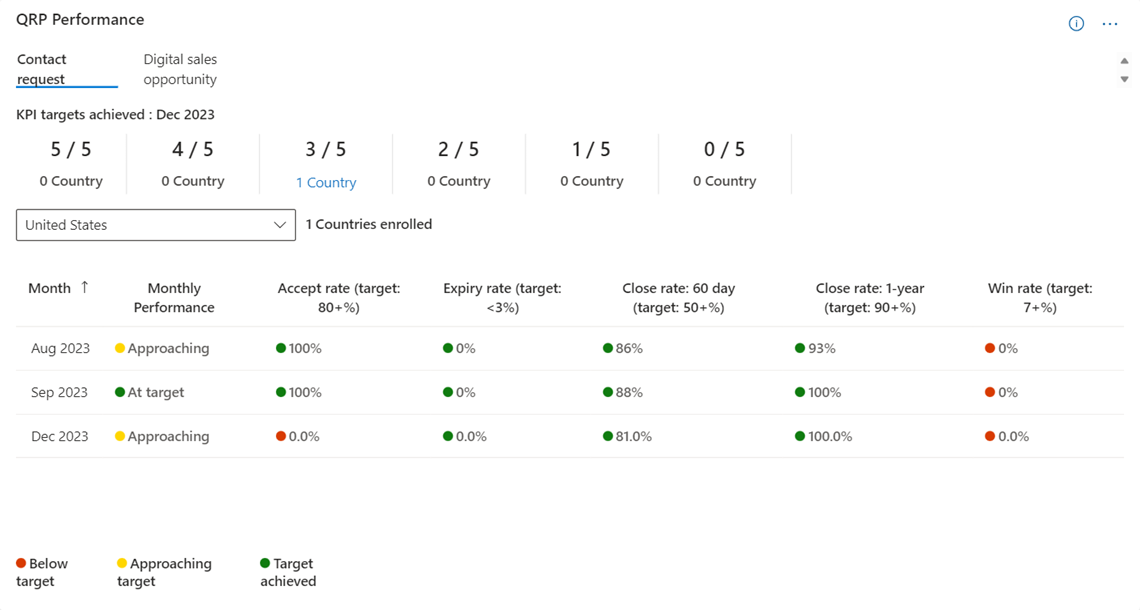
This widget shows the key metrics for Qualified Referral Program (QRP) performance. You can track the metrics for Contact request, Digital sales opportunity, Customer lifecycle management, and Co-sell deployment services programs and countries where your organization is receiving QRP referrals.
The distribution of countries/regions appears based on targets achieved. You can select the country/region from drop-down to view the relevant metrics.
Referrals acceptance time
This widget shows the distribution of acceptance time for both co-sell and leads. This gives you behavioral insights of how you're acting on incoming referrals.
Referrals win time
This widget shows the distribution of time taken for deals to be marked as Won. This widget gives you insights on how much time it takes for any referral to be marked as won.
Revenue
This widget shows the trend of referrals won value and IP co-sell approved value to track business performance. You can also view the breakup of referrals won value between leads and co-sell.
Note
Referrals that are closed as error won't be considered in the insights widgets.
Next steps
Feedback
Coming soon: Throughout 2024 we will be phasing out GitHub Issues as the feedback mechanism for content and replacing it with a new feedback system. For more information see: https://aka.ms/ContentUserFeedback.
Submit and view feedback for


