Visualize hierarchical data with model-driven apps
When a table is configured to have a hierarchical self-referential relationship you can configure visualizations using that hierarchy. More information: Define and query hierarchically related data
The tables that have visualizations available by default include Account, Position, and User. In the grid view of these tables, you can see the icon depicting the hierarchy chart, to the left of the row name. The hierarchy icon isn’t present for all rows by default. The icon is shown for the rows that are related using the hierarchical relationship.

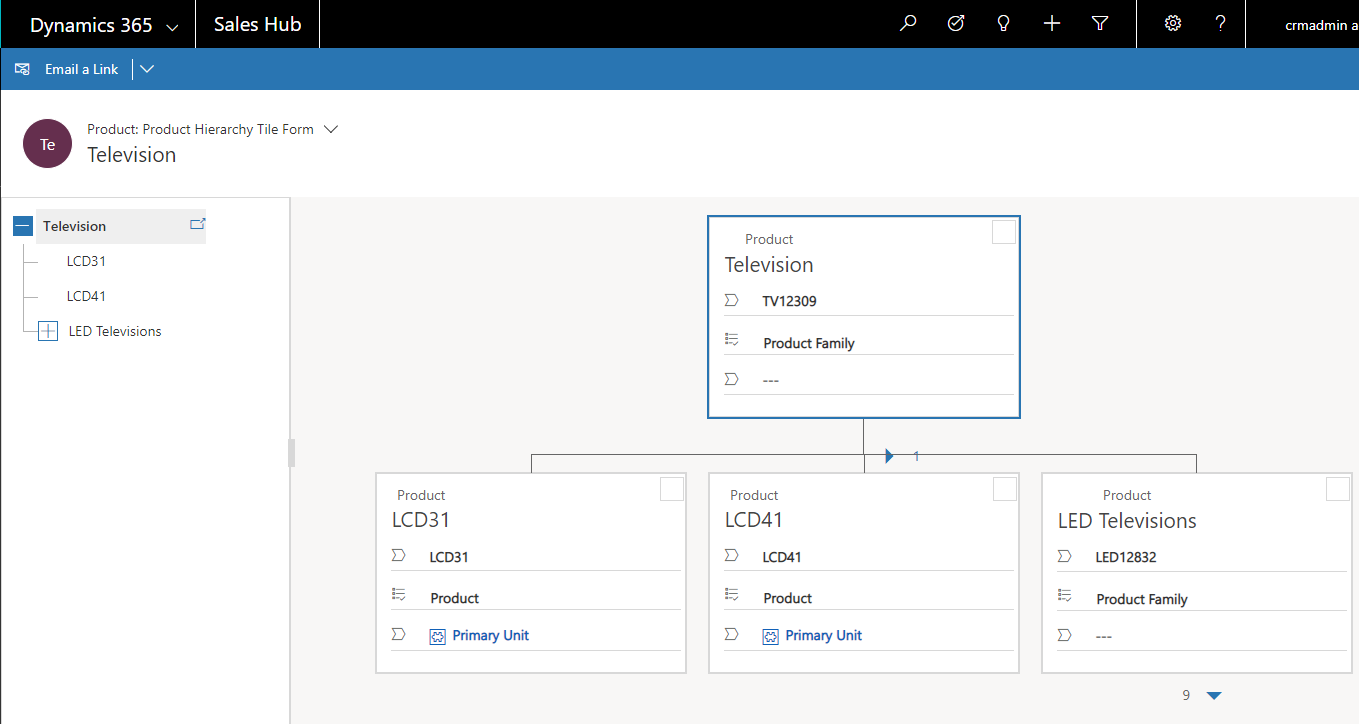
If you select the hierarchy icon, you can view the hierarchy, with the tree view on the left and the tile view on the right, as shown below:
A few other tables can be enabled for a hierarchy. These tables include Contact and Team. All custom tables can be enabled for a hierarchy.
Important things to remember
- Only one (1:N) self-referential relationship per table can be set as hierarchical. In a self-referential relationship the primary table and the related table must be of the same type.
- A hierarchy or visualization is based on one table only. You can depict the account hierarchy showing accounts at multiple levels, but you can’t show accounts and contacts in the same hierarchy visualization.
- The maximum number of columns that can be displayed in a tile is three with Unified Interface and four with the legacy web client. If you add more columns to the Quick Form that is used for the tile view, only the first three columns will be displayed.
Hierarchy settings
To enable visualizations for a hierarchy you must connect the hierarchy to a quick view form. This can only be done using solution explorer.
Open an unmanaged solution
From Power Apps select Solutions from the left navigation pane, and then on the toolbar, select Switch to classic. If the item isn’t in the side panel pane, select …More and then select the item you want.
In the All Solutions list open the unmanaged solution you want.
The hierarchy settings are associated to a table in the solution explorer.
While viewing tables, select Hierarchy Settings.
If an existing hierarchy setting exists you can edit it. Otherwise click New to create a new one.
Note
If the hierarchy settings do not exist the table is not eligible to have a hierarchy configured. There can be only one hierarchy setting
Set the data in the following columns:
| Column | Description |
|---|---|
| Name | Required. Add a unique name for the hierarchy settings. This is typically just the name of the table. This value will include the solution publisher's customization prefix. |
| Default Quick View Form | Required. Choose from an existing Quick View form or choose Create New to open the Quick View form editor to create a new one. |
| Hierarchical Relationship | Required. If a hierarchical relationship is already defined for the table the value will be set here. If there is no value, select Mark a relationship as enabled for hierarchies to open a dialog to choose one of the available self-referential relationships. |
| Description | Include a description of the purpose for this hierarchy so that future people customizing the system can understand why this was done. |
The same hierarchical settings for visualization are set once, but apply to both web and mobile clients. In tablets, the visuals render in a modified format suitable for the smaller form factor. The customizable components required for hierarchical visualization are solution aware, therefore, they can be transported between organizations like any other customization. You can configure the attributes shown in the visualization by customizing a Quick Form using the form editor.
Visualization walk through
Let’s look at an example of creating the visualization for a custom table. We created a custom table called new_Widget, created a (1:N) self-referential relationship new_new_widget_new_widget and marked it as hierarchical, as shown here.
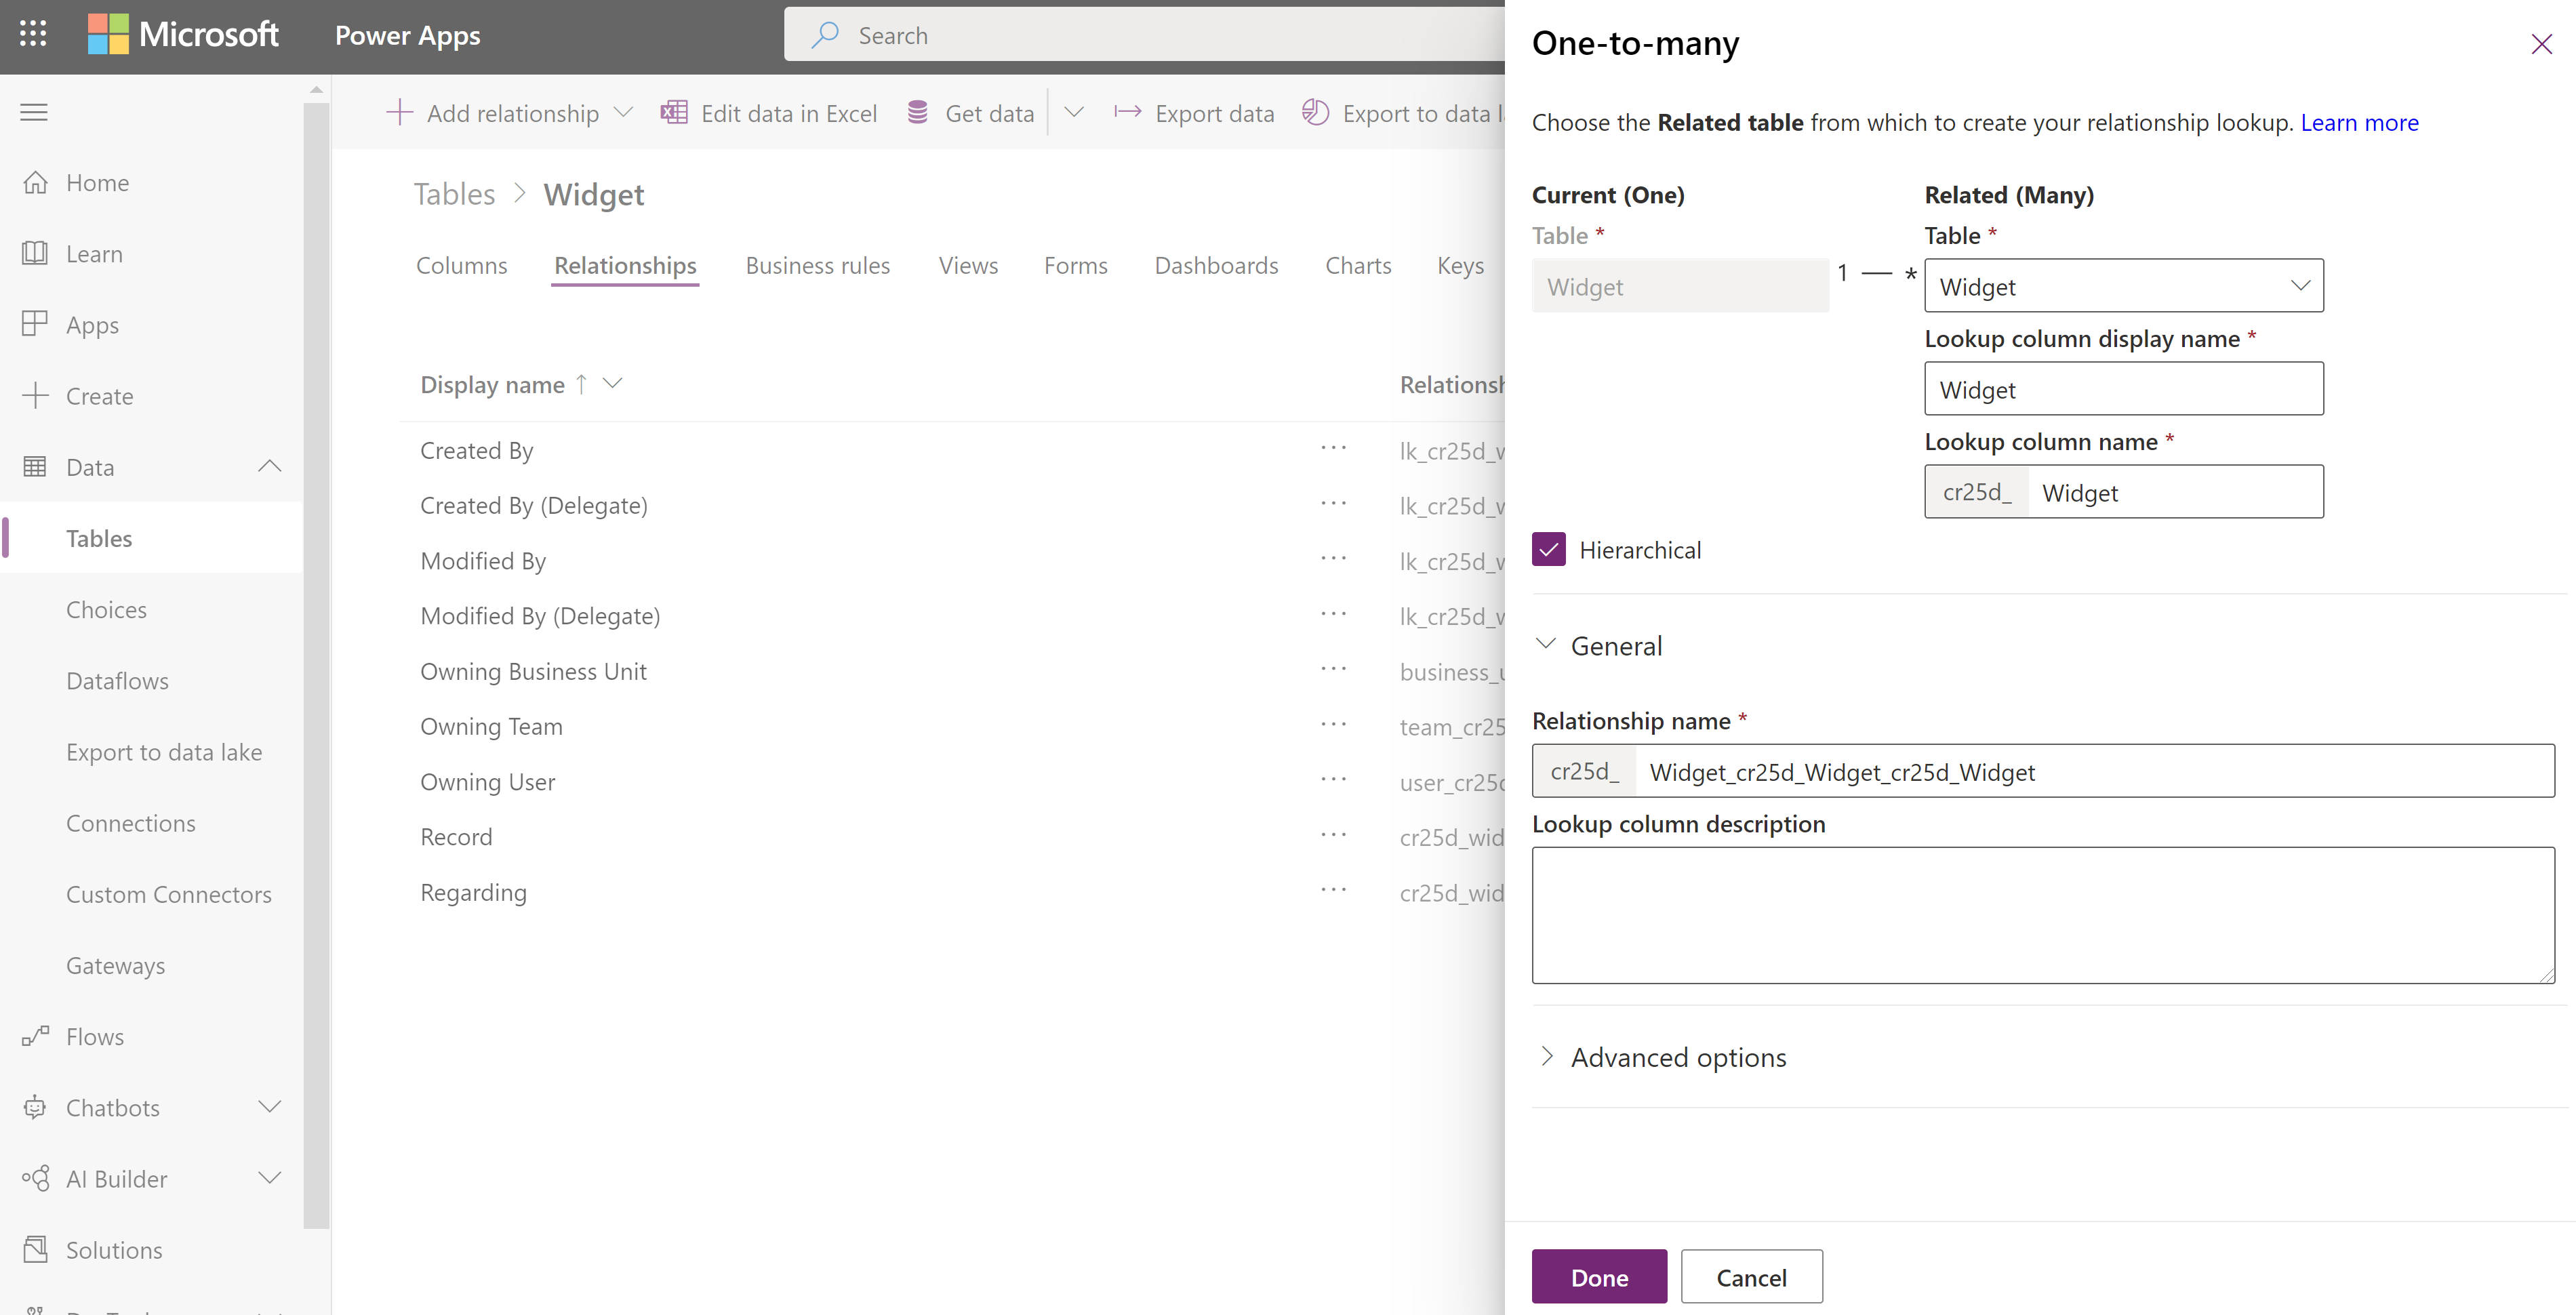
Next, in the Hierarchy Settings grid view, we selected the new_new_widget_new_widget hierarchical relationship. In the form, we filled in the required columns. If you haven’t yet marked the (1:N) relationship as hierarchical, the link on the form will take you back to the relationship definition form, where you can mark the relationship as hierarchical.
Important
Each table can have only one hierarchical relationship at a time. Changing this to a different self-referential relationship can have consequences. More information: Define hierarchical data
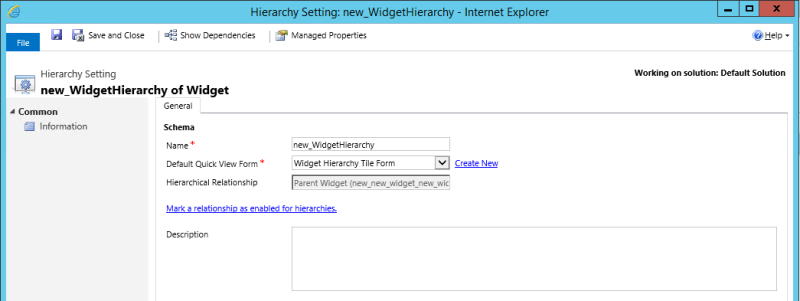
For the Quick View Form, we created a Quick Form called Widget Hierarchy Tile Form. In this form that will be used in a legacy web client app, we added four columns to display in each tile. More information: Important things to remember

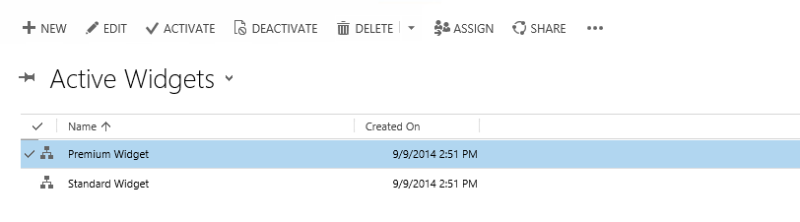
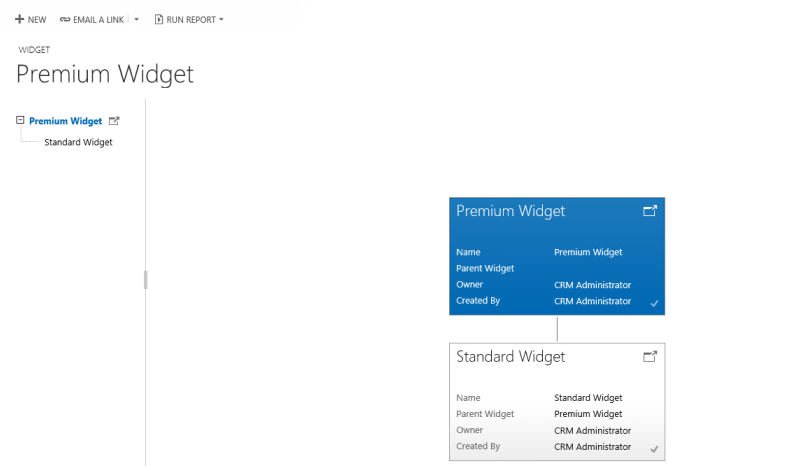
After we completed the setup, we created two rows: Standard Widget and Premium Widget. After making the Premium Widget a parent of the Standard Widget by using the lookup column, the new_Widget grid view depicted the hierarchy icons, as shown below:
Note
The hierarchy icons don’t appear in the row grid view until the rows are related using the hierarchical relationship.
Choosing the hierarchy icon displays the new_Widget hierarchy with the tree view on the left and the tile view on the right, showing two rows. Each tile contains four columns that we provided in the Widget Hierarchy Tile Form.
Based on your needs, you can choose between using a tree view, which shows the entire hierarchy, or a tile view, which depicts a smaller portion of the hierarchy. Both views are shown side by side. You can explore a hierarchy by expanding and contracting a hierarchy tree.
See also
Feedback
Coming soon: Throughout 2024 we will be phasing out GitHub Issues as the feedback mechanism for content and replacing it with a new feedback system. For more information see: https://aka.ms/ContentUserFeedback.
Submit and view feedback for