Debugging canvas apps with Monitor
Monitor is available by default for all canvas apps. Using Monitor, you can trace events as they occur in a canvas app during the authoring experience in Power Apps Studio, or you can use Monitor to debug the published version of a canvas app. More information: Monitor overview
Get started with Monitor in canvas apps
To open Monitor when authoring an app
Sign in to Power Apps.
Create a new app, or edit an existing app.
On the left pane, select Advanced tools.
Select Open monitor.
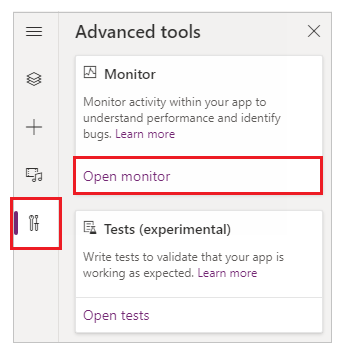
This action opens Monitor in a new browser tab and connects it to your existing Power Apps Studio session.
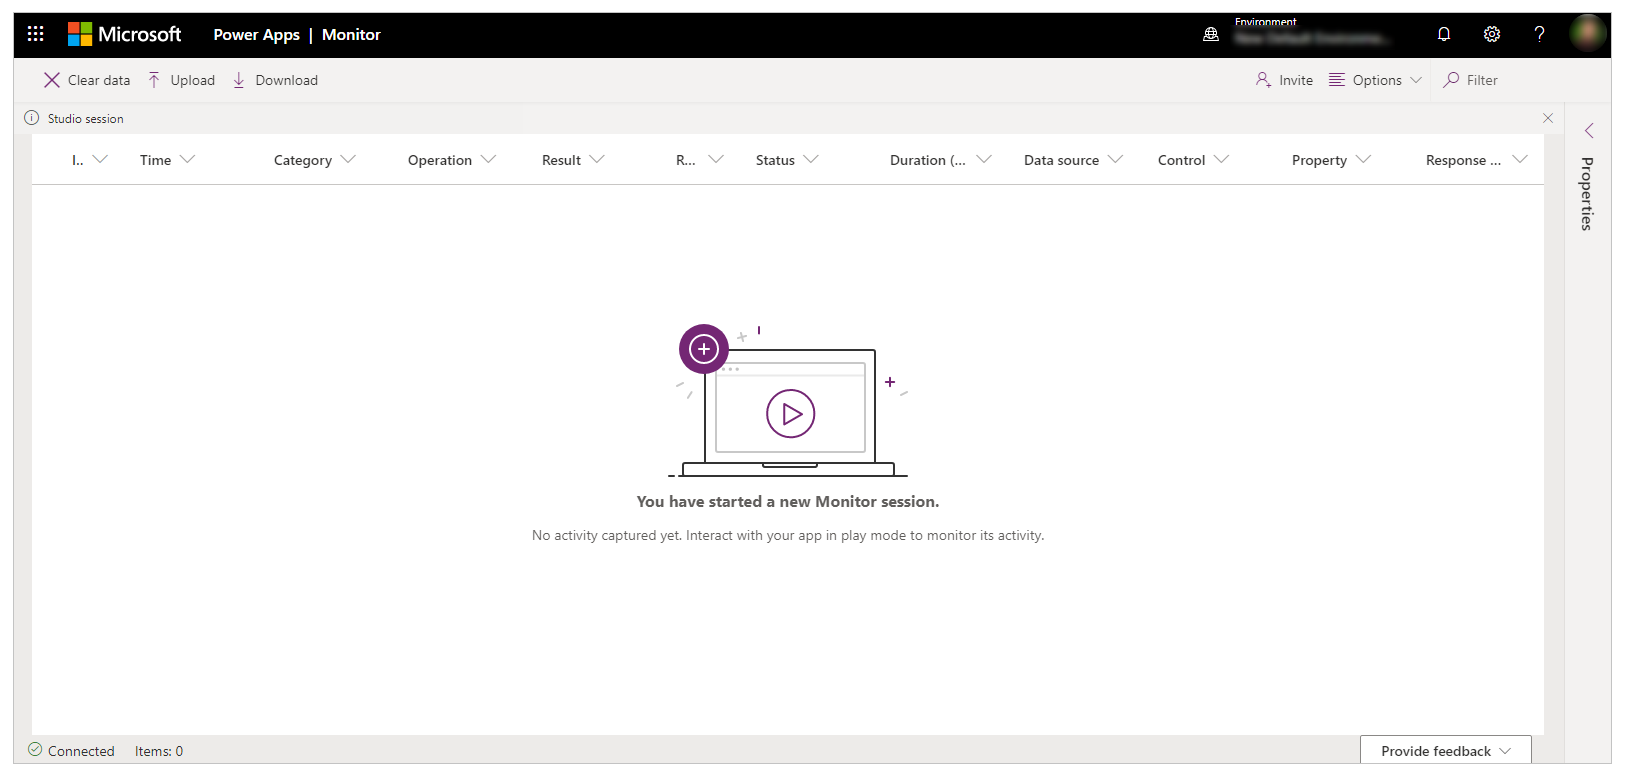
A notification appears at the top to show the current monitoring session as a Studio session.
Tip
Monitor has no impact on your app. You can use Monitor with any app in a test environment or in production.
Open Monitor for a published app
You can also use Monitor to debug the published app in the web player.
To open Monitor for a published app
Sign in to Power Apps.
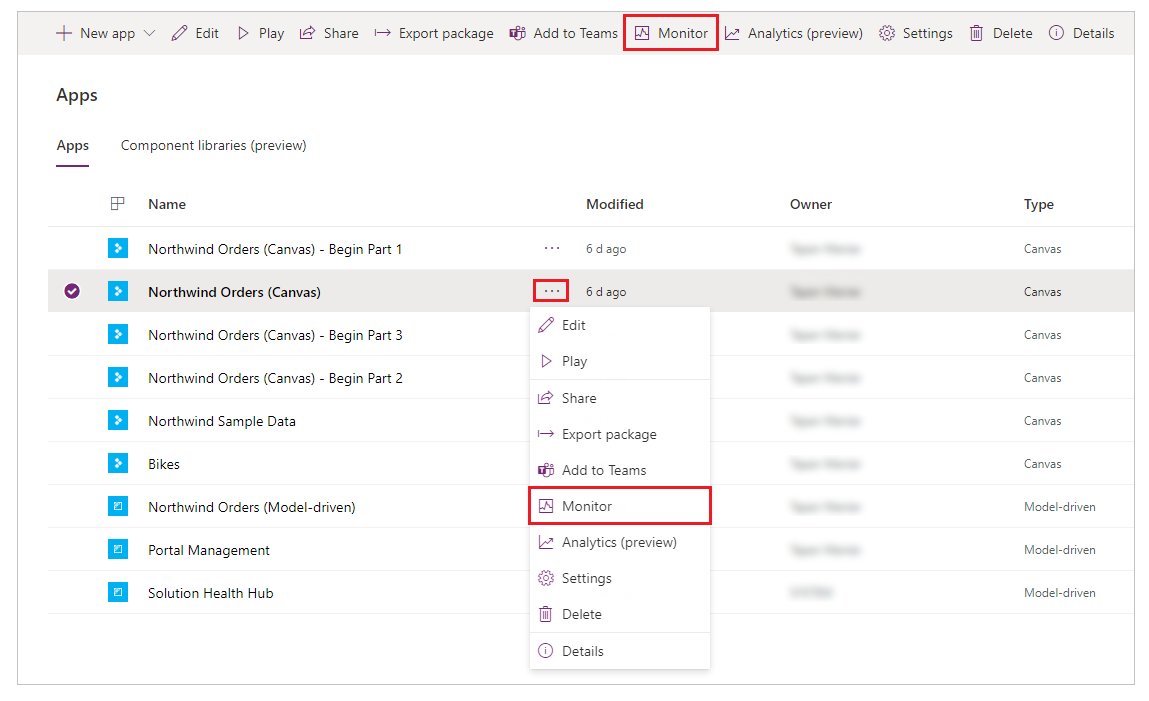
On the left pane, select Apps.
Select an app from the list.
Select Monitor from the menu. Or, you can select More Commands (...), and then select Monitor.
Select Play published app.
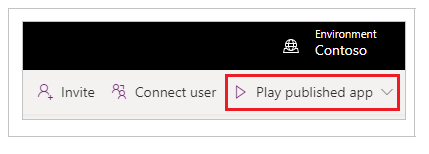
This action opens the published app in a new browser tab and connects it to your current Monitor session. You'll immediately see events in Monitor when the app is loaded in the web player, and as you interact with the published app.
Monitor also displays a notification that the monitoring session that's currently open is for the published version of the app.

For apps running on Power Apps mobile (preview)
Follow the above steps, but select Copy monitor link instead of Play published app. Use the copied link on your device to open a monitored session for the published app. Make sure the link is opened using Power Apps mobile, not a browser.
Note
Copy monitor link is available in https://make.preview.powerapps.com

Setting: Debug published app
If you want to view the source expressions in Monitor for the published app, you need to turn on the setting to publish the expressions with the app. This setting is similar to generating a debug file in traditional development. Publishing source expressions with your app is optional. Even when this setting is off, you'll be able to see the events happening in your app, but you won't be able to map these events to specific expressions or formulas.
To enable this setting, go to File > Settings, and then turn on Debug published app.
Note
Enabling this setting has a detrimental impact on the performance of your app for all your users. To minimize the impact, disable this setting as soon as you no longer need to view source expressions when debugging your published app.

View events in Monitor
To view events from your app, play the app in Power Apps Studio. Monitor will then display the table of events as they're occurring, along with specific details.
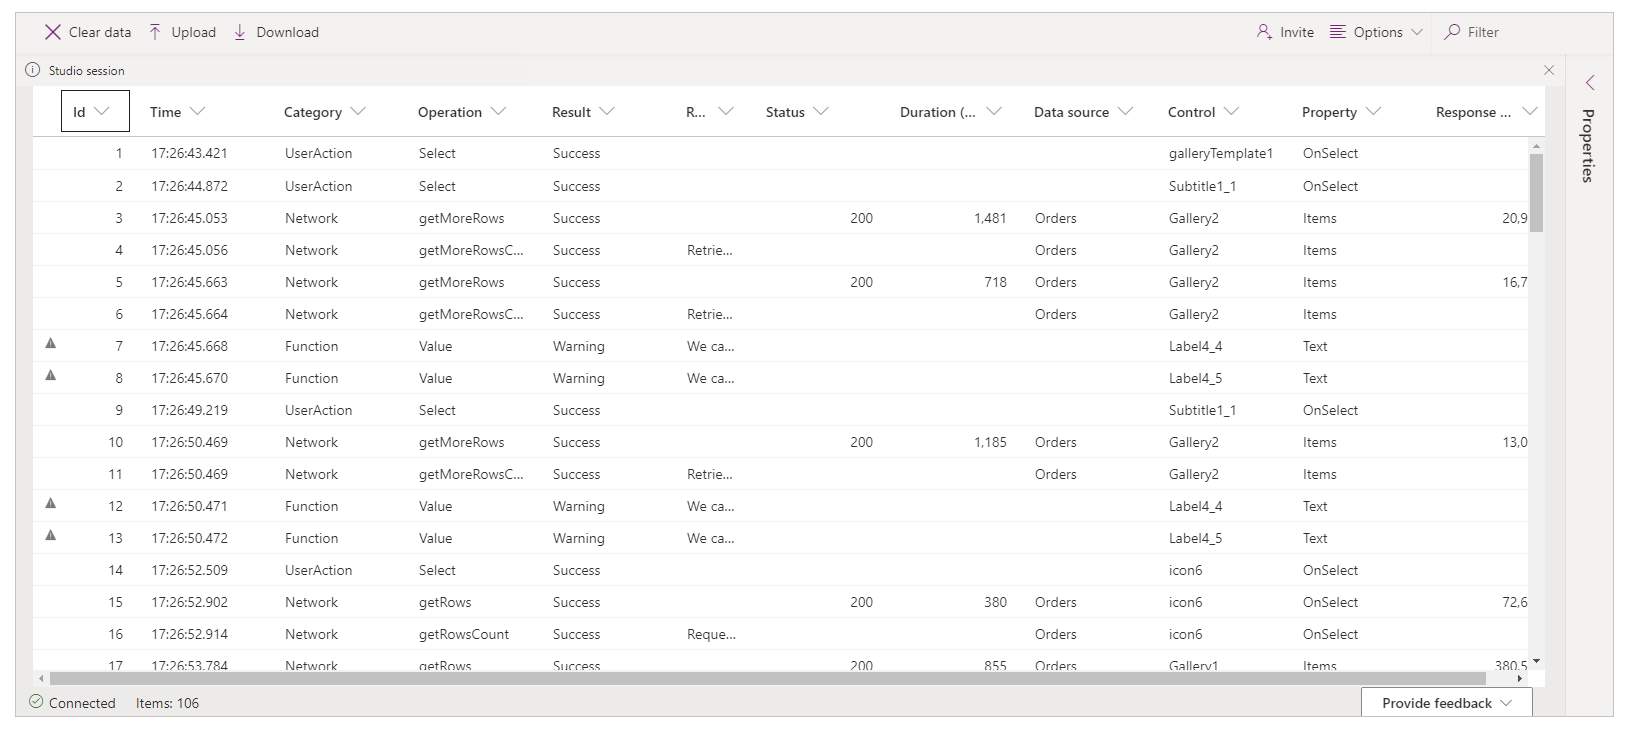
Example: Using Monitor with canvas apps
In this example, you'll use the Northwind Sample Data app included with the Northwind sample solution.
The Northwind sample solution is a canvas app that loads sample data into Microsoft Dataverse. You can also create a new app or use an existing app instead.
Background
Consider the scenario where an app has been deployed, and the initial version of the app experiences performance degradation. The app also intermittently generates errors with no clear pattern. Loading data in the app succeeds most of the time, but fails sometimes.
When you check Monitor, you see data operations as expected. However, you also see several responses that have HTTP status code 429, indicating that there have been too many requests in a specific timeframe.
When you select such an event, you see the error as "Rate limit exceeded. Try again in XX seconds."

Analysis
The problem needs further analysis to understand why requests are getting throttled. In Monitor, you see that for each createRow call, there are several getRows requests from the ProgressCount.Text property, each to a different entity. These entities aren't the entities the app is creating rows for. The ProgressCount.Text formula is seen in Monitor, as shown in the following image.
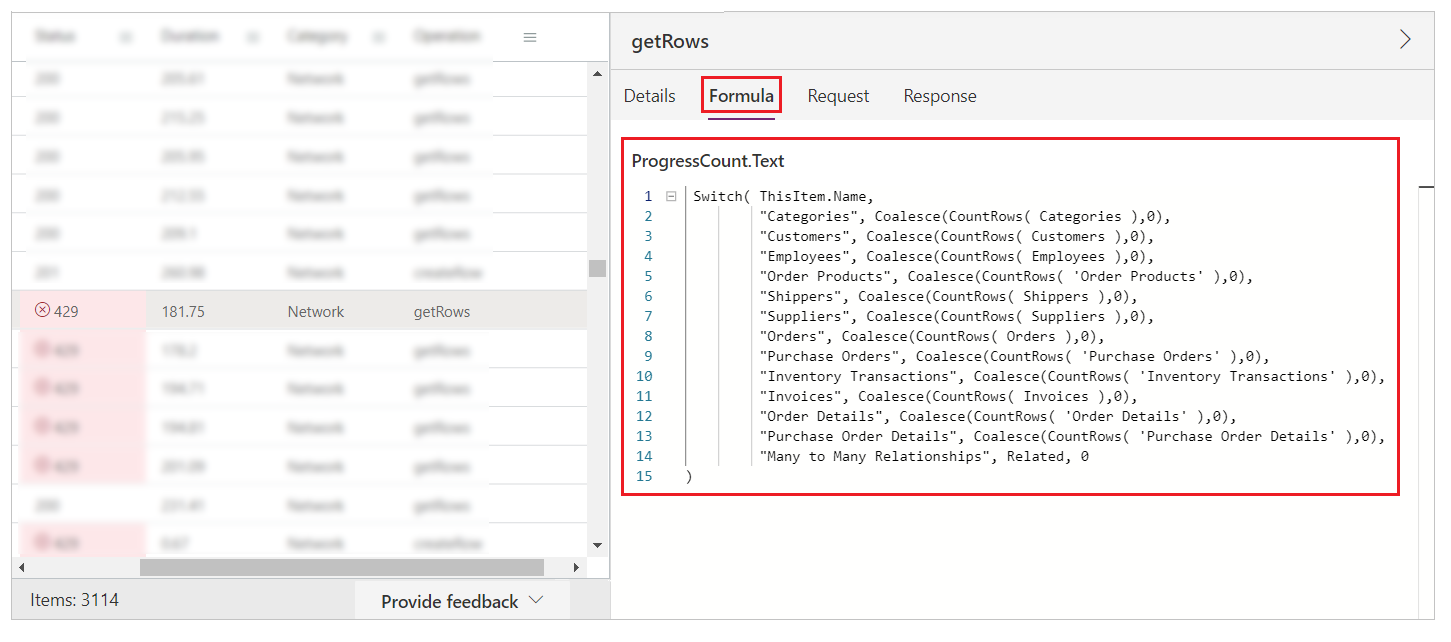
For each record added, the formula is evaluated again and CountRows is called on several entities. This behavior results in getRows in the log, because CountRows isn't delegated for Dataverse. For each single request to add a record, you're potentially making 12 additional requests to count the rows in each entity.
These extra requests intermittently cause errors because the Dataverse platform is throttling the requests to the service. This also explains the overall performance problem.
Next steps
Collaborative debugging with Monitor
See also
Advanced monitoring
Debugging model-driven apps with Monitor
Feedback
Coming soon: Throughout 2024 we will be phasing out GitHub Issues as the feedback mechanism for content and replacing it with a new feedback system. For more information see: https://aka.ms/ContentUserFeedback.
Submit and view feedback for