Create a report on a SharePoint List in Power BI Desktop
Many teams and organizations use lists in SharePoint Online to store data because it's easy to set up and easy for users to update. Sometimes a chart is a much easier way for users to quickly understand the data rather than looking at the list itself. In this tutorial, you learn how to transform your SharePoint list data into a Power BI report.
Watch this five-minute tutorial video, or scroll down for step-by-step instructions.
Note
This video might use earlier versions of Power BI Desktop or the Power BI service.
In the Power BI service, you can also create a report quickly from data in a SharePoint list.
If your purpose is to quickly create a semantic model in the Power BI service, you can do so directly from the SharePoint list. For more information, see Create a semantic model from a SharePoint list.
Part 1: Connect to your SharePoint List
If you don't have it already, download and install Power BI Desktop.
Open Power BI Desktop and in the Home tab of the ribbon, select Get data > More.
Select Online Services, and then select SharePoint Online List.
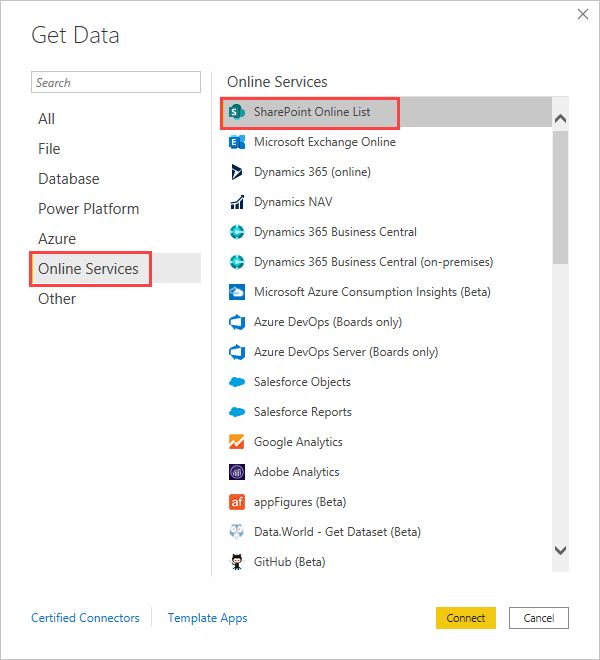
Select Connect.
Find the address (also known as a URL) of your SharePoint Online site that contains your list. From a page in SharePoint Online, you can usually get the site address by selecting Home in the navigation pane, or the icon for the site at the top, then copying the address from your web browser's address bar.
Watch a video of this step:
Note
This video might use earlier versions of Power BI Desktop or the Power BI service.
In Power BI Desktop, paste the address into the Site URL field of the SharePoint Online Lists dialog box, and then select OK.
You might or might not see a SharePoint access screen like the following image. If you don't see it, skip to step 10. If you do see it, select Microsoft Account on the left side of the page.
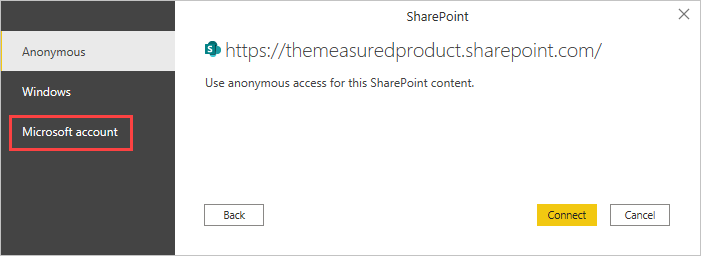
Select Sign In, and enter the user name and password you use to sign in to Microsoft 365.

When you finish signing in, select Connect.
On the left side of the Navigator dialog box, select the checkbox beside the SharePoint list you want to connect to.

Select Load. Power BI loads your list data into a new report.
Part 2: Create a report
On the left side of the Power BI Desktop screen, select the Data icon to see that your SharePoint list data was loaded.
Make sure your list columns with numbers show the Sum, or Sigma, icon in the Data pane on the right. For any that don't, select the column header in the table view, select the Structure group in the Column tools tab, then change the Data type to Decimal Number or Whole Number, depending on the data. If prompted to confirm your change, select Yes. If your number is a special format, like currency, you can also choose that by setting the Format in the Formatting group.
Watch a video of this step:
Note
This video might use earlier versions of Power BI Desktop or the Power BI service.
On the left side of the Power BI Desktop screen, select the Report icon.
Select columns you want to visualize by selecting the checkboxes beside them in the Fields pane on the right.
Watch a video of this step:
Note
This video might use earlier versions of Power BI Desktop or the Power BI service.
Change the visual type if you need to.
You can create multiple visualizations in the same report by deselecting the existing visual, then selecting checkboxes for other columns in the Fields pane.
Select Save to save your report.
Related content
Feedback
Coming soon: Throughout 2024 we will be phasing out GitHub Issues as the feedback mechanism for content and replacing it with a new feedback system. For more information see: https://aka.ms/ContentUserFeedback.
Submit and view feedback for