Semantic model details
The semantic model details page helps you explore, monitor, and leverage semantic models. When you select a semantic model in the data hub, a workspace, or other place in Power BI, the details page for that semantic model opens.

The semantic model details page:
- Shows you metadata about the semantic model, including description, endorsement, and sensitivity.
- Provides actions that you can perform on the semantic model, such as share, refresh, create new, Analyze in Excel, and more.
- Lists the reports and scorecards that are built on top of the semantic model.
The page header displays the semantic model name, endorsement (if any), and semantic model owner. To send an email to the semantic model owner or the semantic model certifier (if any), select the header and then select the name of the owner.
Supported actions
The semantic model details page enables you to perform a number of actions. The actions available vary from user to user depending on their permissions on the data item, and thus not all actions are available for all users.
| Action | Description | On Action bar, choose: |
|---|---|---|
| Download this file | Downloads the .pbix file for this semantic model. | File > Download this file |
| Manage permissions | Opens the manage semantic model permissions page. | File > Manage permissions |
| Settings | Opens the semantic model settings page. | File > Settings |
| Refresh now | Launches a refresh of the semantic model. | Refresh > Refresh now |
| Schedule refresh | Opens the semantic model settings page where you can set scheduled refresh. | Refresh > Schedule refresh |
| Share | Opens the Share semantic model dialog. | Share, or use the Share this data tile. |
| Create a report from scratch | Opens the report editing canvas where you can create a new report based on the semantic model. | Create a report > From scratch, or use the Visualize this data tile. |
| Create a report from template | Creates a copy of the template in My Workspace. This action is only available if a related report template exists. | Create a report > From template, or use the Visualize this data tile. |
| Create a report as formatted table | Opens the formatted table editing canvas. | Create a report > As formatted table, or use the Visualize this data tile. |
| Analyze in Excel | Launches Analyze in Excel using this semantic model. | Analyze in Excel |
| Open lineage view | Opens the lineage view for the semantic model. | Lineage > Open lineage view |
| Impact analysis | Opens the impact analysis side pane for this semantic model. | Lineage > Impact analysis |
| Chat in Teams | Invite people to start chatting in Teams. People you invite will receive a Teams chat message from you with a link to this semantic model details page. If they have access to the semantic model, the link will open this semantic model details page in Teams. | Chat in Teams |
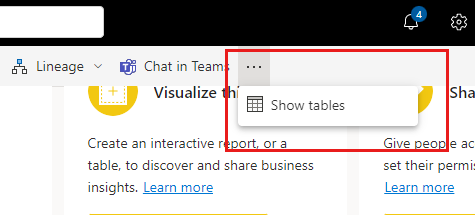
| Show tables | Opens a side panel showing the semantic model's tables. In the tables view you can create table previews by selecting desired columns. | Show tables |
View semantic model metadata
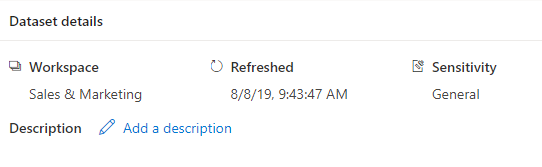
The semantic model details section shows:
- The name of the workspace where the item is located.
- The exact time of the last refresh.
- Endorsement status and certifier (if certified).
- Sensitivity (if set).
- Description (if any). You can create or edit the description from here.
Explore related reports
The explore related reports section shows you all the reports and scorecards that are built on the semantic model. You can create a copy of an item by selecting the line the item is on and selecting the Save a copy icon that appears. This section also shows you usage metrics for the related items.
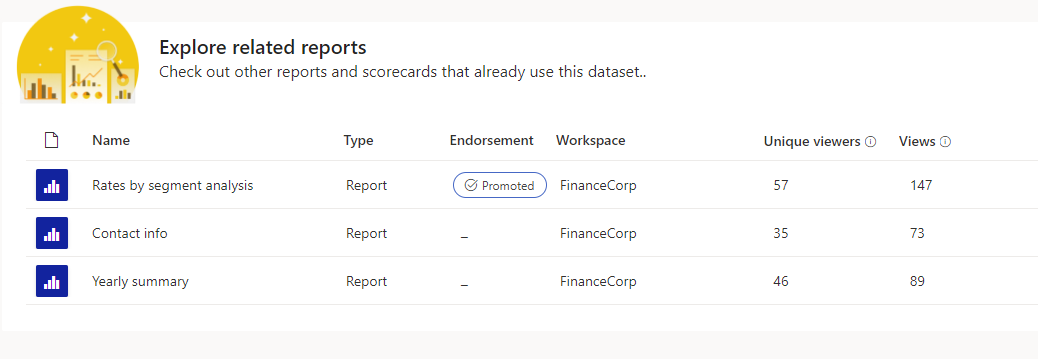
The columns in the list of related reports are:
- Name: Report name. If the name ends with (template), it means that this report has been specially constructed to be used as a template. For example, "Sales (template)".
- Type: Item type, for example, report or scorecard.
- Endorsement: Endorsement status.
- Workspace: The name of the workspace where the related item is located.
- Unique viewers: Shows the total number of unique users who viewed the item at least once in the last 30 days, excluding the current day's views.
- Views: Shows the total number of times an item was viewed in the last 30 days, excluding the current day's views.
Visualize this data
To create a report based on the semantic model, select the Create report button on this tile and choose the desired option.
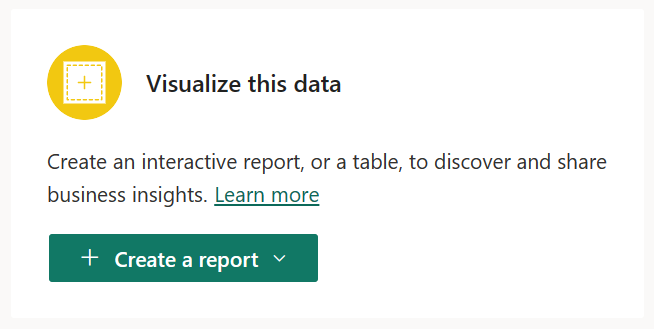
- Auto-create: Creates an auto-generated report from the semantic model.
- From template: Creates a copy of the template in My workspace.
- From scratch: Opens the report editing canvas to a new report built on the semantic model. When you save your new report, it will be saved in the workspace that contains the semantic model if you have write permissions on that workspace. If you don't have write permissions on the workspace, or if you are a free user and the semantic model resides in a Premium-capacity workspace, the new report will be saved in My workspace.
- As formatted table: Opens the formatted table editing canvas.
Note
Only one template will be shown in the Create report drop-down, even if more than one report template exists for this semantic model.
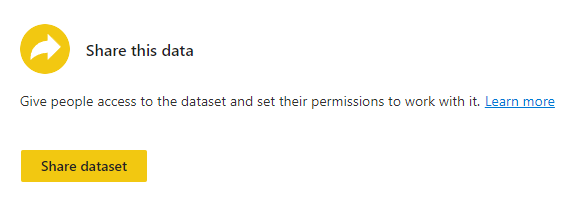
Share this data
You can share the semantic model with other users in your organization. Selecting the Share semantic model button opens the Share semantic model dialog, where you can choose which permissions to grant on the semantic model.
Data preview
Data preview enables you to view a selected table or columns from the semantic model. You can also export the data to supported file formats or create a paginated report.
Prerequisites
- The semantic model can be inside Premium or non-Premium workspaces. Classic workspaces aren't supported. Read about new and classic workspaces.
- You need Build permission for the semantic model.
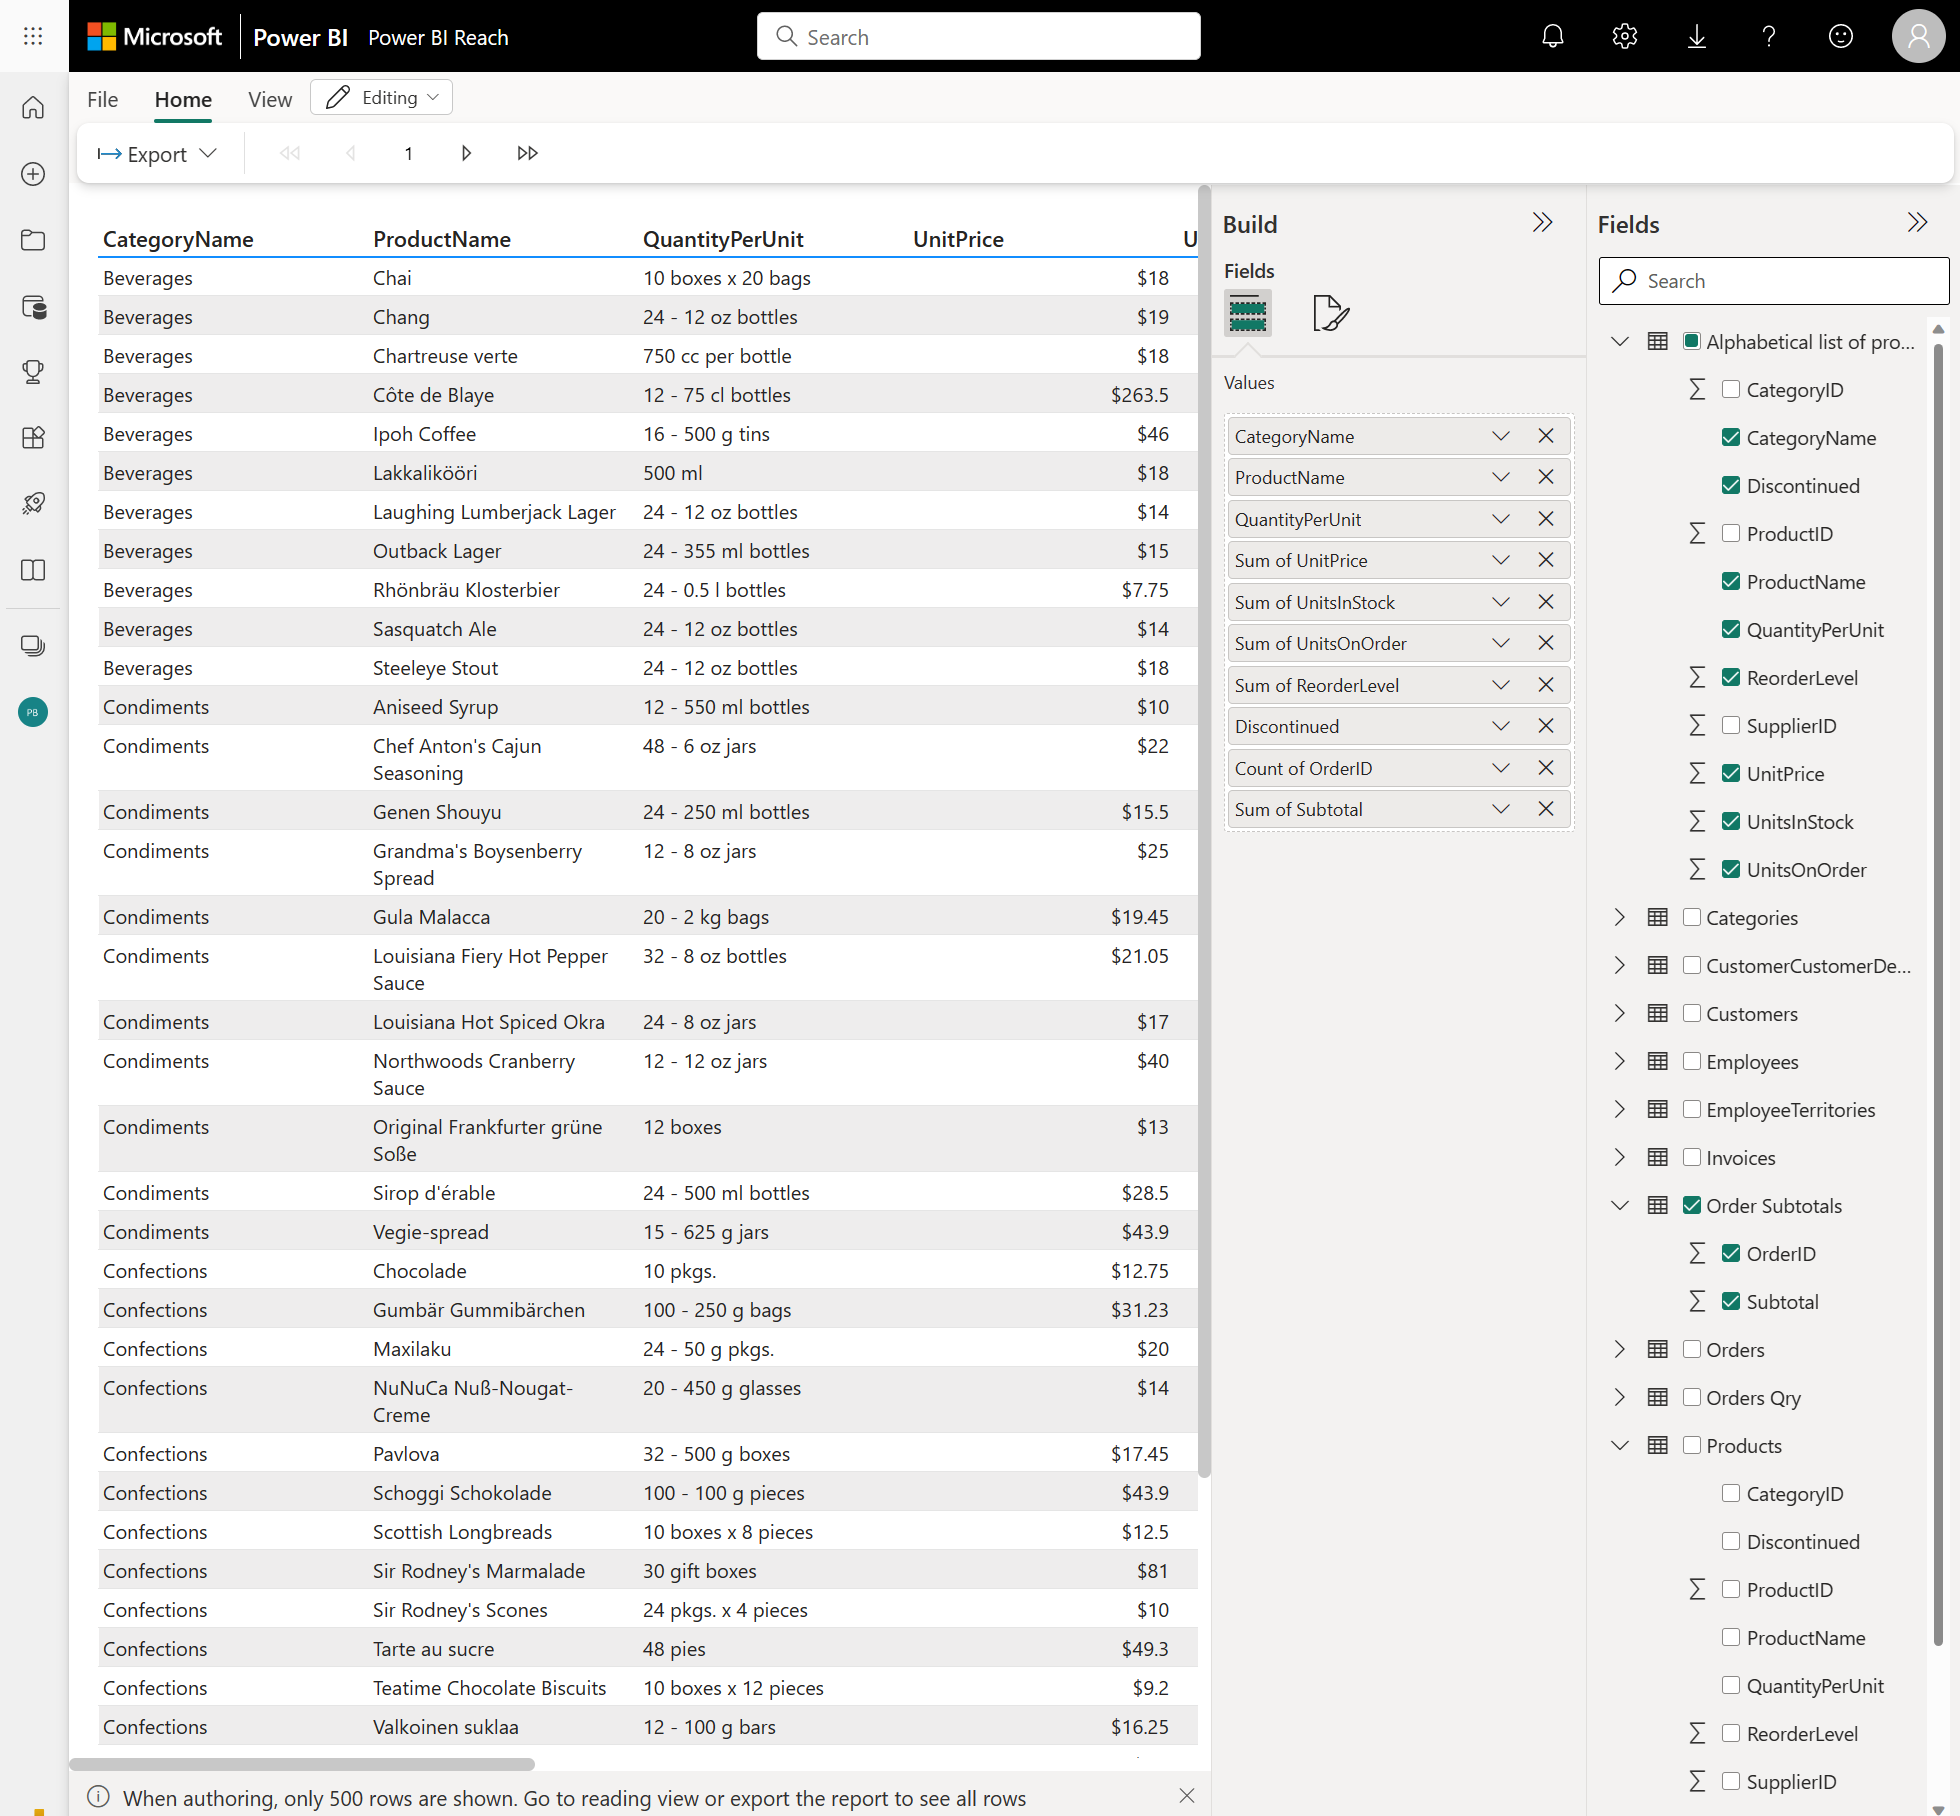
Select data to preview
To preview a semantic models's data from the semantic model details page, select a table or columns on the Tables side panel.
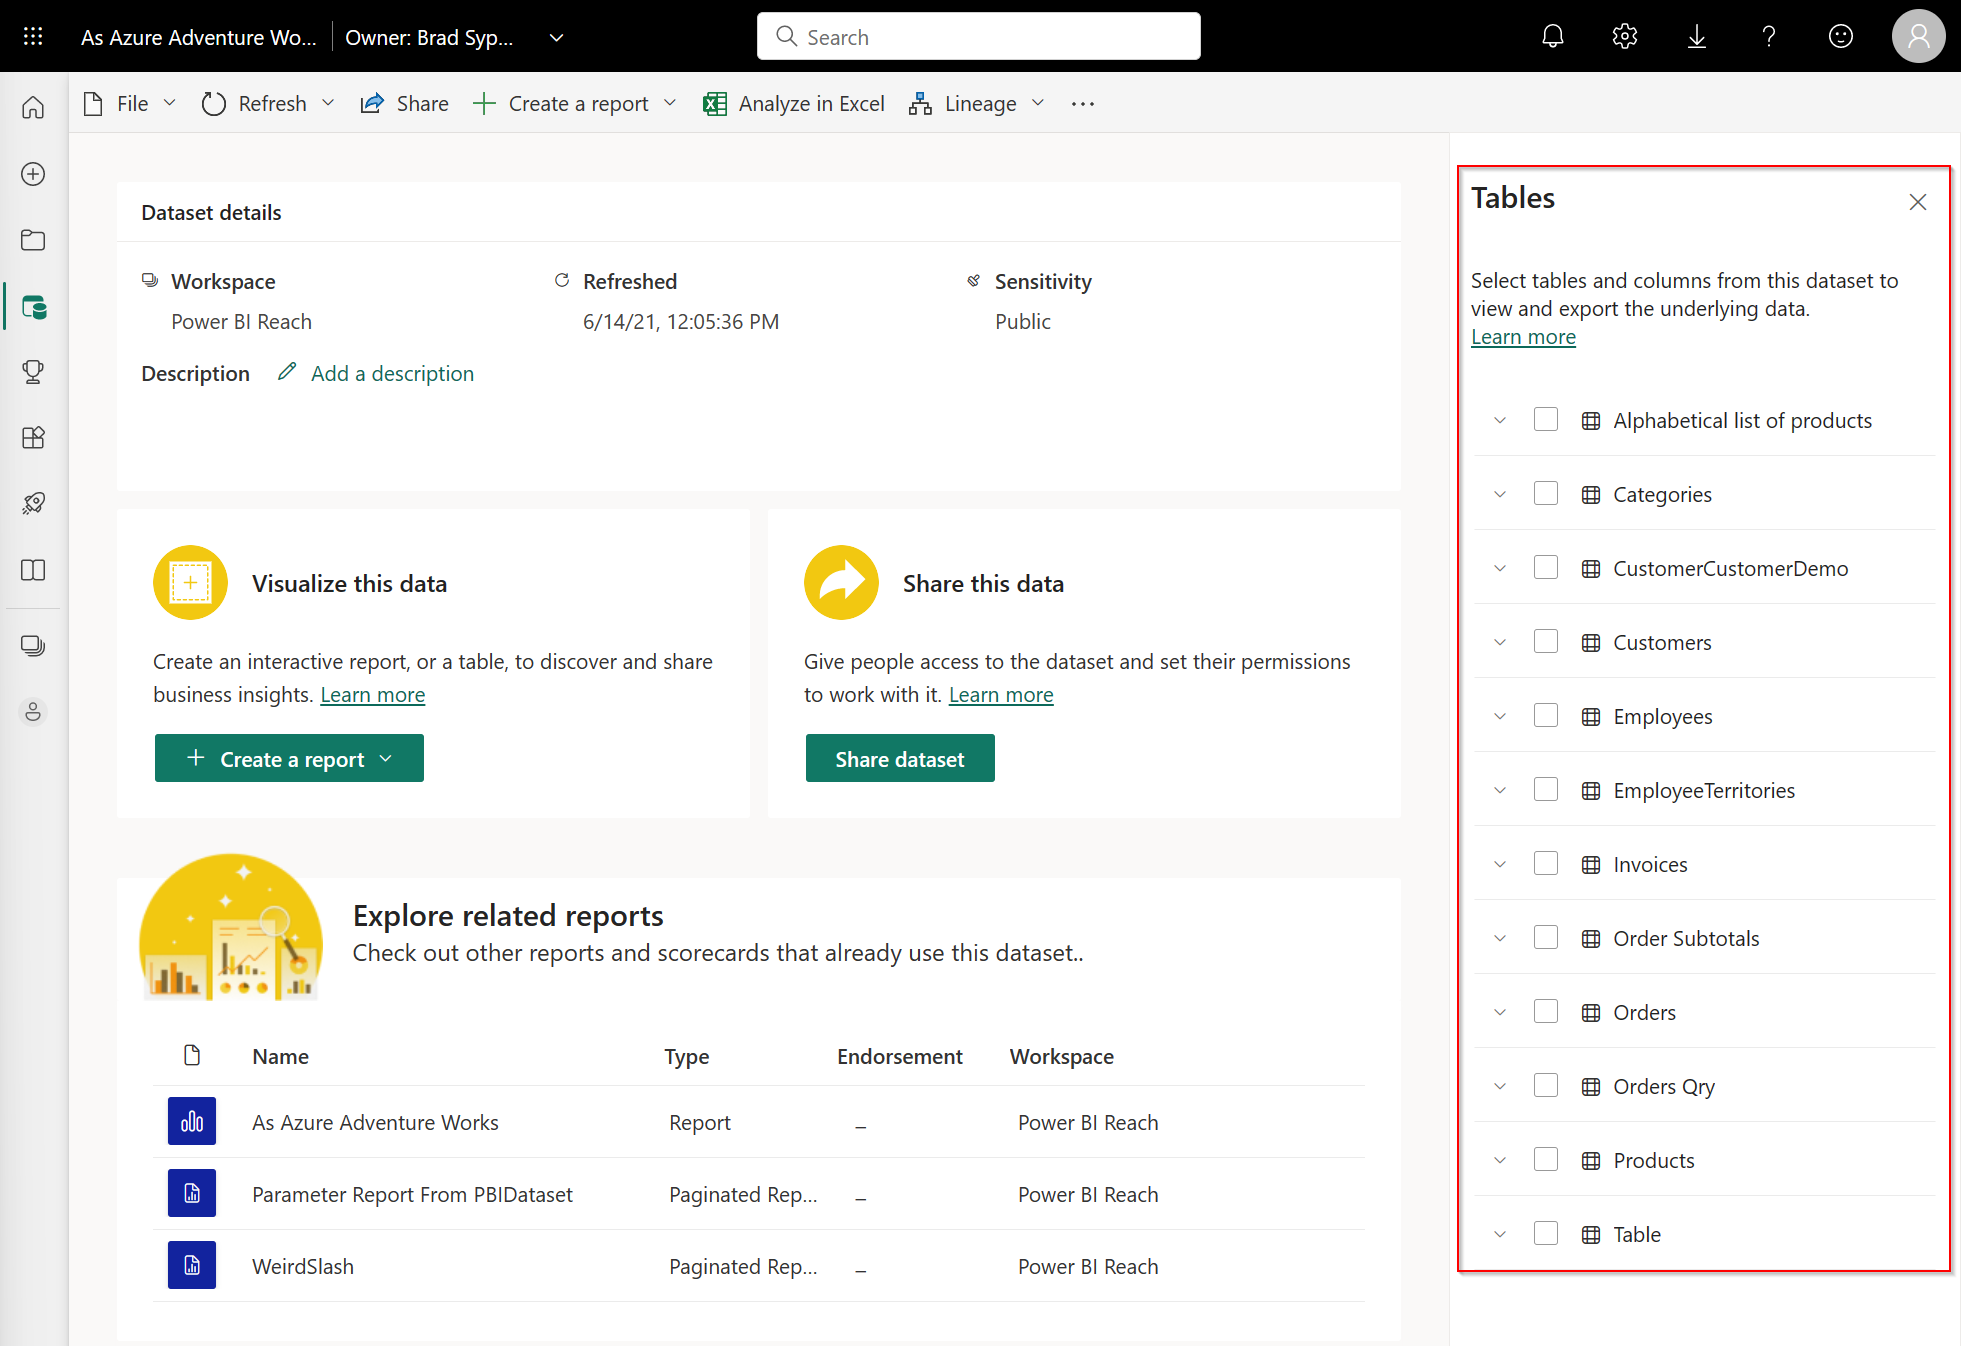
If you don't see the side panel, select Show tables on the action bar.
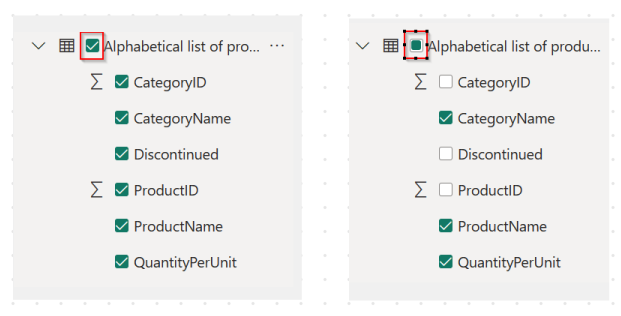
An entirely filled parent checkbox on the semantic model's table indicates that all its sub-tables and columns have been selected. A partially filled parent checkbox means that only a subset of them has been selected.
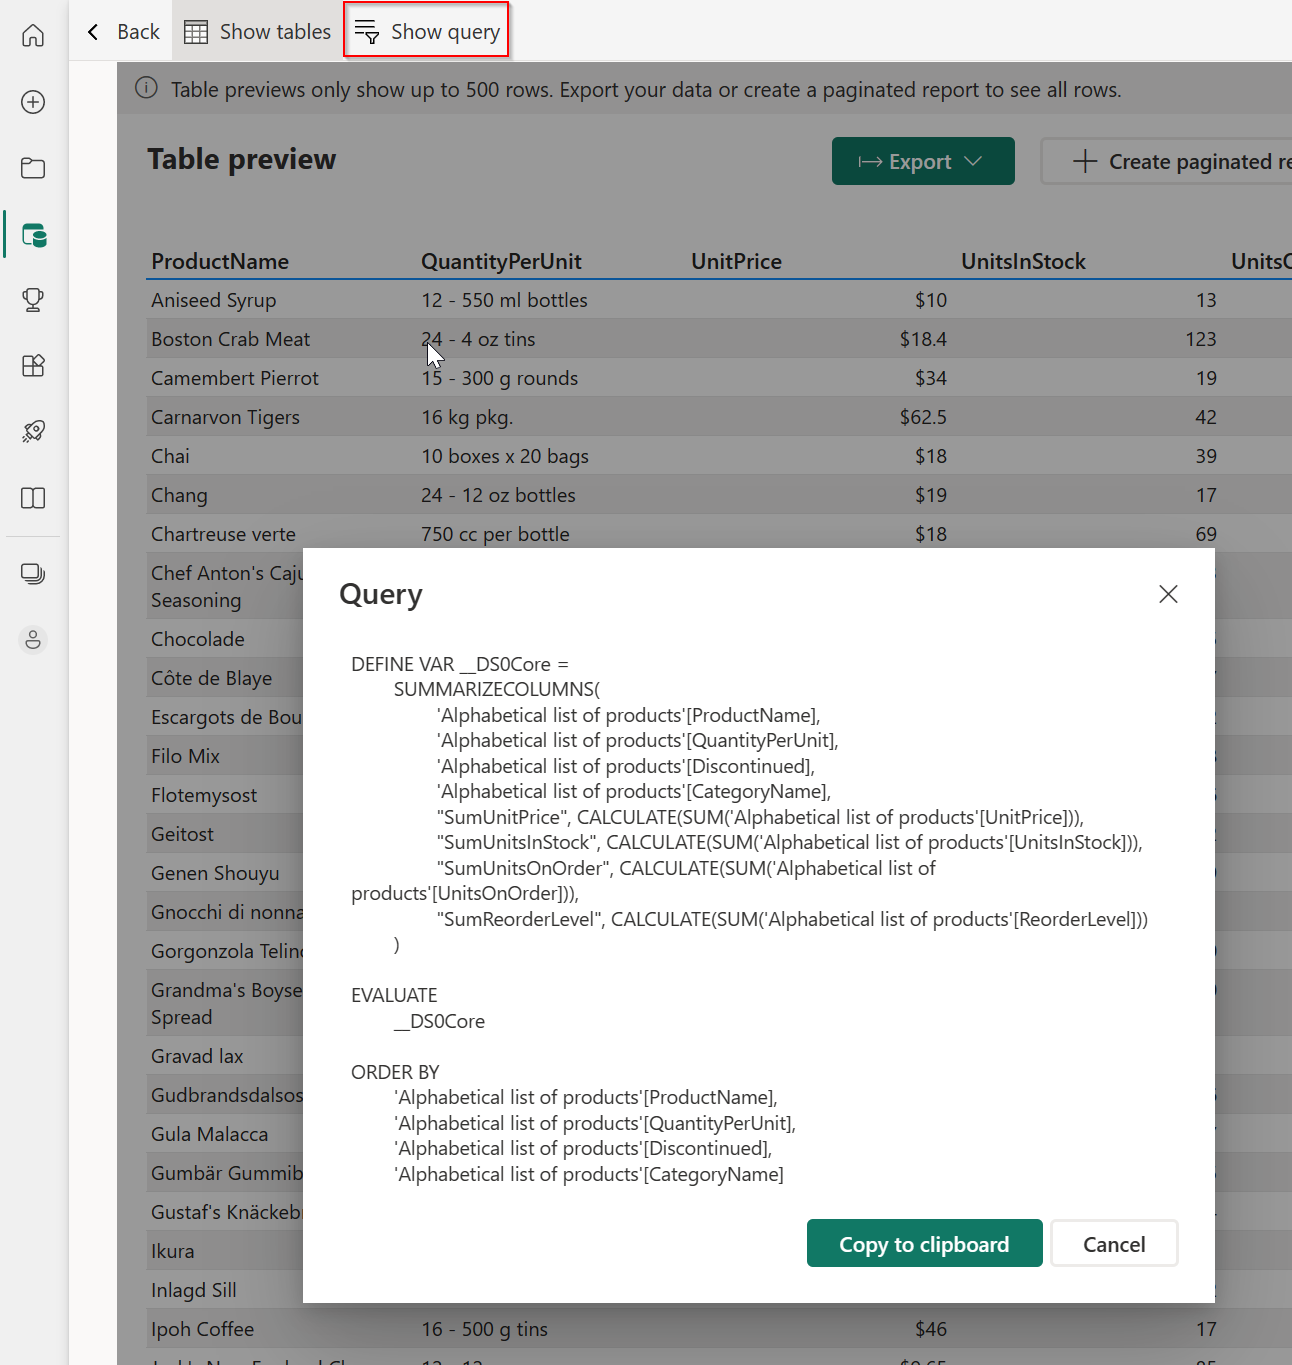
When you select a table or columns in a table, they will be displayed on the Table preview page that opens.

Table preview may not show all of the data you've selected. To see more, you can export or build a paginated report.
You can resize column widths using a drag handle next to the column headers. Resizing columns can make the table preview more readable, especially for long column input values.
Show query
Show query enables you to copy the DAX query used to create the table preview to the clipboard. This makes it possible to reuse the query for future actions.
Back
At any time you can return to the semantic model details page by selecting the Back button on the action bar. Selecting the Back button clears all your selections and brings you back to semantic model details page.
Note
Table preview is intended to quickly explore the underlying data of tables within your semantic model. You cannot view measures or select more than one table or columns across tables. You can select Create paginated report for that.
Export data
Select the Export button on the Table preview page to export the data to one of the supported file formats.
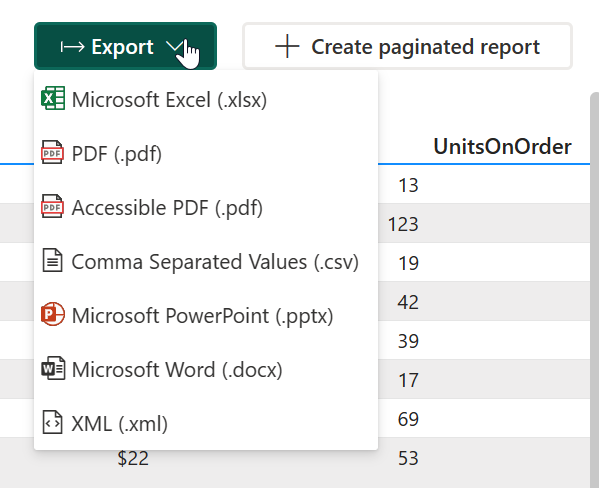
Build a paginated report
Select the Create paginated report button to open the editor.
Note
Data will change from underlying data to summarized data. You can switch to underlying data using More options.
In the editor you can select multiple tables, measure, fields across tables, apply table styles, change aggregates, and so on.
You can then export the report to any of the supported file formats, and the file will be saved to your default downloads folder. Or you can save it as a paginated report to a workspace of your choice. Paginated reports fully preserve your report formatting.
Switch from summarized to underlying data in the editor
Select More options (...) to switch from Summarized data to Underlying data.

Considerations and limitations
Streaming datasets do not have a details page.
Related content
Feedback
Coming soon: Throughout 2024 we will be phasing out GitHub Issues as the feedback mechanism for content and replacing it with a new feedback system. For more information see: https://aka.ms/ContentUserFeedback.
Submit and view feedback for