Create a Power BI dashboard from a report
APPLIES TO: ![]() Power BI Desktop
Power BI Desktop ![]() Power BI service
Power BI service
You've read Introduction to dashboards in Power BI, and now you want to create your own. There are many ways to create a dashboard. For example, you can create a dashboard from a report, from scratch, from a semantic model, or by duplicating an existing dashboard. In this article, you create a quick and easy dashboard that pins visualizations from an existing report.
After you complete this article, you'll understand:
- The relationship between dashboards and reports.
- How to pin tiles.
- How to navigate between a dashboard and a report.

Note
Dashboards are a feature of the Power BI service, not Power BI Desktop. You can't create dashboards in the Power BI mobile apps, but you can view and share them there.
Video: Create a dashboard by pinning visuals from a report
Watch Amanda create a new dashboard by pinning visualizations from a report. Then, follow the steps in the next section to try it out yourself by using the Procurement Analysis sample.
Note
This video might use earlier versions of Power BI Desktop or the Power BI service.
Pin tiles to a dashboard
Open a report and select More options (...) > Edit to open the report in Editing view.
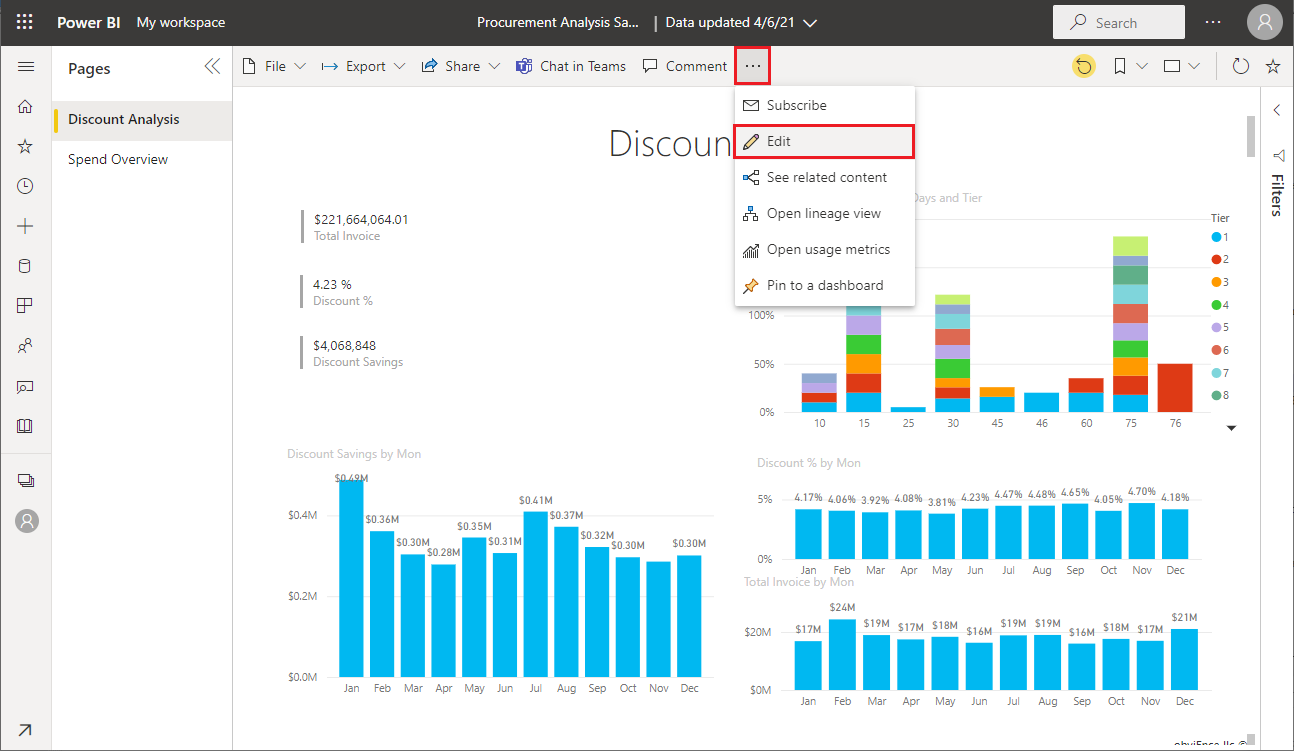
Tip
You don't have to open the report in Edit mode, but you do have to have edit permissions for the report.
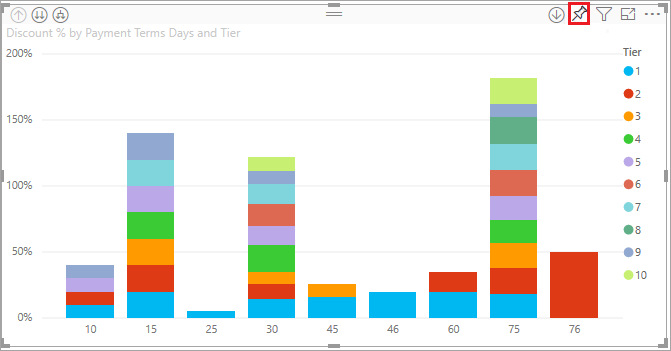
Hover over a visualization to reveal the options that are available. To add a visualization to a dashboard, select the pin icon
 .
.
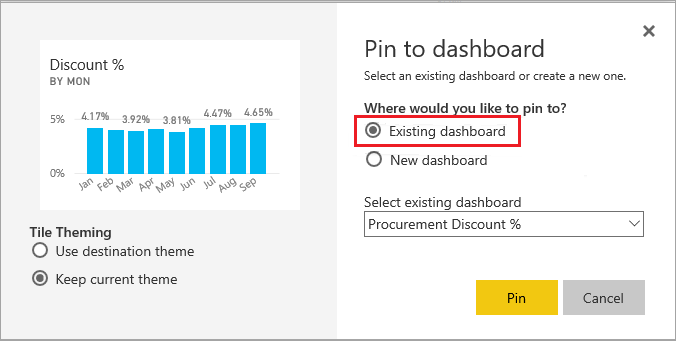
Select whether to pin to an existing dashboard or new dashboard.
- Existing dashboard: Select the name of the dashboard from the dropdown. Dashboards that have been shared with you won't appear in the dropdown.
- New dashboard: Enter the name of the new dashboard.
In this case, we select the option for New dashboard and enter a name.

In some cases, the item you're pinning might have a theme already applied. For example, visuals pinned from an Excel workbook. If so, select the theme to apply to the tile:
- Use destination theme: The theme of the dashboard.
- Keep current theme: The theme of the report.
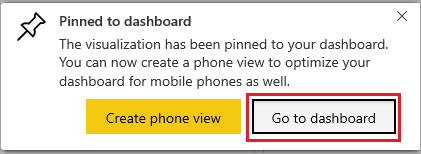
When you select Pin, Power BI creates the new dashboard in the current workspace. After the Pinned to dashboard message appears, select Go to dashboard. If you're prompted to save the report, select Save.
Power BI opens the new dashboard, which has one tile: the visualization you just pinned.
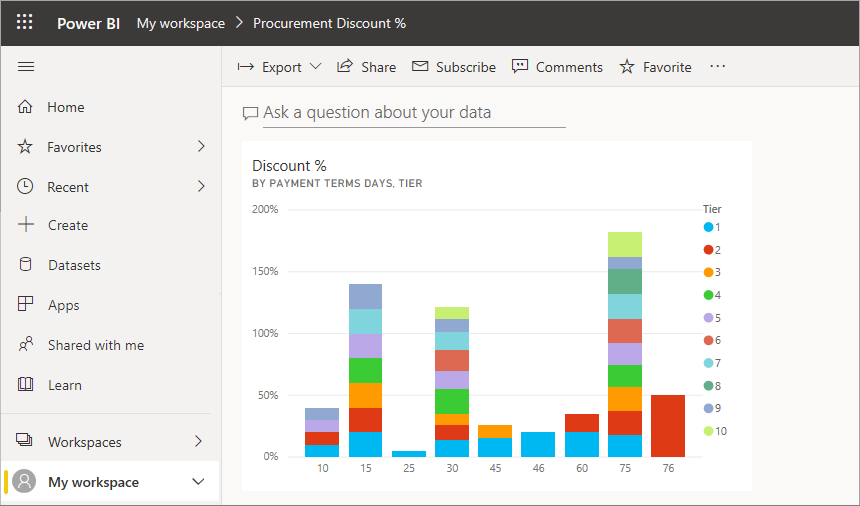
Select the tile to return to the report. Pin a few more tiles to the new dashboard. When the Pin to dashboard window appears, select Existing dashboard.
Pin an entire report page
Another option is to pin an entire report page to a dashboard, which is an easy way to pin more than one visualization at a time. When you pin an entire page, the tiles are live. That is, you can interact with them there on the dashboard. Changes you make to any of the visualizations in the report editor, like adding a filter or changing the fields used in the chart, are reflected in the dashboard tile as well.
For more information, see Pin an entire report page.
Considerations and limitations
Some report formatting options or themes aren't applied to visuals when you pin them to a dashboard.
- Border, shadow, and background settings are ignored in the pinned tile.
- For card visuals, the text used for the value is shown in dashboards using the 'DIN' font family, with black text. You can change the text color for all the tiles on a dashboard by creating a custom dashboard theme.
- Conditional formatting isn't applied.
- Button visuals that trigger bookmarks or clear or apply filters when you select them have no action in a dashboard tile. These actions only make sense within the context of a report.
- Visuals will adjust their size to fit the size of the tile. This can result in differences in layout as if the visual had been resized on the report.
- Because some visualizations use background images, pinning might not work if the background image is too large. Try reducing the image size or using image compression.
Related content
Congratulations on creating your first dashboard. Now that you have a dashboard, there's much more you can do with it. Start exploring on your own, or see one of the following articles:
- Resize and move tiles
- All about dashboard tiles
- Share your dashboard by creating an app
- Power BI - Basic Concepts
- Tips for designing a great dashboard
More questions? Try the Power BI Community.
Feedback
Coming soon: Throughout 2024 we will be phasing out GitHub Issues as the feedback mechanism for content and replacing it with a new feedback system. For more information see: https://aka.ms/ContentUserFeedback.
Submit and view feedback for