Set geographic filters in Power BI Desktop for use in the mobile app
In Power BI Desktop, you can categorize geographical data for a column, so Power BI Desktop knows how to treat values in visuals in a report. As an added benefit, when you or your colleagues view that report in the Power BI mobile apps, Power BI automatically provides geographical filters that match where you are.
For example, say you're a sales manager that travels to meet customers, and you want to quickly filter the total sales and revenue for the specific customer you're planning to visit. You want to break out the data for your current location, whether by state, city, or an actual address. Later, if you have time left, you'd like to visit other customers located nearby. You can filter the report by your location to find those customers.
Note
You can only filter by location in the mobile app if the geographic names in the report are in English; for example, "New York City" or "Germany".
Identify geographic data in your report
In Power BI Desktop, switch to the Data view
 .
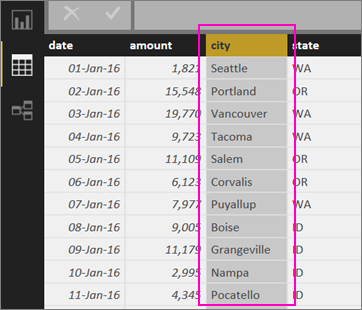
.Select a column with geographic data, for example, a City column.
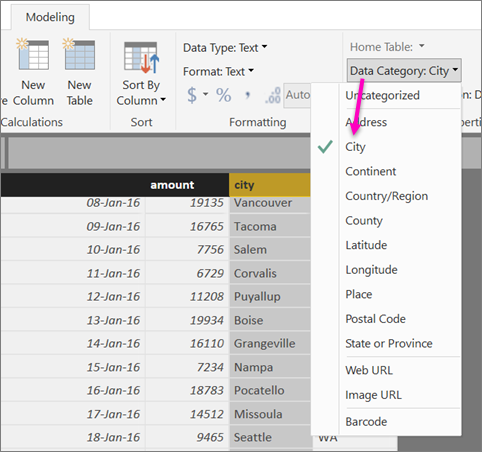
On the Column tools tab, select Data category, then the correct category, in this example, City.
Continue setting geographic data categories for any other fields in the model.
Note
You can set multiple columns for each data category in a model, but if you do, the model can't filter for geography in the Power BI mobile app. To use geographic filtering in the mobile apps, set only one column for each data category. For example, set only one City column, one State or Province column, and one Country or Region column.
Create visuals with your geographic data
Switch to the Report view,
 and create visuals that use the geographic fields in your data.
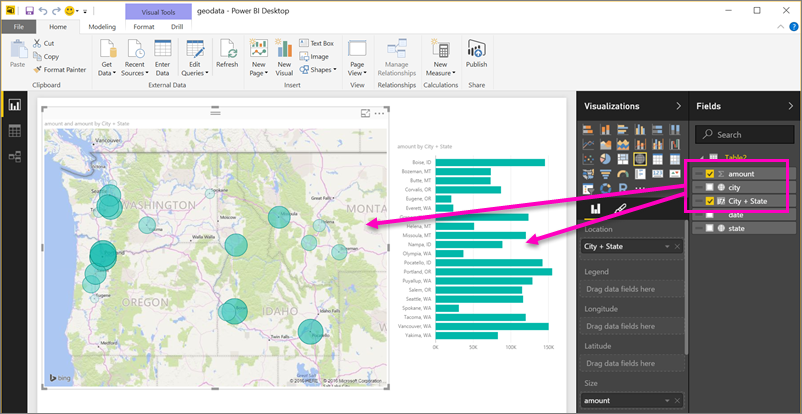
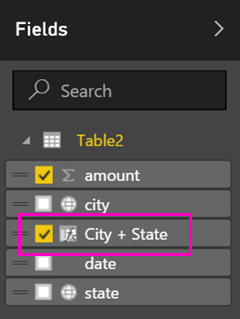
In this example, the model also contains a calculated column that brings city and state together into one column. To learn more, see creating calculated columns in Power BI Desktop.
Publish the report to the Power BI service.
View the report in Power BI mobile app
Open the report in any of the Power BI mobile apps.
If you're in a geographic location with data in the report, you can filter it automatically to your location.

To learn more, see filtering a report by location in the Power BI mobile apps.
Related content
Feedback
Coming soon: Throughout 2024 we will be phasing out GitHub Issues as the feedback mechanism for content and replacing it with a new feedback system. For more information see: https://aka.ms/ContentUserFeedback.
Submit and view feedback for