Best practices to optimize Q&A in Power BI
It's powerful to use common phrases and natural language to ask questions of your data. It's even more powerful when your data answers, which is what the Q&A feature in Power BI does.
To enable Q&A to successfully interpret the large collection of questions it's capable of responding to, Q&A makes assumptions about the model. If the structure of your model doesn't meet one or more of these assumptions, you need to adjust your model. Those adjustments for Q&A are the same best-practice optimizations for any model in Power BI, regardless of whether you use Q&A.
Use Q&A tooling to fix your questions
In the following sections, we describe how to adjust your model so it works well with Q&A in Power BI. With Q&A tooling, you teach your core business terms to Q&A and fix questions your end users ask. Sometimes, questions still can't be addressed because the data is shaped incorrectly or data is missing. In this case, read the following sections to help you optimize Q&A. For more information, see Intro to Q&A tooling.
Add missing relationships
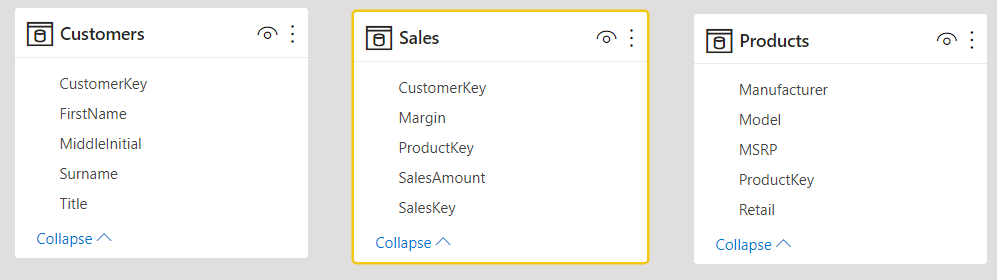
If your model is missing relationships between tables, Power BI reports and Q&A can't interpret how to join those tables. Relationships are the cornerstone of a good model. For example, you can't ask for the “total sales for Seattle customers” if the relationship between the orders table and the customers table is missing. The following images show a model that needs work and a model that's ready for Q&A.
Needs work
In the first image, there are no relationships between the Customers, Sales, and Products tables.
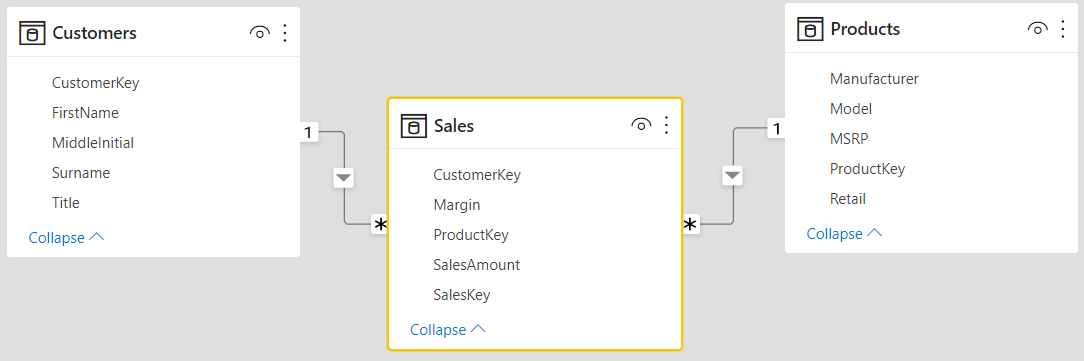
Ready for Q&A
In the second image, relationships are defined between the tables.
Rename tables and columns
The choice of tables and columns is important for Q&A. For example, say you have a table named CustomerSummary that contains a list of your customers. You would need to ask a question like “List the customer summaries in Chicago” rather than “List the customers in Chicago”.
While Q&A can do some basic word breaking and detecting plurals, Q&A assumes that your table and column names accurately reflect their content.
Another example could be if you have a table named Headcount that contains first and last names and employee numbers. You have another table named Employees that contains employee numbers, job numbers, and start dates. People familiar with the model might understand this structure. Someone else who asks “count the employees” is going to get a count of the rows from the “Employees” table. This result is probably not what they had in mind, because it’s a count of every job every employee has ever had. It would be better to rename those tables to truly reflect what they contain.
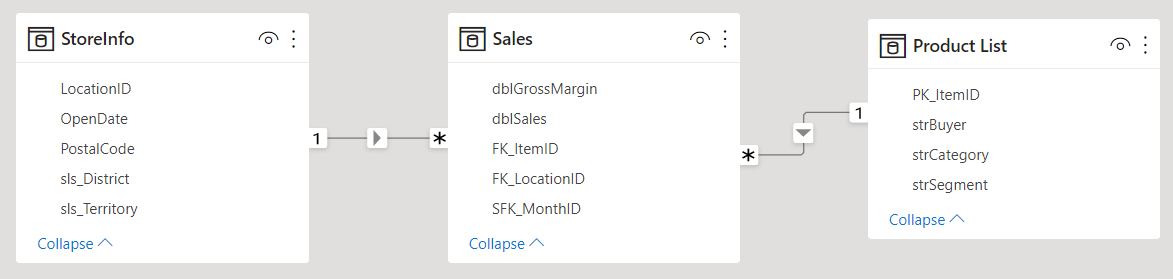
Needs work
Table names like StoreInfo and Product List need work.
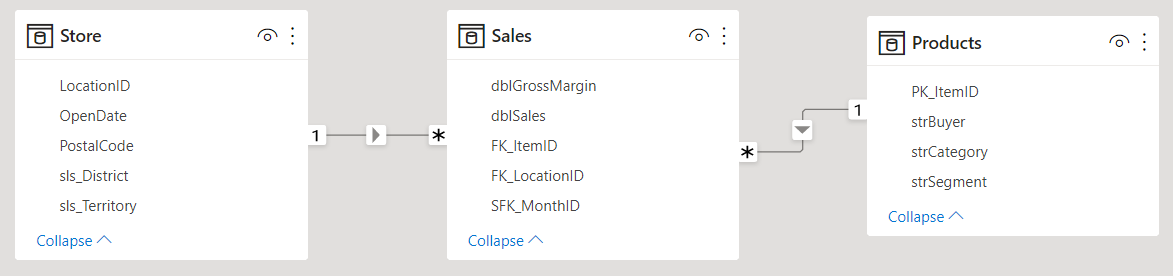
Ready for Q&A
Tables named Store and Products work better.
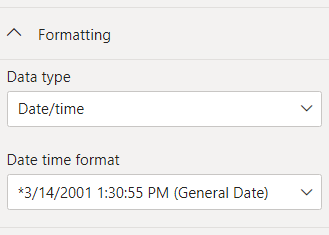
Fix incorrect data types
Imported data can have incorrect data types. In particular, date and number columns that are imported as strings aren't interpreted by Q&A as dates and numbers. Select the correct data type in your Power BI model.
Change the year and identifier column settings
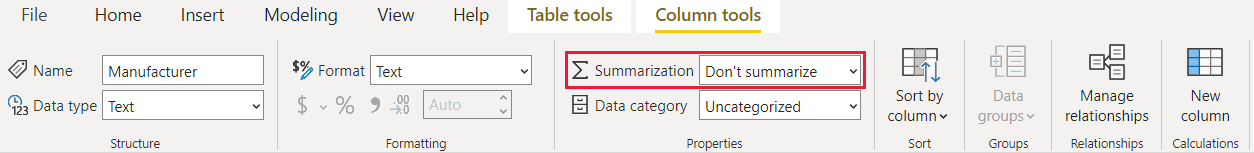
Power BI aggregates numeric columns by default, so questions like “total sales by year” can sometimes result in a grand total of sales alongside a grand total of years. If you have specific columns where you don't want Power BI to exhibit this behavior, set the default Summarization property on the column to Don’t summarize. Be mindful of Year, Month, Day, and ID columns, as those columns are the most frequent problems. Other columns that aren’t sensible to sum, such as Age, could also benefit from setting the default Summarization to Don't summarize or to Average. This setting is in the Properties section after you select a column.
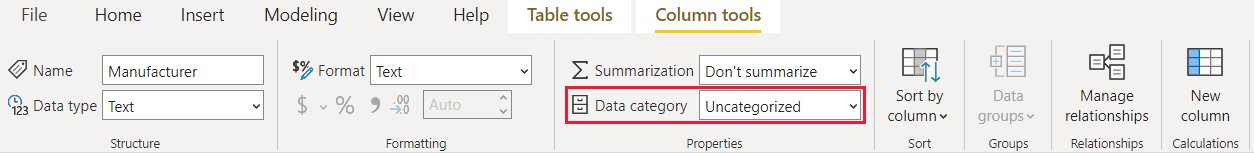
Choose a Data Category for each date and geography column
The Data Category provides knowledge about the content of a column beyond its data type. For example, you can mark an integer column as a Zip code or a string column as a City, Country/Region. Q&A uses this information in two important ways, for visualization selection and for language biases.
First, Q&A uses the Data Category information to help make choices about what kind of visual display to use. For example, it recognizes that columns with date or time Data Categories are a good choice for the horizontal axis of a line chart or the play axis of a bubble chart. It assumes that results containing columns with geographical Data Categories might look good on a map.
Second, Q&A makes some educated guesses about how users are likely to talk about date and geography columns to help it understand certain types of questions. For example, the “when” in “When was John Smith hired?” is almost certain to map to a date column, and the “Brown” in “Count customers in Brown” is more likely to be a city than a hair color.
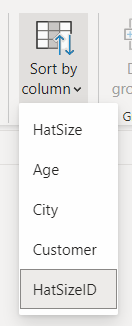
Choose a Sort By Column for relevant columns
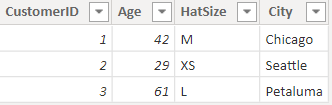
The Sort By Column property allows sorting in one column to automatically sort a different column instead. For example, when you ask “sort customers by hat size”, you probably want your Hat Size column to sort by the underlying size number (XS, S, M, L, XL) rather than alphabetically (L, M, S, XL, XS).
Normalize your model
You don't need to reshape your entire model. However, certain structures are so difficult that Q&A doesn't handle them well. If you perform some basic normalization of the structure of your model, the usability of Power BI reports increases significantly, along with the accuracy of Q&A results.
Follow this general rule: Each unique “thing” the user talks about should be represented by exactly one model object (table or column). So, if your users talk about customers, there should be one customer object. If your users talk about sales, there should be one sales object. There are rich data shaping capabilities available in Query Editor if you need them. The more straightforward transformations can be adjusted by using calculations in the Power BI model.
The following sections contain some common transformations you might need to perform. See Normalization vs. denormalization in the article Understand star schema and the importance for Power BI for more information about normalizing a model.
Create new tables for multi-column entities
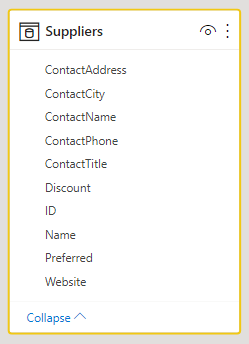
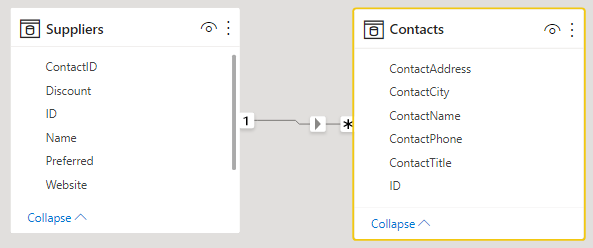
If you have multiple columns that act as a single distinct unit within a larger table, those columns should be split into their own table. For example, say you have a Contact Name, Contact Title, and Contact Phone column within your Companies table. A better design would be to have a separate Contacts table to contain the Name, Title, and Phone, and a link back to the Companies table. That makes it easier to ask questions about contacts independently of questions about companies for which they're the contact, and improves display flexibility.
Needs work
Ready for Q&A
Pivot to eliminate property bags
If you have property bags in your model, they should be restructured to have a single column per property. Property bags, while convenient for managing large numbers of properties, have inherent limitations that Power BI reports and Q&A aren't designed to work around.
For example, consider a CustomerDemographics table with CustomerID, Property, and Value columns, where each row represents a different property of the customer (for example, age, marital status, or city). By overloading the meaning of the Value column based on the content of the Property column, it becomes impossible for Q&A to interpret most queries that reference it. A simple question such as “show the age of each customer” might happen to work, since it could be interpreted as “show the customers and customer demographics where property is age”. However, the structure of the model doesn’t support more complex questions like “average age of customers in Chicago.” While users who directly author Power BI reports can sometimes find clever ways to get the data they're looking for, Q&A only works when each column has a single meaning.
Needs work

Ready for Q&A
Union to eliminate partitioning
If you've partitioned your data across multiple tables, or have pivoted values across multiple columns, some common operations are difficult or impossible for your users to achieve. Consider first a typical table partitioning: a Sales2000-2010 table and a Sales2011-2020 table. If all of your important reports are restricted to a specific decade, you could probably leave it this way for Power BI reports. However, the flexibility of Q&A leads your users to expect answers to questions like “total sales by year.” For this query to work, you need to union the data into a single Power BI model table.
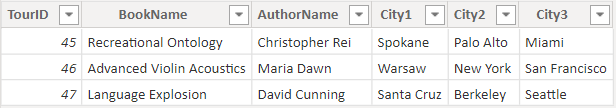
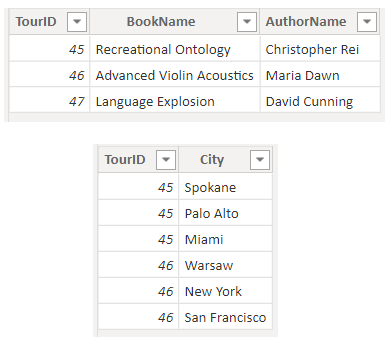
Similarly, consider a typical pivoted value column: a BookTour table containing Author, Book, City1, City2, and City3 columns. With a structure like this, even simple questions like “count books by city” can't be interpreted correctly. For this query to work, create a separate BookTourCities table, which unions the city values into a single column.
Needs work
Ready for Q&A
Split formatted columns
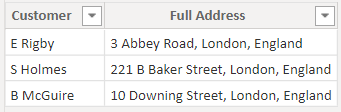
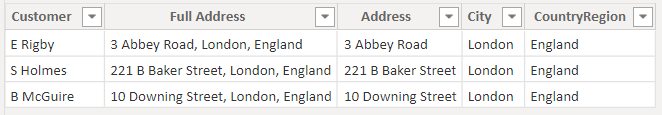
If the source from which you're importing your data contains formatted columns, Power BI reports (and Q&A) don't reach inside the column to parse its contents. So if you have, for example, a Full Address column that contains the address, city, and country/region, you should also split it into Address, City, and CountryRegion columns so your users can query against them individually.
Needs work
Ready for Q&A
Similarly, if you have any full name columns for a person, add First Name and Last Name columns, just in case someone wants to ask questions using partial names.
Create new tables for multi-value columns
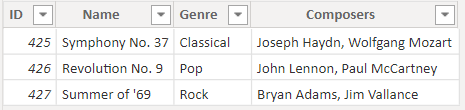
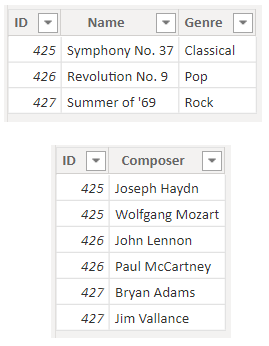
Also a similar situation, if the source from which you're importing your data contains multi-value columns, Power BI reports (and Q&A) can't reach inside the column to parse out the contents. So, if you have, for example, a Composer column that contains the names of multiple composers for a song, split it into multiple rows in a separate Composers table.
Needs work
Ready for Q&A
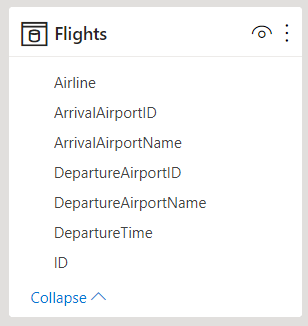
Denormalize to eliminate inactive relationships
The one exception to the “normalization is better” rule occurs when there's more than one path to get from one table to another. For example, say you have a Flights table with both SourceCityID and DestinationCityID columns, each of which are related to the Cities table. One of those relationships has to be marked as inactive. Because Q&A can only use active relationships, you can't ask questions about either source or destination, depending on which you chose. If you instead denormalize the city name columns into the Flights table, you can ask questions like “list the flights for tomorrow with a source city of Seattle and a destination city of San Francisco.”
Needs work
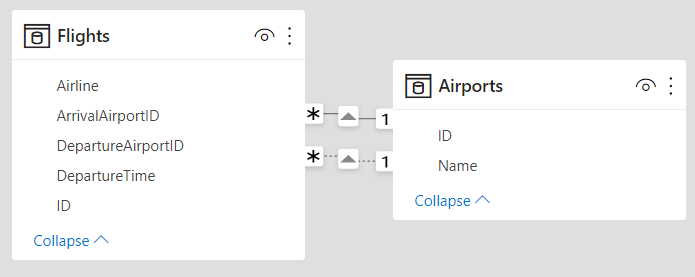
Ready for Q&A
Add synonyms to tables and columns
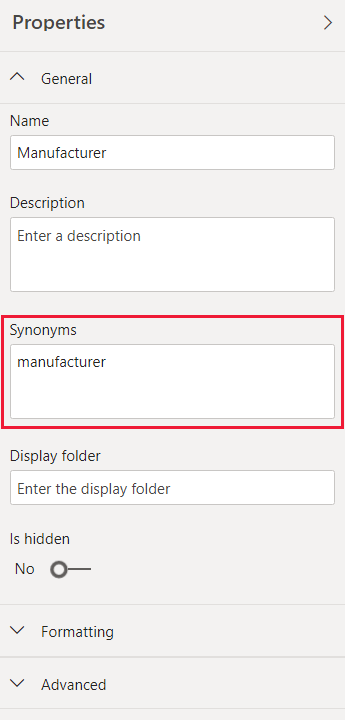
This step applies specifically to Q&A (and not to Power BI reports in general). Users often have many terms they use to refer to the same thing, such as total sales, net sales, and total net sales. You can add these synonyms to tables and columns in the Power BI model.
This step can be important. Even with straightforward table and column names, users of Q&A ask questions using the vocabulary that first comes to them. They're not choosing from a predefined list of columns. The more sensible synonyms you add, the better your user's experience is with your report. To add synonyms, in Power BI Desktop go to the Model view by selecting the Model tab and then select a field or table. The Properties pane shows the Synonyms box, where you can add synonyms.
Be aware that adding the same synonym to more than one column or table introduces ambiguity. Q&A uses context where possible to choose between ambiguous synonyms, but not all questions have sufficient context. For example, when a user asks “count the customers”, if you have three things with the synonym “customer” in your model, the user might not get the answer they're looking for. In these cases, make the primary synonym unique because that synonym is what's used in the restatement. It can alert the user to the ambiguity (for example, a restatement of “show the number of archived customer records”), which hints that they might want to ask it differently.
Related content
Feedback
Coming soon: Throughout 2024 we will be phasing out GitHub Issues as the feedback mechanism for content and replacing it with a new feedback system. For more information see: https://aka.ms/ContentUserFeedback.
Submit and view feedback for