What are paginated reports in Power BI?
APPLIES TO: ![]() Power BI Report Builder
Power BI Report Builder ![]() Power BI Desktop
Power BI Desktop
Paginated reports are designed to be printed or shared. They're called paginated because they're formatted to fit well on a page. They display all the data in a table, even if the table spans multiple pages. You can control their report page layout exactly. Power BI Report Builder is the standalone tool for authoring paginated reports for the Power BI service.
Here are some quick links if you're ready to get started:
- Install Power BI Report Builder from the Microsoft Download Center
- Tutorial: Create a paginated report
- Sample Power BI paginated reports
- Looking for information about Microsoft Report Builder for Power BI Report Server and SQL Server Reporting Services? See Install Microsoft Report Builder - Power BI Report Server instead.
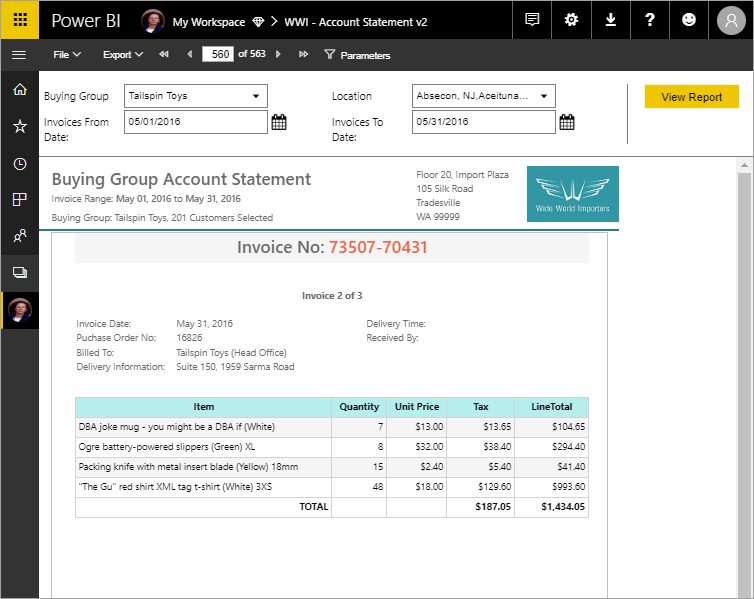
Paginated reports often have many pages. For example, this report has 563 pages. Each page is laid out exactly, with one page per invoice, and repeating headers and footers.
You can preview your report in Report Builder, then publish it to the Power BI service, app.powerbi.com.
Prerequisites
License requirements for Power BI paginated reports (.rdl files) are the same as for Power BI reports (.pbix files).
- You don't need a license to download Power BI Report Builder from the Microsoft Download Center for free.
- With a free license, you can publish paginated reports to My Workspace in the Power BI service. For more information, see Feature availability for users with free licenses in the Power BI service.
- With a Power BI Pro license or a PPU license, you can publish paginated reports to other workspaces. You also need at least a contributor role in the workspace.
- You need Build permission for the dataset.
Compare Power BI reports and paginated reports
A major advantage of paginated reports is their ability to print all the data in a table, no matter how long. Picture that you place a table in a Power BI report. You see some of its rows in the table on the page, and you have a scroll bar to see the rest. If you print that page, or export it to PDF, the only rows that print are the ones you saw on the page.
Now say you place the same table in a paginated report. When you print it or export it to PDF, the paginated report has as many pages as necessary to print every row in that table.
In the following video, Microsoft Most Valued Professional - Data Platform Peter Myers, and Principal Program Manager Chris Finlan demonstrate printing a similar table in the two report formats.
Note
This video might use earlier versions of Power BI Report Builder or the Power BI service.
This video is Module 1, part of an eight-module video-based course, Power BI Paginated Reports in a Day. The course is designed to empower you as a report author with the technical knowledge required to create, publish, and distribute Power BI paginated reports.
Create reports in Power BI Report Builder
Paginated reports have their own design tool, Power BI Report Builder. It's a new tool that shares the same foundation as the tools you'd previously used to create paginated reports for Power BI Report Server or SQL Server Reporting Services (SSRS). In fact, paginated reports that you create for SSRS 2016 and 2017 or for Power BI Report Server on-premises, are compatible with the Power BI service. The Power BI service maintains backwards compatibility so you can move your reports forward, and you can upgrade any previous-version paginated reports. Not all report features are available at launch. See Considerations and limitations in this article for details.
Apply sensitivity labels to paginated reports
Sensitivity labels can be applied to paginated reports hosted in the Power BI service. After uploading a paginated report to the service, you apply the label to the report just as you would to a regular Power BI report.
Read more about sensitivity label support for pagination reports.
Report from a variety of data sources
A single paginated report can have a number of different data sources. It doesn't have an underlying data model, unlike Power BI reports. You create embedded data sources and datasets in the paginated report itself. You can't use shared data sources or shared datasets. You create reports in Report Builder on your local computer. If a report connects to on-premises data, after you upload the report to the Power BI service, you need to create a gateway and redirect the data connection. Here are some of the data sources you can connect to:
- Azure SQL Database and Azure Synapse Analytics (via Basic and oAuth)
- Azure Analysis Services (via SSO)
- SQL Server via a gateway
- Power BI semantic models
- Oracle
- Teradata
See Supported data sources for Power BI paginated reports for a complete list.
Design your report
Create paginated reports with matrix, chart, and free-form layouts
Table reports work well for column-based data. Matrix reports, like cross-tab or PivotTable reports, are good for summarized data. Chart reports present data in a graphical format, and free-form list reports can present almost anything else, such as invoices.
You can start with one of the Report Builder wizards. The Table, Matrix, and Chart wizards walk you through creating the embedded data source connection and embedded dataset. Then you drag and drop fields to create a dataset query, select a layout and style, and customize your report.
With the Map wizard, you create reports that display aggregated data against a geographic or geometric background. Map data can be spatial data from a Transact-SQL query or an Environmental Systems Research Institute, Inc. (ESRI) shapefile. You can also add a Microsoft Bing map tile background.
Add more to your report
Modify your data by filtering, grouping, and sorting data, or by adding formulas or expressions. Add charts, gauges, sparklines, and indicators to summarize data in a visual format. Use parameters and filters to filter data for customized views. Embed or reference images and other resources, including external content.
Everything in a paginated report, from the report itself to every text box, image, table, and chart, has an array of properties you can set to make the report look exactly as you want it.
Creating a report definition
When you design a paginated report, you're really creating a report definition. It doesn't contain the data. It specifies where to get the data, which data to get, and how to display the data. When you run the report, the report processor takes the report definition you've specified, retrieves the data, and combines it with the report layout to generate the report. You upload the report definition to the Power BI service, https://app.powerbi.com, either to your My Workspace or to a workspace shared with your colleagues. If the report data source is on premises, after you upload the report, you redirect the data source connection to go through a gateway.
View your paginated report
You view your paginated report in the Power BI service in a browser, and also in the Power BI mobile apps. From the Power BI service, you can export the report to a number of formats, such as HTML, MHTML, PDF, XML, CSV, TIFF, Word, and Excel. You can also share it with others.
Create a subscription to your report
You can set up email subscriptions for yourself and others for paginated reports in the Power BI service. In general, the process is the same as subscribing to reports and dashboards in the Power BI service. Paginated report subscriptions in the Power BI service are similar to email standard subscriptions in Power BI Report Server and SQL Server Reporting Services. In setting up subscriptions, you choose how often you want to receive the emails: daily, weekly, or hourly. The subscription contains a PDF attachment of the entire report output.
For details, see "Subscribe to paginated reports" in the article Email subscriptions for reports and dashboards in the Power BI service.
Use deployment pipelines with paginated reports
In the Power BI service, you can use the deployment pipeline tool with paginated reports. Deployment pipelines let you develop and test your Power BI paginated reports before you release them to your users. The tool is a pipeline with three stages:
- Development
- Test
- Production
Read about how to get started with deployment pipelines in the Power BI service.
Embed Power BI paginated reports
With Power BI embedded analytics, you can create Power BI content that displays paginated reports in a fully integrated and interactive application. You can embed paginated reports either for your customers or for your organization. See Embed Power BI paginated reports for more information.
Considerations and limitations
Here are some other features that aren't supported:
- Pinning report pages or visuals to Power BI dashboards. You can still pin visualizations to a Power BI dashboard from an on-premises paginated report on a Power BI Report Server prior to the September 2022 release or SQL Server Reporting Services 2022 release report server. See Pin Reporting Services items to Power BI dashboards for more information on this discontinued feature.
- Document maps. They don't render in the Power BI service, but they do when you export a report.
- Shared data sources and shared datasets.
- Data-driven subscriptions for paginated reports in the Power BI service.
Next steps
Feedback
Coming soon: Throughout 2024 we will be phasing out GitHub Issues as the feedback mechanism for content and replacing it with a new feedback system. For more information see: https://aka.ms/ContentUserFeedback.
Submit and view feedback for