Create or edit a dashboard tile
APPLIES TO: ![]() Power BI Desktop
Power BI Desktop ![]() Power BI service
Power BI service
Dashboard owners versus dashboard consumers
When you create or own a dashboard, you have many options for changing the look and default behavior of the tiles on that dashboard. Use the following settings and strategies to design the dashboard consuming experience for your colleagues. Will selecting a tile open the underlying report, a custom URL, or a different dashboard? Maybe you'll add a tile that displays a video or streaming data? You might even want to create a tile that has interactive slicers. As a creator you have many options.
Note
This video might use earlier versions of Power BI Desktop or the Power BI service.
This article covers how to:
-
Tip
To change the visualization shown on the tile itself, delete the tile and add a new dashboard tile.
Prerequisites
You just need a Fabric free license to explore the samples in the Power BI service, and save them to your My workspace.
Get the sample
To follow along, open the Power BI service (app.powerbi.com).
Select Learn in the left nav.
On the Learning center page, under Sample reports, scroll until you see the IT Spend Analysis sample.
Select the sample. It opens in Reading mode.
Create a visualization and pin it to the dashboard
Open the report in Editing view by selecting Edit from the top menu bar.
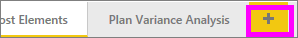
Add a new report page by selecting the plus sign (+) at the bottom of the report.
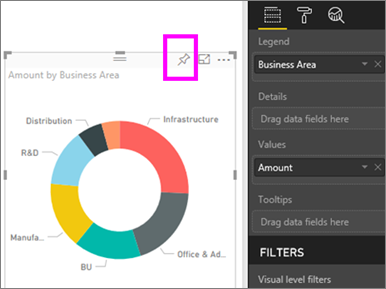
From the Data pane, select Fact > Amount and Business Area > Business Area.
From the Visualizations pane, select the Donut chart icon to convert the visualization to a Donut chart.

Select the pin icon and pin the Donut chart to the IT Spend Analysis sample dashboard.
When the Pinned to dashboard message appears, select Go to dashboard. You'll be prompted to save your changes. Select Save.
Move the tile
On the dashboard, locate the new tile. Select and hold the tile to drag it to a new location on the dashboard canvas.
Resize the tile
You can make tiles many different sizes—from 1x1 tile units up to 5x5. Select and drag the handle in the bottom right corner to resize the tile.

Edit details
Select More options (...) in the upper-right corner of the tile.

Hover over the "Amount" tile and select the ellipses to display the options. The options available vary by tile type. For example, the options available for a live tile are different from options available for a standard visualization tile. Also, if someone has shared a dashboard with you, you aren't the owner, and you'll have fewer options.

Select Edit details to open the "Tile details" dialog.
Change the title and default behavior of the tile. For example, you might decide that a new dashboard displays when a consumer selects a tile, instead of opening the report that was used to create that tile.
Rename the tile
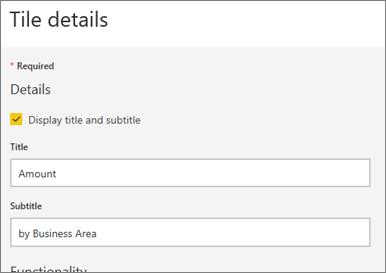
At the top of the "Tile details" dialog, change Title to Amount spent.
Change the default hyperlink
By default, selecting a tile usually takes you to the report where the tile was created or to Q&A if the tile was created in Q&A. Add a custom link to a tile to link to a webpage, another dashboard or report in the same workspace, a SQL Server Reporting Services (SSRS) report, or other online content.
In the Functionality section on the "Tile details" dialog, select Set custom link.
Select Link to a dashboard or report in the current workspace and then select from the dropdown. In this example, the Human Resources sample dashboard is selected. If you don't have this sample already in your workspace, you can add it and come back to this step, or you can select a different dashboard.

Select Apply.
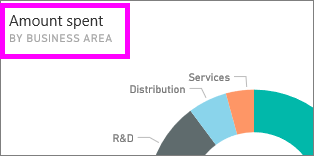
The new title displays on the tile. When you select the tile, Power BI opens the Human Resources dashboard.
Pin the tile to a different dashboard
From More options, select Pin tile
 .
.Decide whether to pin a duplicate of this tile to an existing dashboard or to a new dashboard.
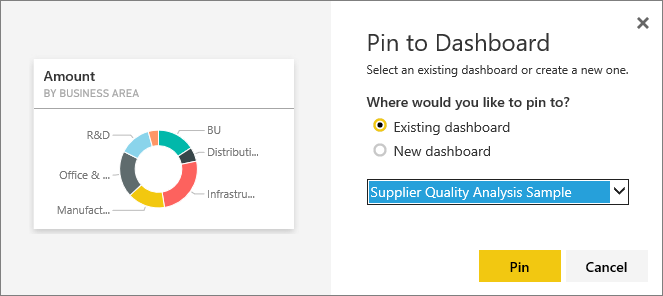
Select Pin.
Delete the tile
To permanently remove a tile from a dashboard, select More options > Delete tile
 from the ellipses dropdown menu.
Deleting a tile doesn't delete the underlying visualization. Open the underlying report by selecting the "Amount" tile. Open the last page in your report to see that the original visualization hasn't been deleted from the report.
Related content
More questions? Ask the Power BI Community
Feedback
Coming soon: Throughout 2024 we will be phasing out GitHub Issues as the feedback mechanism for content and replacing it with a new feedback system. For more information see: https://aka.ms/ContentUserFeedback.
Submit and view feedback for