TripPin part 8 - Adding diagnostics
This multi-part tutorial covers the creation of a new data source extension for Power Query. The tutorial is meant to be done sequentially—each lesson builds on the connector created in previous lessons, incrementally adding new capabilities to your connector.
In this lesson, you will:
- Learn about the Diagnostics.Trace function
- Use the Diagnostics helper functions to add trace information to help debug your connector
Enabling diagnostics
Power Query users can enable trace logging by selecting the checkbox under Options | Diagnostics.
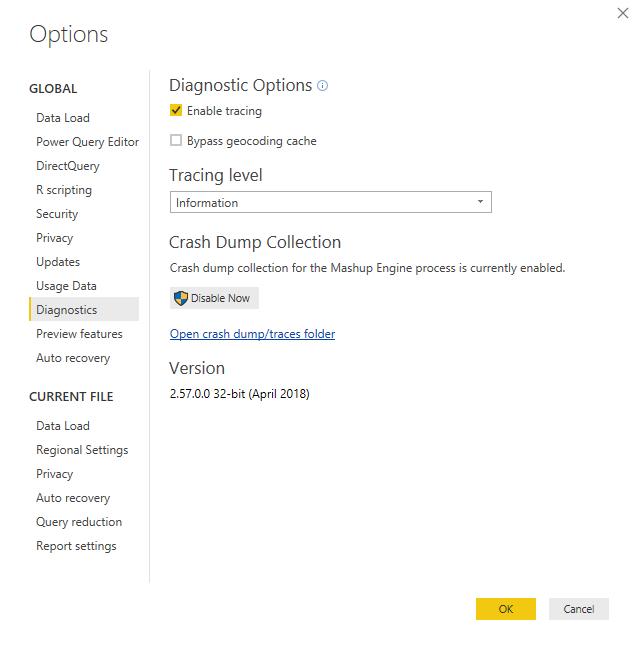
Once enabled, any subsequent queries will cause the M engine to emit trace information to log files located in a fixed user directory.
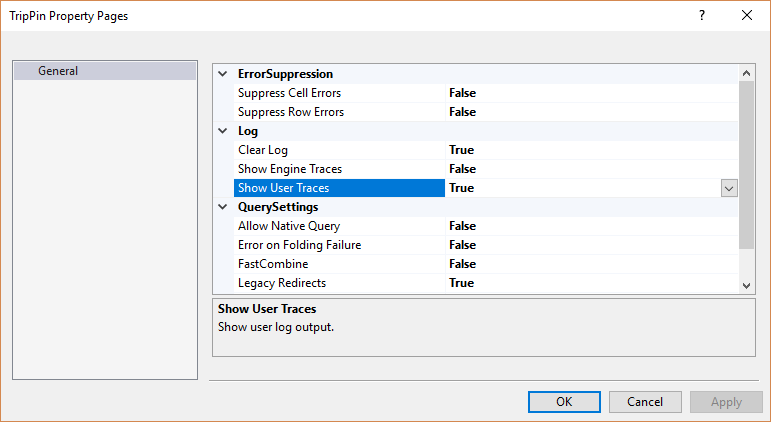
When running M queries from within the Power Query SDK, tracing is enabled at the project level. On the project properties page, there are three settings related to tracing:
- Clear Log—when this is set to
true, the log will be reset/cleared when you run your queries. We recommend you keep this set totrue. - Show Engine Traces—this setting controls the output of built-in traces from the M engine. These traces are generally only useful to members of the Power Query team, so you'll typically want to keep this set to
false. - Show User Traces—this setting controls trace information output by your connector. You'll want to set this to
true.
Once enabled, you'll start seeing log entries in the M Query Output window, under the Log tab.
Diagnostics.Trace
The Diagnostics.Trace function is used to write messages into the M engine's trace log.
Diagnostics.Trace = (traceLevel as number, message as text, value as any, optional delayed as nullable logical as any) => ...
Important
M is a functional language with lazy evaluation. When using Diagnostics.Trace, keep in mind that the function will only be called if the expression its a part of is actually evaluated. Examples of this can be found later in this tutorial.
The traceLevel parameter can be one of the following values (in descending order):
TraceLevel.CriticalTraceLevel.ErrorTraceLevel.WarningTraceLevel.InformationTraceLevel.Verbose
When tracing is enabled, the user can select the maximum level of messages they would like to see. All trace messages of this level and under will be output to the log. For example, if the user selects the "Warning" level, trace messages of TraceLevel.Warning, TraceLevel.Error, and TraceLevel.Critical would appear in the logs.
The message parameter is the actual text that will be output to the trace file. Note that the text will not contain the value parameter unless you explicitly include it in the text.
The value parameter is what the function will return. When the delayed parameter is set to true, value will be a zero parameter function that returns the actual value you're evaluating. When delayed is set to false, value will be the actual value. An example of how this works can be found below.
Using Diagnostics.Trace in the TripPin connector
For a practical example of using Diagnostics.Trace and the impact of the delayed parameter, update the TripPin connector's GetSchemaForEntity function to wrap the error exception:
GetSchemaForEntity = (entity as text) as type =>
    try
        SchemaTable{[Entity=entity]}[Type]
    otherwise
        let
            message = Text.Format("Couldn't find entity: '#{0}'", {entity})
        in
            Diagnostics.Trace(TraceLevel.Error, message, () => error message, true);
You can force an error during evaluation (for test purposes!) by passing an invalid entity name to the GetEntity function. Here you change the withData line in the TripPinNavTable function, replacing [Name] with "DoesNotExist".
TripPinNavTable = (url as text) as table =>
    let
        // Use our schema table as the source of top level items in the navigation tree
        entities = Table.SelectColumns(SchemaTable, {"Entity"}),
        rename = Table.RenameColumns(entities, {{"Entity", "Name"}}),
        // Add Data as a calculated column
        withData = Table.AddColumn(rename, "Data", each GetEntity(url, "DoesNotExist"), type table),
        // Add ItemKind and ItemName as fixed text values
        withItemKind = Table.AddColumn(withData, "ItemKind", each "Table", type text),
        withItemName = Table.AddColumn(withItemKind, "ItemName", each "Table", type text),
        // Indicate that the node should not be expandable
        withIsLeaf = Table.AddColumn(withItemName, "IsLeaf", each true, type logical),
        // Generate the nav table
        navTable = Table.ToNavigationTable(withIsLeaf, {"Name"}, "Name", "Data", "ItemKind", "ItemName", "IsLeaf")
    in
        navTable;
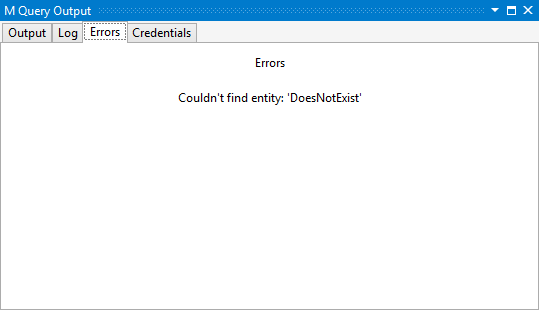
Enable tracing for your project, and run your test queries. On the Errors tab you should see the text of the error you raised:
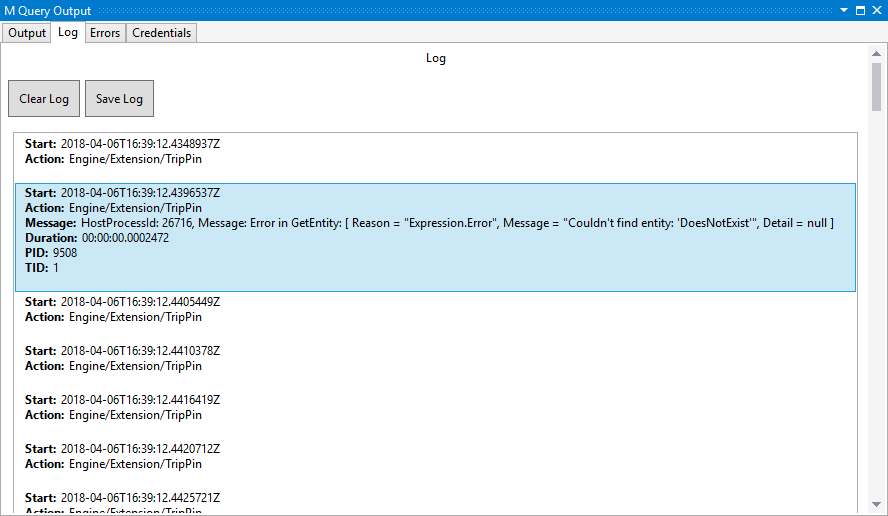
Also, on the Log tab, you should see the same message. Note that if you use different values for the message and value parameters, these would be different.
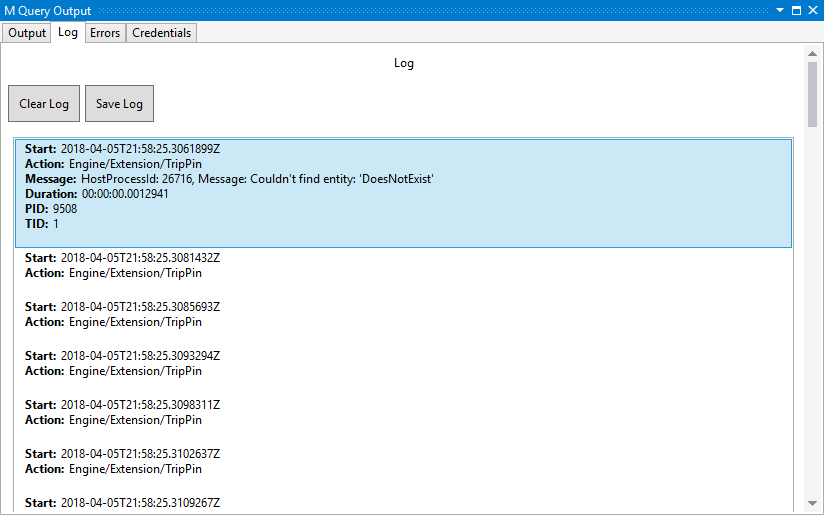
Also note that the Action field of the log message contains the name (Data Source Kind) of your extension (in this case, Engine/Extension/TripPin). This makes it easier to find the messages related to your extension when there are multiple queries involved and/or system (mashup engine) tracing is enabled.
Delayed evaluation
As an example of how the delayed parameter works, you'll make some modifications and run the queries again.
First, set the delayed value to false, but leave the value parameter as-is:
Diagnostics.Trace(TraceLevel.Error, message, () => error message, false);
When you run the query, you'll receive an error that "We cannot convert a value of type Function to type Type", and not the actual error you raised. This is because the call is now returning a function value, rather than the value itself.
Next, remove the function from the value parameter:
Diagnostics.Trace(TraceLevel.Error, message, error message, false);
When you run the query, you'll receive the correct error, but if you check the Log tab, there will be no messages. This is because the error ends up being raised/evaluated during the call to Diagnostics.Trace, so the message is never actually output.
Now that you understand the impact of the
delayedparameter, be sure to reset your connector back to a working state before proceeding.
Diagnostic helper functions in Diagnostics.pqm
The Diagnostics.pqm file included in this project contains a number of helper functions that make tracing easier. As shown in the previous tutorial, you can include this file in your project (remembering to set the Build Action to Compile), and then load it in your connector file. The bottom of your connector file should now look something like the code snippet below. Feel free to explore the various functions this module provides, but in this sample, you'll only be using the Diagnostics.LogValue and Diagnostics.LogFailure functions.
// Diagnostics module contains multiple functions. We can take the ones we need.
Diagnostics = Extension.LoadFunction("Diagnostics.pqm");
Diagnostics.LogValue = Diagnostics[LogValue];
Diagnostics.LogFailure = Diagnostics[LogFailure];
Diagnostics.LogValue
The Diagnostics.LogValue function is a lot like Diagnostics.Trace, and can be used to output the value of what you're evaluating.
Diagnostics.LogValue = (prefix as text, value as any) as any => ...
The prefix parameter is prepended to the log message. You'd use this to figure out which call output the message. The value parameter is what the function will return, and will also be written to the trace as a text representation of the M value. For example, if value is equal to a table with columns A and B, the log will contain the equivalent #table representation: #table({"A", "B"}, {{"row1 A", "row1 B"}, {"row2 A", row2 B"}})
Note
Serializing M values to text can be an expensive operation. Be aware of the potential size of the values you are outputting to the trace.
Note
Most Power Query environments will truncate trace messages to a maximum length.
As an example, you'll update the TripPin.Feed function to trace the url and schema arguments passed into the function.
TripPin.Feed = (url as text, optional schema as type) as table =>
    let
        _url = Diagnostics.LogValue("Accessing url", url),
        _schema = Diagnostics.LogValue("Schema type", schema),
        //result = GetAllPagesByNextLink(url, schema)
        result = GetAllPagesByNextLink(_url, _schema)
    in
        result;
Note that you have to use the new _url and _schema values in the call to GetAllPagesByNextLink. If you used the original function parameters, the Diagnostics.LogValue calls would never actually be evaluated, resulting in no messages written to the trace. Functional programming is fun!
When you run your queries, you should now see new messages in the log.
Accessing url:
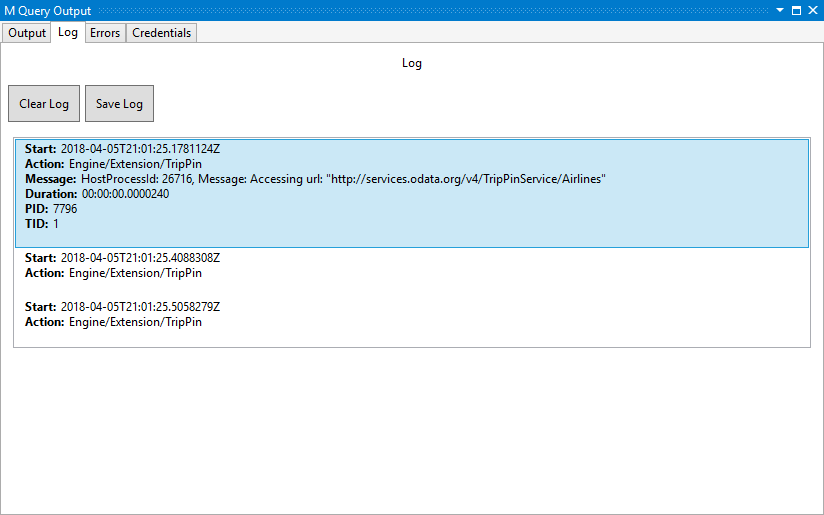
Schema type:
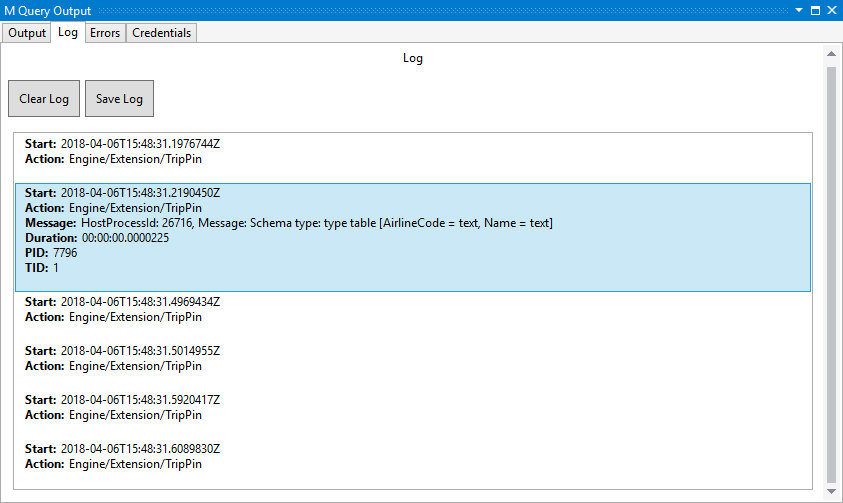
Note that you see the serialized version of the schema parameter type, rather than what you'd get when you do a simple Text.FromValue on a type value (which results in "type").
Diagnostics.LogFailure
The Diagnostics.LogFailure function can be used to wrap function calls, and will only write to the trace if the function call fails (that is, returns an error).
Diagnostics.LogFailure = (text as text, function as function) as any => ...
Internally, Diagnostics.LogFailure adds a try operator to the function call. If the call fails, the text value is written to the trace before returning the original error. If the function call succeeds, the result is returned without writing anything to the trace. Since M errors don't contain a full stack trace (that is, you typically only see the message of the error), this can be useful when you want to pinpoint where the error was actually raised.
As a (poor) example, modify the withData line of the TripPinNavTable function to force an error once again:
withData = Table.AddColumn(rename, "Data", each Diagnostics.LogFailure("Error in GetEntity", () => GetEntity(url, "DoesNotExist")), type table),
In the trace, you can find the resulting error message containing your text, and the original error information.
Be sure to reset your function to a working state before proceeding with the next tutorial.
Conclusion
This brief (but important!) lesson showed you how to make use of the diagnostic helper functions to log to the Power Query trace files. When used properly, these functions are extremely useful in debugging issues within your connector.
Note
As a connector developer, it is your responsibility to ensure that you do not log sensitive or personally identifiable information (PII) as part of your diagnostic logging. You must also be careful to not output too much trace information, as it can have a negative performance impact.
Next steps
Feedback
Coming soon: Throughout 2024 we will be phasing out GitHub Issues as the feedback mechanism for content and replacing it with a new feedback system. For more information see: https://aka.ms/ContentUserFeedback.
Submit and view feedback for