Write Telemetry to your Application Insights resource using ILogger
Important
To use this capability you must first enable the Application Insights integration feature. More information: Analyze model-driven apps and Microsoft Dataverse telemetry with Application Insights
There is presently no support ofILogger within a plug-in profiling/debug session of the Plug-in Registration tool or the Power Platform Tools extension for Visual Studio.
When you enable Application Insights for your organization, any plug-ins written using the ILogger Interface provided in the SDK for .NET assemblies write telemetry to your Application Insights resource.
The Dataverse platform captures the Dataverse and model-driven app telemetry data and exports it to your Application Insights resource. There's some latency between the time it was captured and when it becomes available to you in Application Insights. Because Microsoft gathers this telemetry, you don't need to write any code to enable it.
Telemetry data that comes from plug-ins using the ILogger interface is different in two ways:
- This telemetry is written directly to your Application Insights resource and is never sent to Microsoft.
- There's less latency in viewing this data.
- You must update your plug-in code to use the ILogger interface.
Using ILogger provides true telemetry data and is intended to work together with the existing Plug-in Trace Logs written using the ITracingService Interface. The following table compares the capabilities:
| Criteria | ILogger for Application Insights | ITracingService Trace for Plug-in Trace Logs |
|---|---|---|
| Intended use | Capture telemetry over time for analysis and debugging. | While developing and debugging plug-ins |
| How long data is stored | According to your Application Insights data retention period, which is 90 days by default | 24 hours |
| Available | Only for organizations that have subscribed to Application Insights integration. | Available for any organization when Plug-in tracing is enabled. |
| Amount of data | Each log message can pass a String value. | Only 10 kb of text can be written for each plug-in execution. Any more is truncated. |
| Available in runtime errors | No | Available in model-driven app client errors and as annotations in Web API. More information: Include more details with errors |
You should continue to use the ITracingService.Trace to write to the Plug-in Trace Log table when needed. Not every organization enables Application Insights. If your plug-in code uses the ILogger interface and the organization doesn't have Application Insights integration enabled, nothing is written. So, it's important to continue to use the ITracingService Trace method in your plug-ins. Plug-in trace logs continue to be an important way to capture data while developing and debugging plug-ins, but they were never intended to provide telemetry data. More information: Plug-ins: Tracing and logging
You should use ILogger because it provides telemetry about what happens within a plug-in. This telemetry is integrated with the larger scope of data captured with the Application Insights integration. The Application Insights integration tells you when a plug-in executes, how long it takes to run and whether it makes any external http requests, but Microsoft can't add any telemetry code within the plug-ins that you write to extend the behavior of the platform.
If you're an ISV with a product that includes plug-ins, your customers who enable Application Insights appreciate being able to see what is going on within your plug-ins and this data may help you support them if there are issues. But data captured using ILogger is only sent to the subscribing customer's resource. You'll only be able to see data captured for your own environments when you have Application Insights enabled.
Use ILogger
ILogger is a common interface for capturing log information. The implementation provided with the SDK for .NET assemblies provides common methods to support establishing a scope and different levels of logging. There's currently no setting to control what level of logs are written. The levels can be used within Application Insights to filter which logs to view.
The following is an example of a plug-in using both ILogger and ITracingService.Trace.
Note
Make sure you include using Microsoft.Xrm.Sdk.PluginTelemetry;. Don't use using Microsoft.Extensions.Logging;, otherwise the ILogger instance will be null.
using Microsoft.Xrm.Sdk;
using Microsoft.Xrm.Sdk.PluginTelemetry;
using System;
using System.Net.Http;

namespace ILoggerExample
{
    public class AccountPostOperation : IPlugin
    {
        private string webAddress;
        public AccountPostOperation(string config)
        {

            if (string.IsNullOrEmpty(config))
            {
                webAddress = "https://www.bing.com";
            }
            else
            {
                webAddress = config;
            }
        }


        public void Execute(IServiceProvider serviceProvider)
        {
            ITracingService tracingService =
               (ITracingService)serviceProvider.GetService(typeof(ITracingService));

            ILogger logger = (ILogger)serviceProvider.GetService(typeof(ILogger));

            IPluginExecutionContext context = (IPluginExecutionContext)
               serviceProvider.GetService(typeof(IPluginExecutionContext));

            try
            {
                string startExecMsg = "Start execution of AccountPostOperation";
                logger.LogInformation(startExecMsg);
                tracingService.Trace(startExecMsg);

                Entity entity = (Entity)context.InputParameters["Target"];
                if (entity.LogicalName != "account")
                {

                    string wrongEntityMsg = "Plug-in registered for wrong entity {0}";
                    logger.LogWarning(wrongEntityMsg, entity.LogicalName);
                    tracingService.Trace(wrongEntityMsg, entity.LogicalName);
                    return;
                }

                string activityMsg = "Callback";

                using (logger.BeginScope(activityMsg))
                {
                    tracingService.Trace(activityMsg);

                    string startTaskMsg = "Start Task Creation";
                    logger.LogInformation(startTaskMsg);
                    tracingService.Trace(startTaskMsg);

                    Entity followup = new Entity("task");
                    followup["subject"] = "Send e-mail to the new customer.";
                    followup["description"] =
                        "Follow up with the customer. Check if there are any new issues that need resolution.";
                    followup["scheduledstart"] = DateTime.Now.AddDays(7);
                    followup["scheduledend"] = DateTime.Now.AddDays(7);
                    followup["category"] = context.PrimaryEntityName;

                    // Refer to the account in the task activity.
                    if (context.OutputParameters.Contains("id"))
                    {
                        Guid regardingobjectid = new Guid(context.OutputParameters["id"].ToString());
                        string regardingobjectidType = "account";

                        followup["regardingobjectid"] =
                        new EntityReference(regardingobjectidType, regardingobjectid);

                    }

                    // Obtain the IOrganizationService reference.
                    IOrganizationServiceFactory serviceFactory = (IOrganizationServiceFactory)serviceProvider
                    .GetService(typeof(IOrganizationServiceFactory));

                    IOrganizationService service = serviceFactory.CreateOrganizationService(context.UserId);
                    //Create the task
                    service.Create(followup);

                    string endTaskMsg = "Task creation completed";
                    logger.LogInformation(endTaskMsg);
                    tracingService.Trace(endTaskMsg);
                }

                string outBoundScope = "OutboundCall";

                using (logger.BeginScope(outBoundScope))
                {

                    string outboundStartMsg = "Outbound call started";
                    logger.LogInformation(outboundStartMsg);
                    tracingService.Trace(outboundStartMsg);

                    using (HttpClient client = new HttpClient())
                    {
                        client.Timeout = TimeSpan.FromMilliseconds(15000); //15 seconds
                        client.DefaultRequestHeaders.ConnectionClose = true; //Set KeepAlive to false

                        HttpResponseMessage response = client
                            .GetAsync(webAddress)
                            .GetAwaiter()
                            .GetResult(); //Make sure it is synchronous

                        response.EnsureSuccessStatusCode();

                        string responseText = response.Content
                            .ReadAsStringAsync()
                            .GetAwaiter()
                            .GetResult(); //Make sure it is synchronous

                        string shortResponseText = responseText.Substring(0, 20);

                        logger.LogInformation(shortResponseText);
                        tracingService.Trace(shortResponseText);

                        string outboundEndMsg = "Outbound call ended successfully";

                        logger.LogInformation(outboundEndMsg);
                        tracingService.Trace(outboundEndMsg);

                    }

                }

            }
            catch (Exception e)
            {
                string errMsg = "Plugin failed";
                logger.LogError(e, errMsg);
                tracingService.Trace($"{errMsg}:{e.Message}");
                throw new InvalidPluginExecutionException(e.Message, e);
            }
        }
    }
}
When this plug-in is registered on a synchronous PostOperation step for the Create of an account entity, you can use Application Insights Logs to view the output within a few minutes. You can use Kusto Query Language (KQL) to query the results.
You can filter items for a single operation using the operation_ParentId that represents the request ID of the response header.
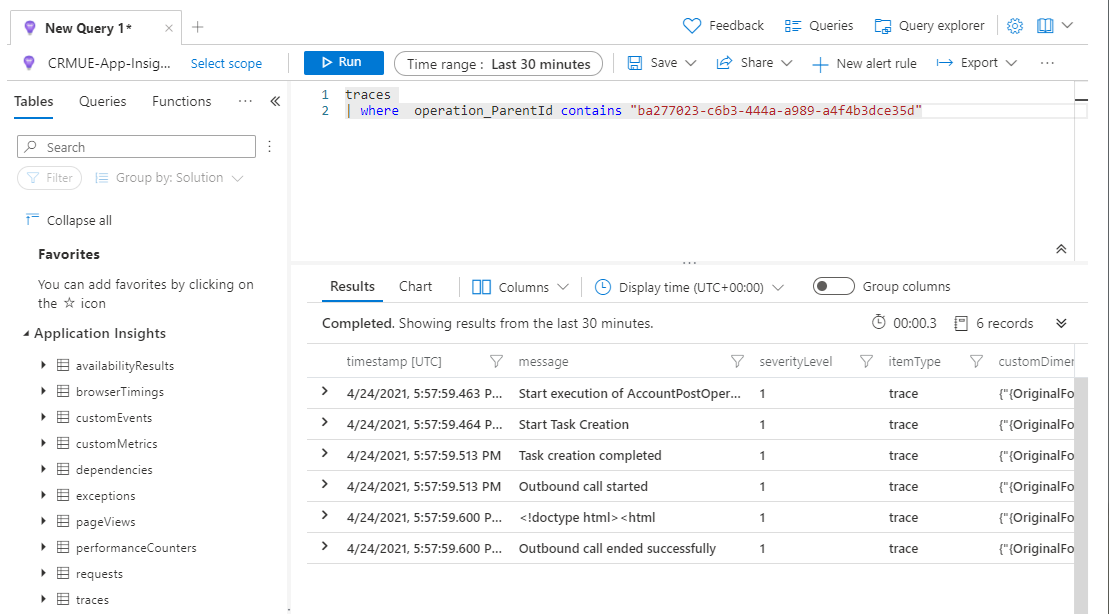
The corresponding plug-in trace log entry looks like this:
Start execution of AccountPostOperation
Callback
Start Task Creation
Task creation completed
Outbound call started
<!doctype html><html
Outbound call ended successfully
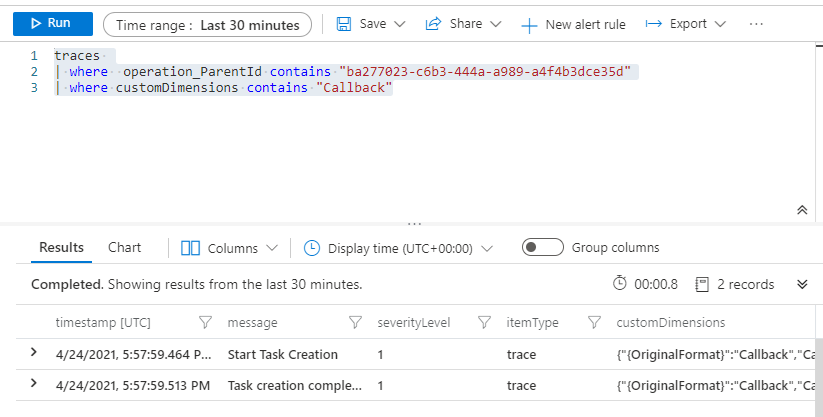
The information set with the BeginScope Method isn't visible in the rows returned in Application Insights. This data is set within the customDimensions of logs added within that scope. You can use this query to show the logs within the scope.
This query limits the results to the logs added during the Callback scope
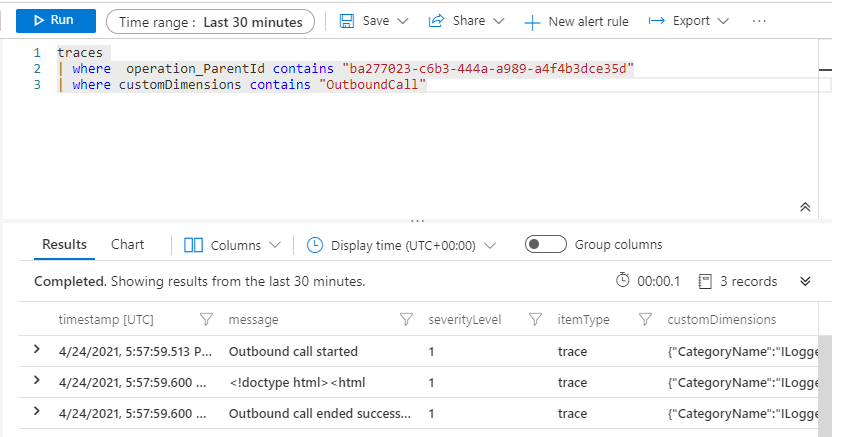
And this query limits the results to the logs added during the OutboundCall scope:
Logging Exceptions
At the bottom of the plug-in code example above, the following code uses LogError to log a caught exception and throws an InvalidPluginExecutionException:
catch (Exception e)
{
    string errMsg = "Plugin failed";
    logger.LogError(e, errMsg);
    tracingService.Trace($"{errMsg}:{e.Message}");
    throw new InvalidPluginExecutionException(e.Message, e);
}
Using the plug-in code above, you can cause an exception by passing an invalid value to step registration configuration data. In this example, the value is NOT_A_URL.

This value overrides the default value (https://www.bing.com) and cause the outbound call to fail.
There's nothing wrong with the request that a client may send:
POST [Organization URI]/api/data/v9.1/accounts HTTP/1.1
Prefer: odata.include-annotations="*"
Authorization: Bearer [REDACTED]
Content-Type: application/json

{
  "name":"Test account"
}
But due to the incorrect plug-in step registration the response returns the following error with all the details when the Prefer: odata.include-annotations="*" header is used:
HTTP/1.1 400 Bad Request
Content-Type: application/json; odata.metadata=minimal
x-ms-service-request-id: 8fd35fd6-5329-4bd5-a1b7-757f91822322
REQ_ID: 8fd35fd6-5329-4bd5-a1b7-757f91822322
OData-Version: 4.0
Date: Sat, 24 Apr 2021 18:24:46 GMT

{
    "error": {
        "code": "0x80040265",
        "message": "An invalid request URI was provided. The request URI must either be an absolute URI or BaseAddress must be set.",
        "@Microsoft.PowerApps.CDS.ErrorDetails.OperationStatus": "0",
        "@Microsoft.PowerApps.CDS.ErrorDetails.SubErrorCode": "-2146233088",
        "@Microsoft.PowerApps.CDS.HelpLink": "http://go.microsoft.com/fwlink/?LinkID=398563&error=Microsoft.Crm.CrmException%3a80040265&client=platform",
        "@Microsoft.PowerApps.CDS.TraceText": "\r\n[ILoggerExample: ILoggerExample.AccountPostOperation]\r\n[2ee952aa-90a4-eb11-b1ac-000d3a8f6891: ILoggerExample.AccountPostOperation: Create of account]\r\n\r\n\t\r\n\tStart execution of AccountPostOperation\r\n\tCallback\r\n\tStart Task Creation\r\n\tTask creation completed\r\n\tOutbound call started\r\n\tPlugin failed:An invalid request URI was provided. The request URI must either be an absolute URI or BaseAddress must be set.\r\n\t\r\n",
        "@Microsoft.PowerApps.CDS.InnerError.Message": "An invalid request URI was provided. The request URI must either be an absolute URI or BaseAddress must be set."
    }
}
The Plug-in Trace Log contains this exception data, which includes the ExceptionDetails data.
Exception type: System.ServiceModel.FaultException`1[Microsoft.Xrm.Sdk.OrganizationServiceFault]
Message: An invalid request URI was provided. The request URI must either be an absolute URI or BaseAddress must be set.Detail:
<OrganizationServiceFault xmlns:i="http://www.w3.org/2001/XMLSchema-instance" xmlns="http://schemas.microsoft.com/xrm/2011/Contracts">
  <ActivityId>09bf305c-8272-4fc4-801b-479280cb3069</ActivityId>
  <ErrorCode>-2147220891</ErrorCode>
  <ErrorDetails xmlns:d2p1="http://schemas.datacontract.org/2004/07/System.Collections.Generic">
    <KeyValuePairOfstringanyType>
      <d2p1:key>OperationStatus</d2p1:key>
      <d2p1:value xmlns:d4p1="http://www.w3.org/2001/XMLSchema" i:type="d4p1:int">0</d2p1:value>
    </KeyValuePairOfstringanyType>
    <KeyValuePairOfstringanyType>
      <d2p1:key>SubErrorCode</d2p1:key>
      <d2p1:value xmlns:d4p1="http://www.w3.org/2001/XMLSchema" i:type="d4p1:int">-2146233088</d2p1:value>
    </KeyValuePairOfstringanyType>
  </ErrorDetails>
  <HelpLink i:nil="true" />
  <Message>An invalid request URI was provided. The request URI must either be an absolute URI or BaseAddress must be set.</Message>
  <Timestamp>2021-04-24T18:24:46.4900727Z</Timestamp>
  <ExceptionRetriable>false</ExceptionRetriable>
  <ExceptionSource>PluginExecution</ExceptionSource>
  <InnerFault i:nil="true" />
  <OriginalException>PluginExecution</OriginalException>
  <TraceText>
Start execution of AccountPostOperation
Callback
Start Task Creation
Task creation completed
Outbound call started
Plugin failed:An invalid request URI was provided. The request URI must either be an absolute URI or BaseAddress must be set.
</TraceText>
</OrganizationServiceFault>
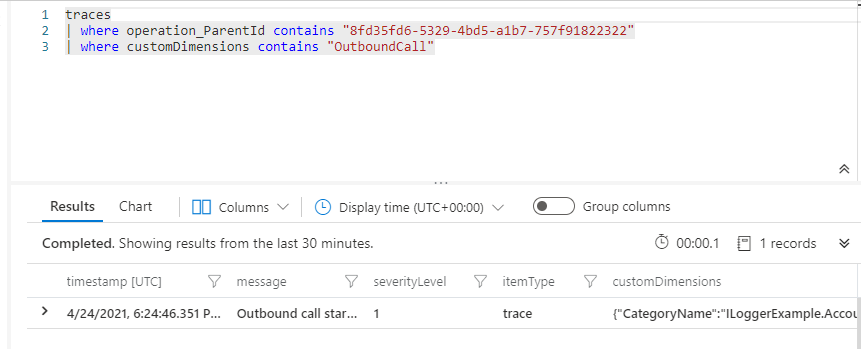
Within Application Insights, if you view traces scoped to this request and with the scope set to OutboundCall as shown earlier, you can see that the only entry is that the outbound call started.
Within Application Insights, when you switch your query to use exceptions rather than traces, you'll see three exceptions logged:
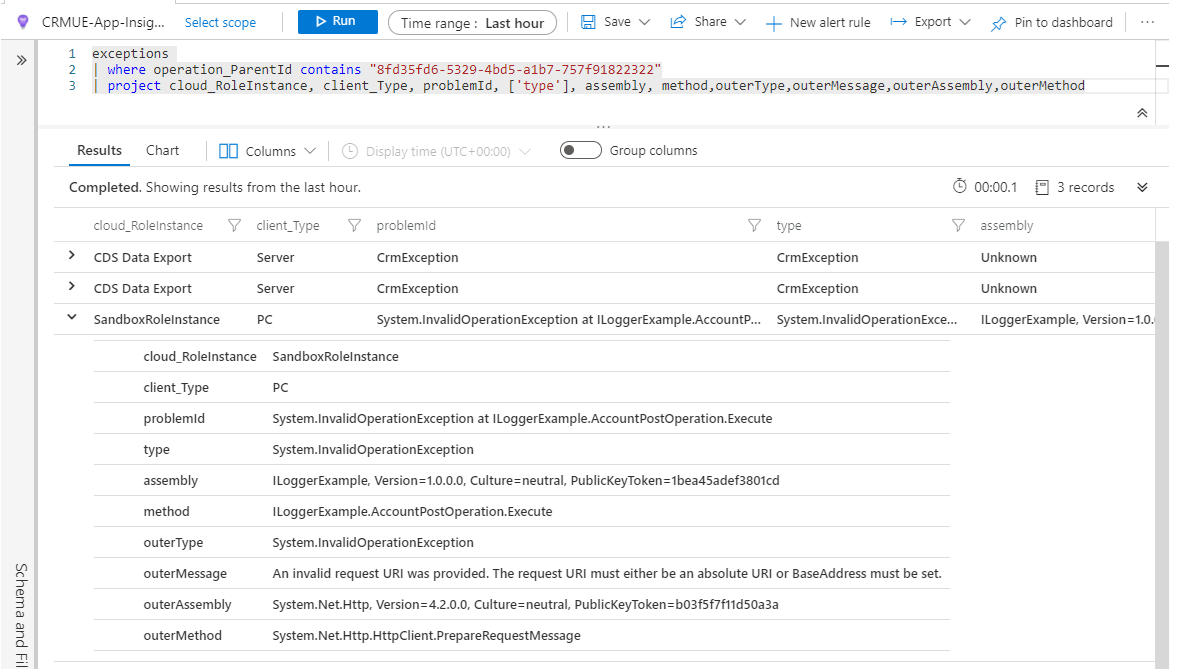
The one where cloud_RoleInstance equals SandboxRoleInstance is the one that was written because of the ILogger LogError method. The other two represent different locations where the error was logged on the server.
Note
The SandboxRoleInstance client_Type is PC. This is because the plug-in runs in an isolated sandbox as a client rather than on the server.
You can focus on the error log written by your code by filtering on the cloud_RoleInstance:

The formatted message text is captured as part of the customDimensions.
See also
Analyze model-driven apps and Microsoft Dataverse telemetry with Application Insights
Plug-ins
Debug a plug-in
View trace logs
Tracing service
PluginTraceLog Table
Feedback
Coming soon: Throughout 2024 we will be phasing out GitHub Issues as the feedback mechanism for content and replacing it with a new feedback system. For more information see: https://aka.ms/ContentUserFeedback.
Submit and view feedback for