ACM Pack Portal for Azure HPC Cluster
HPC ACM(Azure Cluster Management) portal aims to provide friendly interface for Azure HPC cluster diagnostics, cluster run, cluster monitoring and management.
Cluster Diagnostics
Run different categories of diagnostic tests to generate reports for issue analysis.
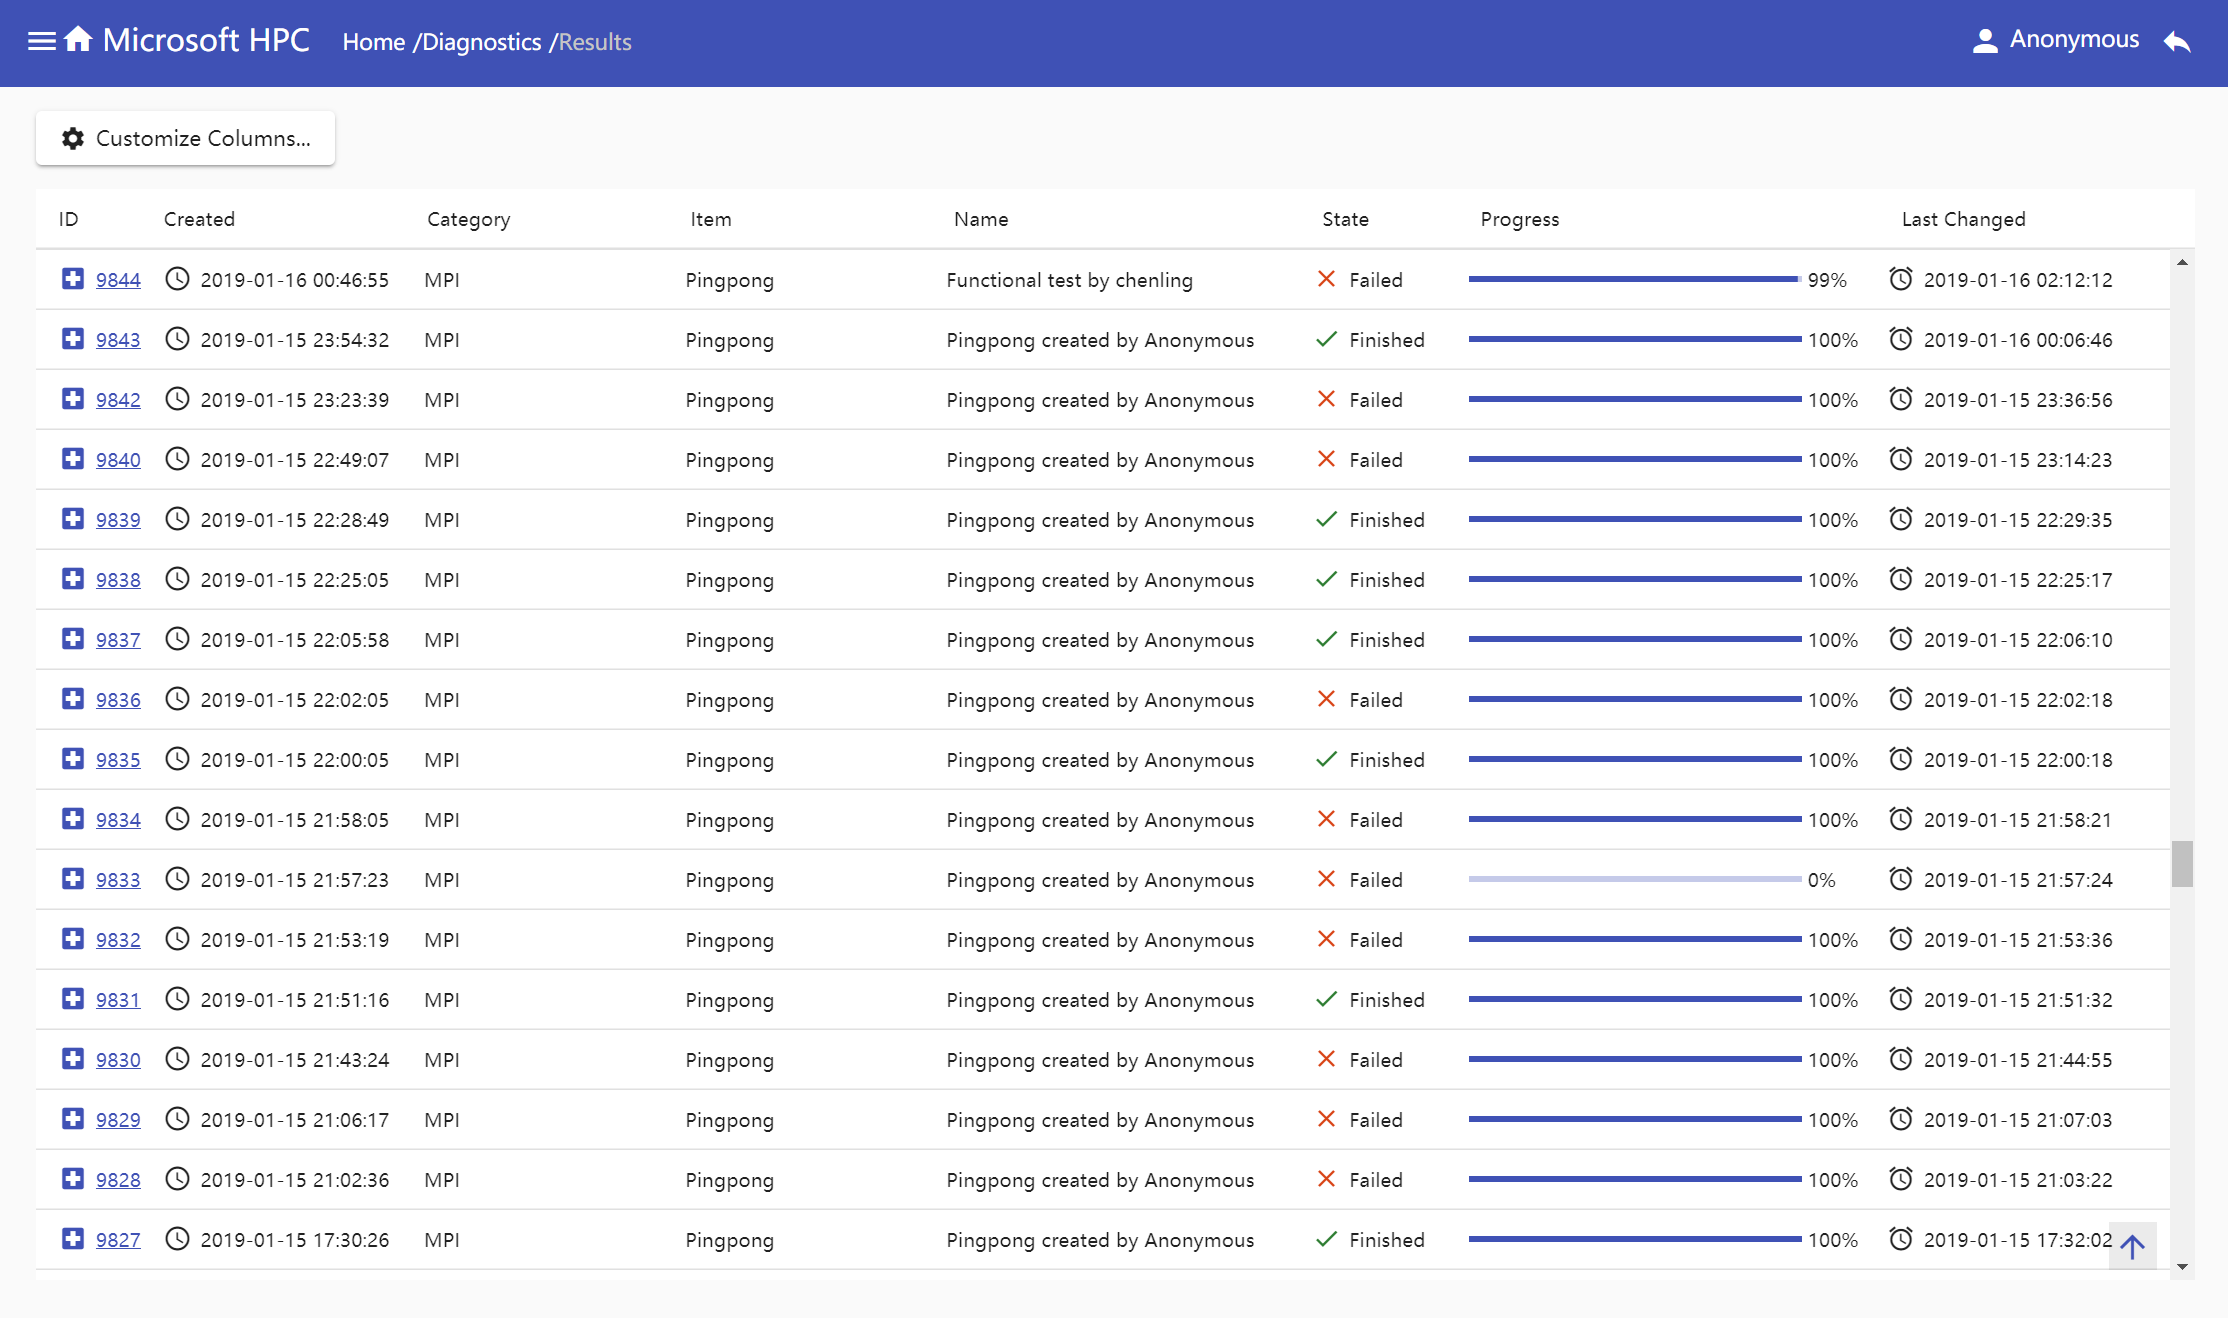
Diagnostics table
Diagnostics table displays all diagnostic tests by job created time. You can customize list columns, by default, the list displays job's id, created time, last changed time, diagnostic name, test category, test name, real-time job state and progress. Diagnostics table provides a very convenient way to track real-time state and progress of all test jobs.
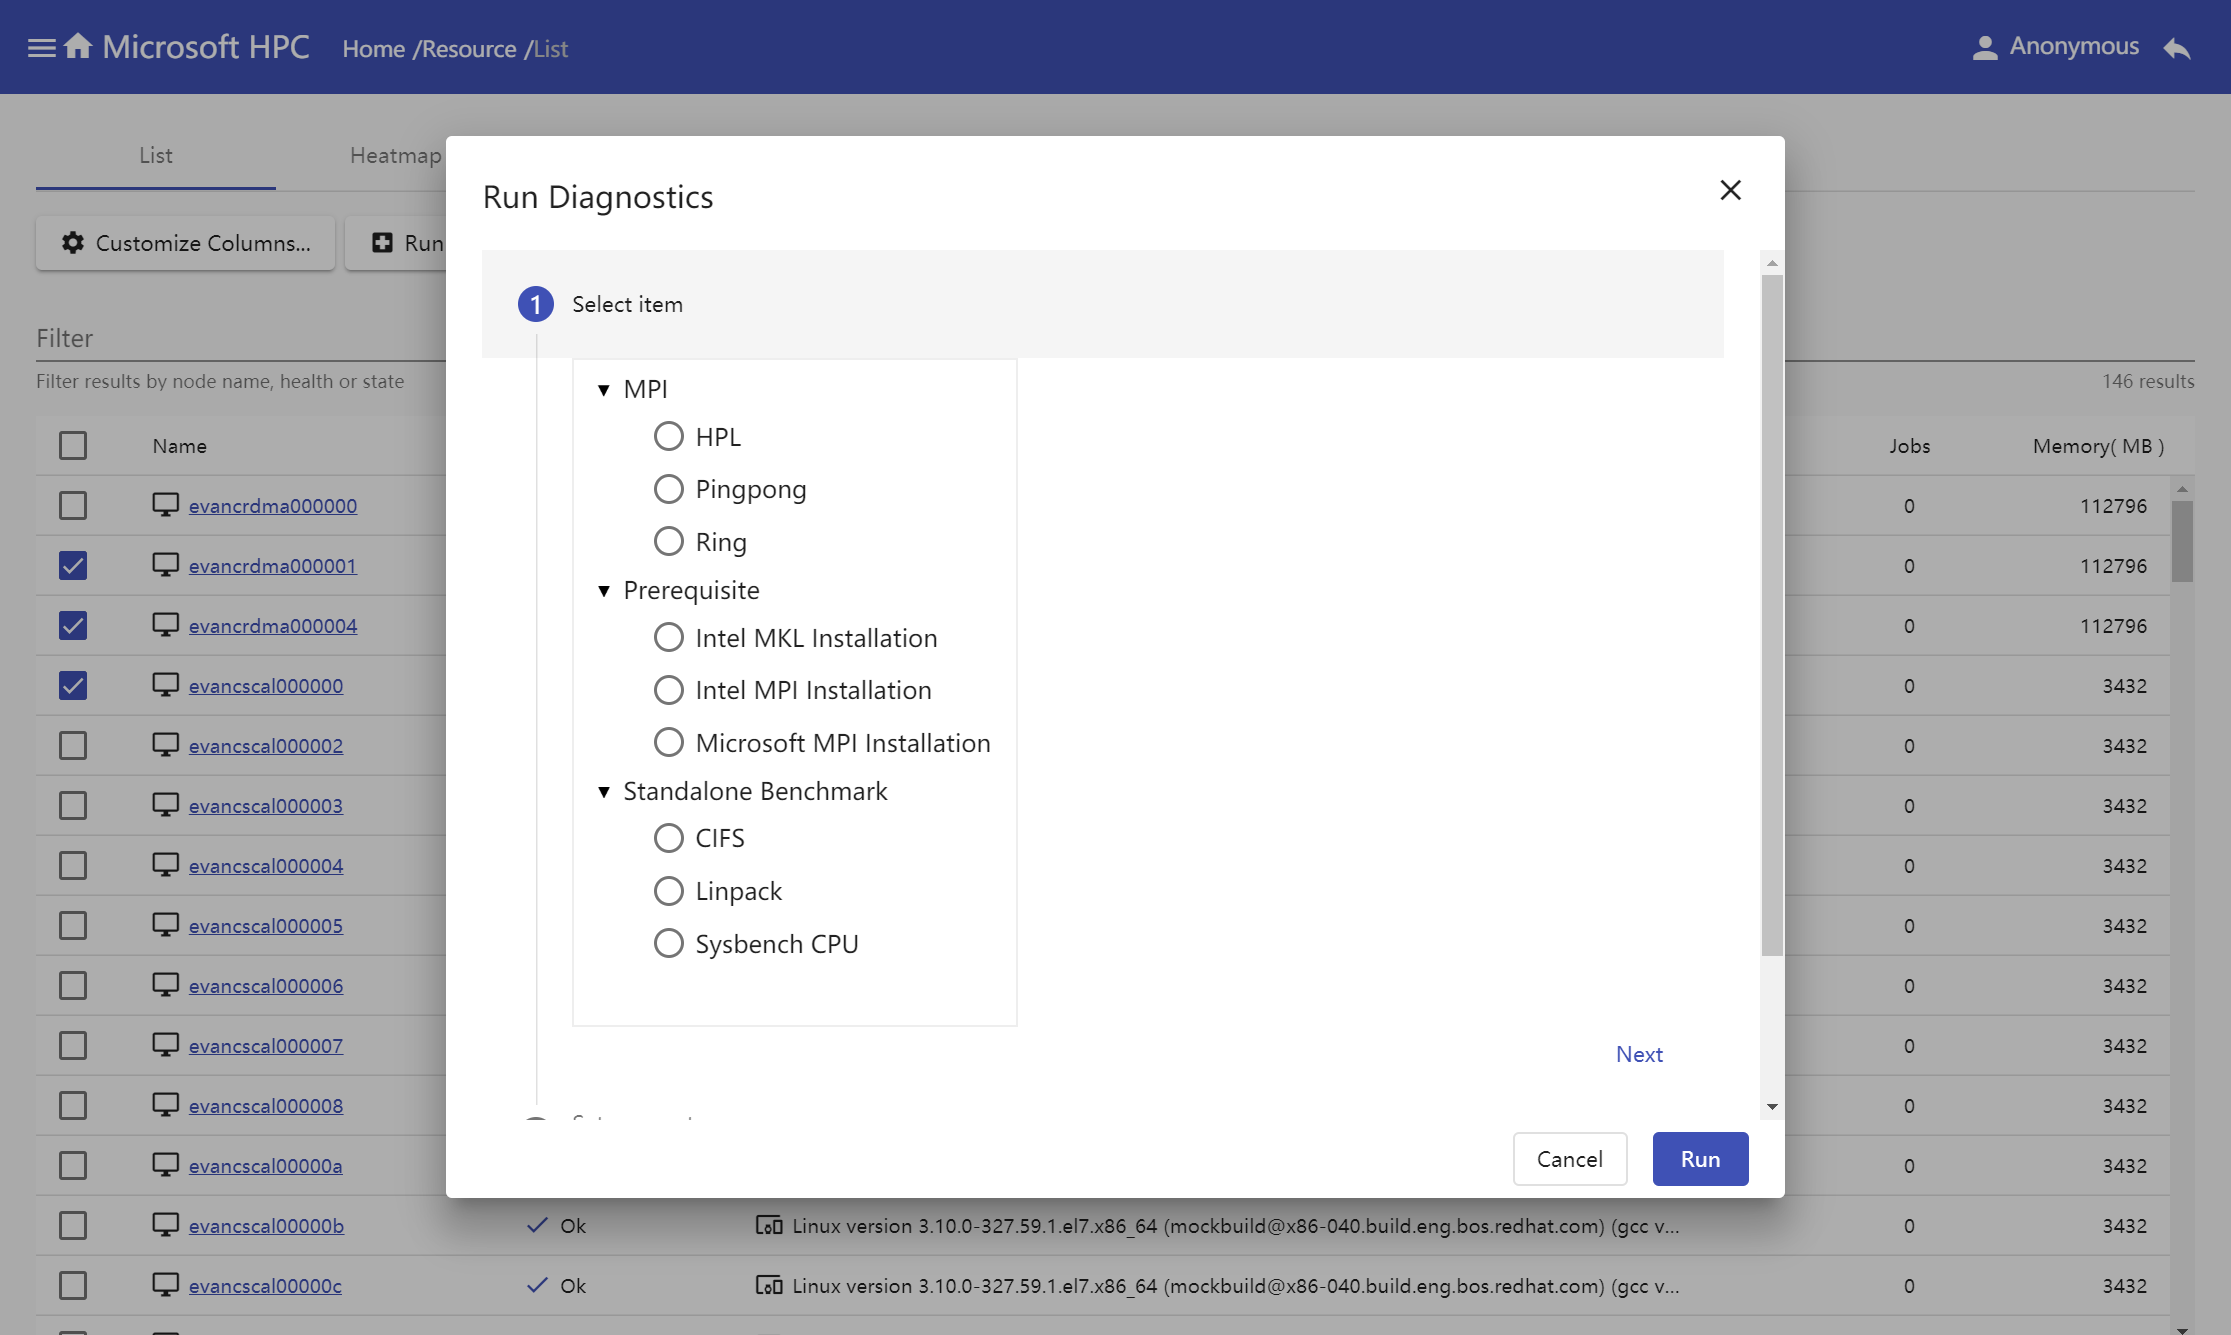
How to use portal to run diagnostic tests
Select nodes in resource table and click 'Run Diagnostics' button.
Select test, input parameters and test name
Waiting for test result.
Diagnostic result
Every diagnostic test result can be divided into two parts, overview and tasks. Overview mainly gives the diagnostic report, it also includes job nodes information, error message and job events. Tasks display all task information in one diagnostic job, task detail window shows task output.
Following take pingpong test for instance to view diagnostic result.
Overview
Use information in overview to understand aggregation result of test to find hidden issue.
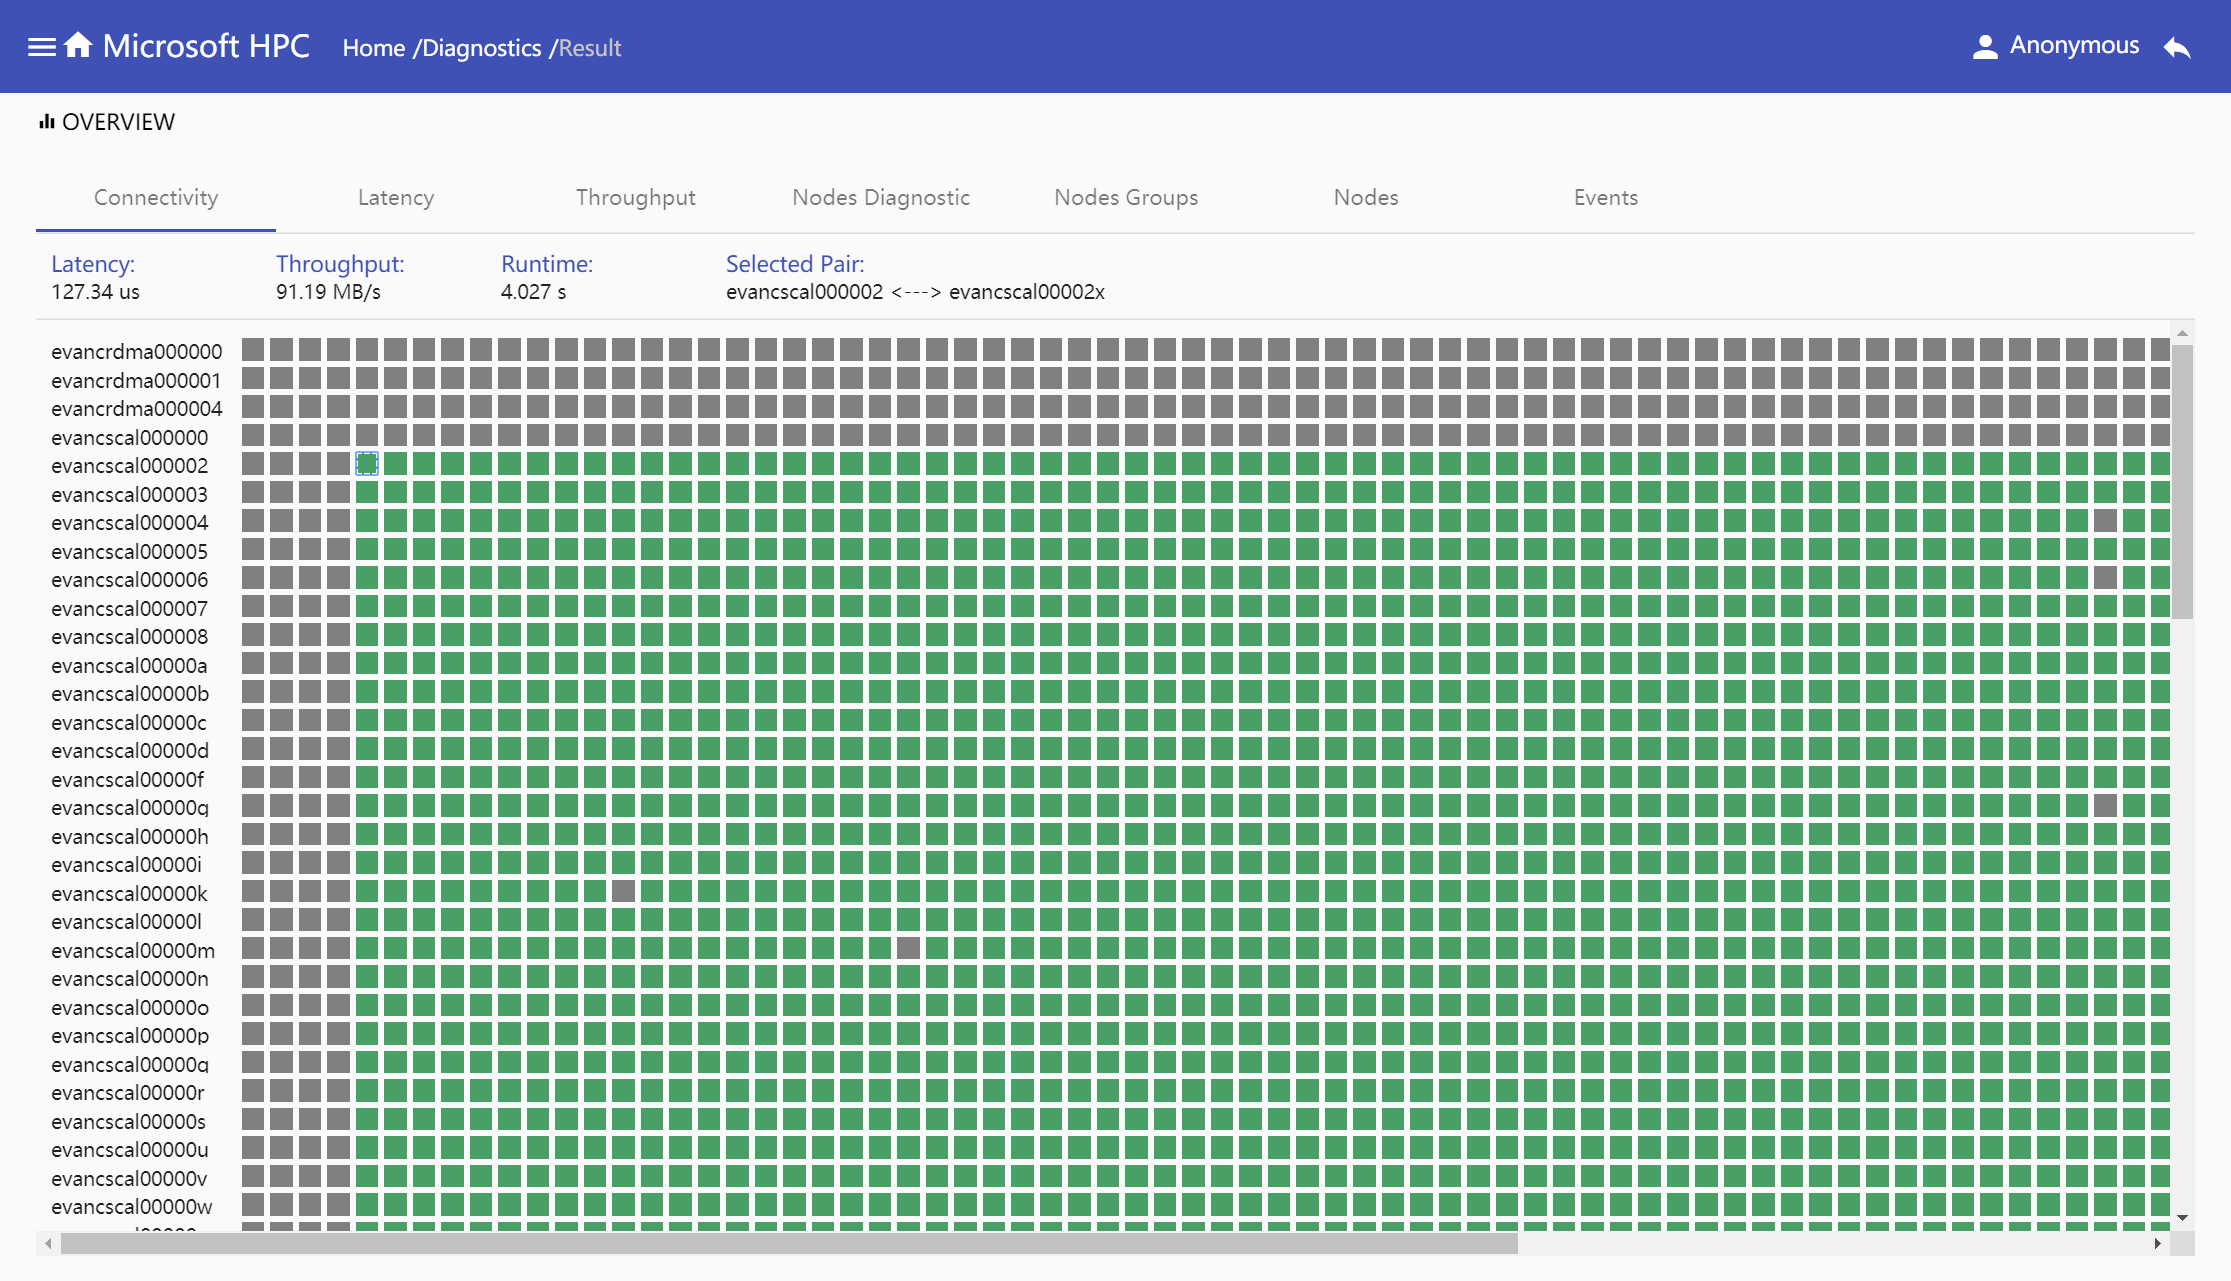
Connectivity: Connectivity shows the results of running MPI Pingpong in node pairs, including latency, throughput and runtime for each of them.
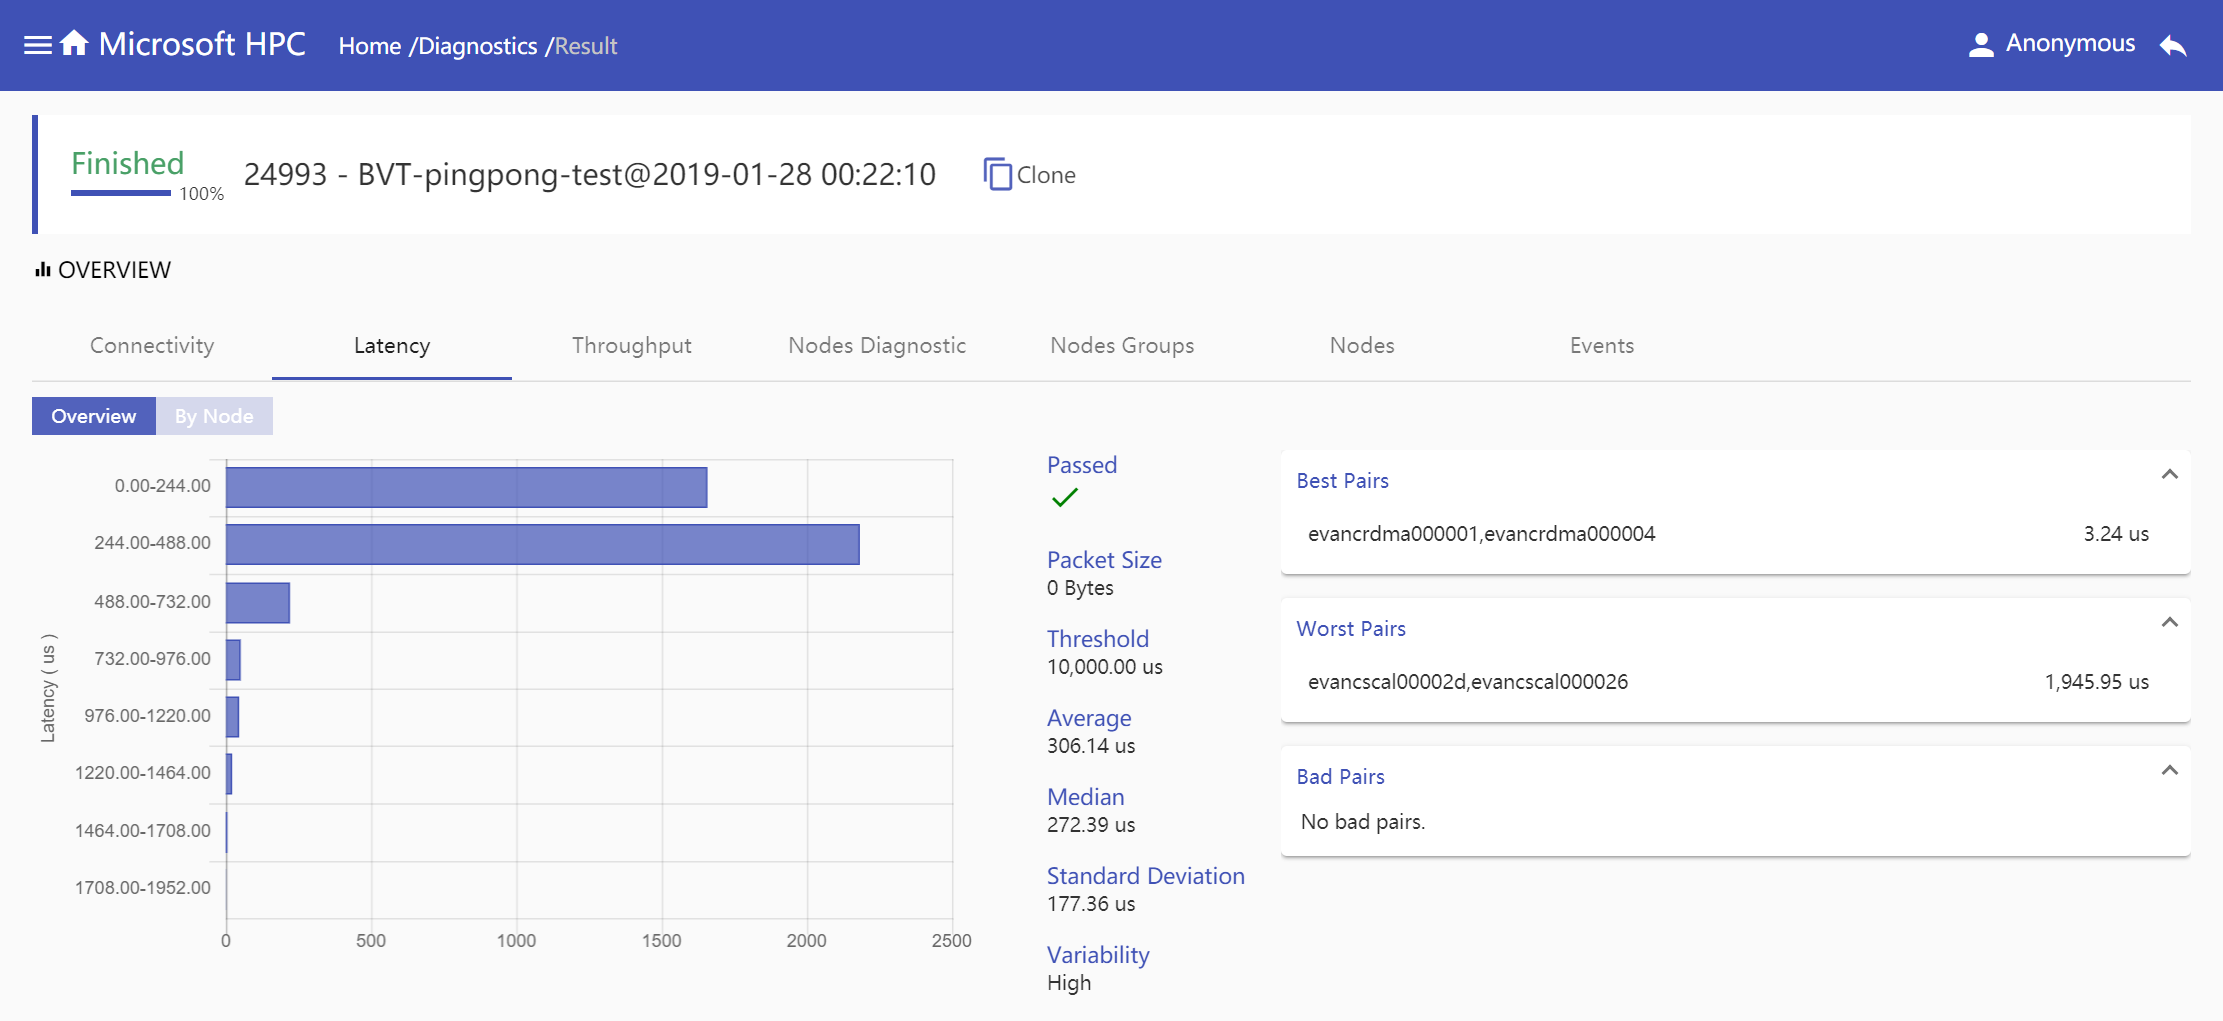
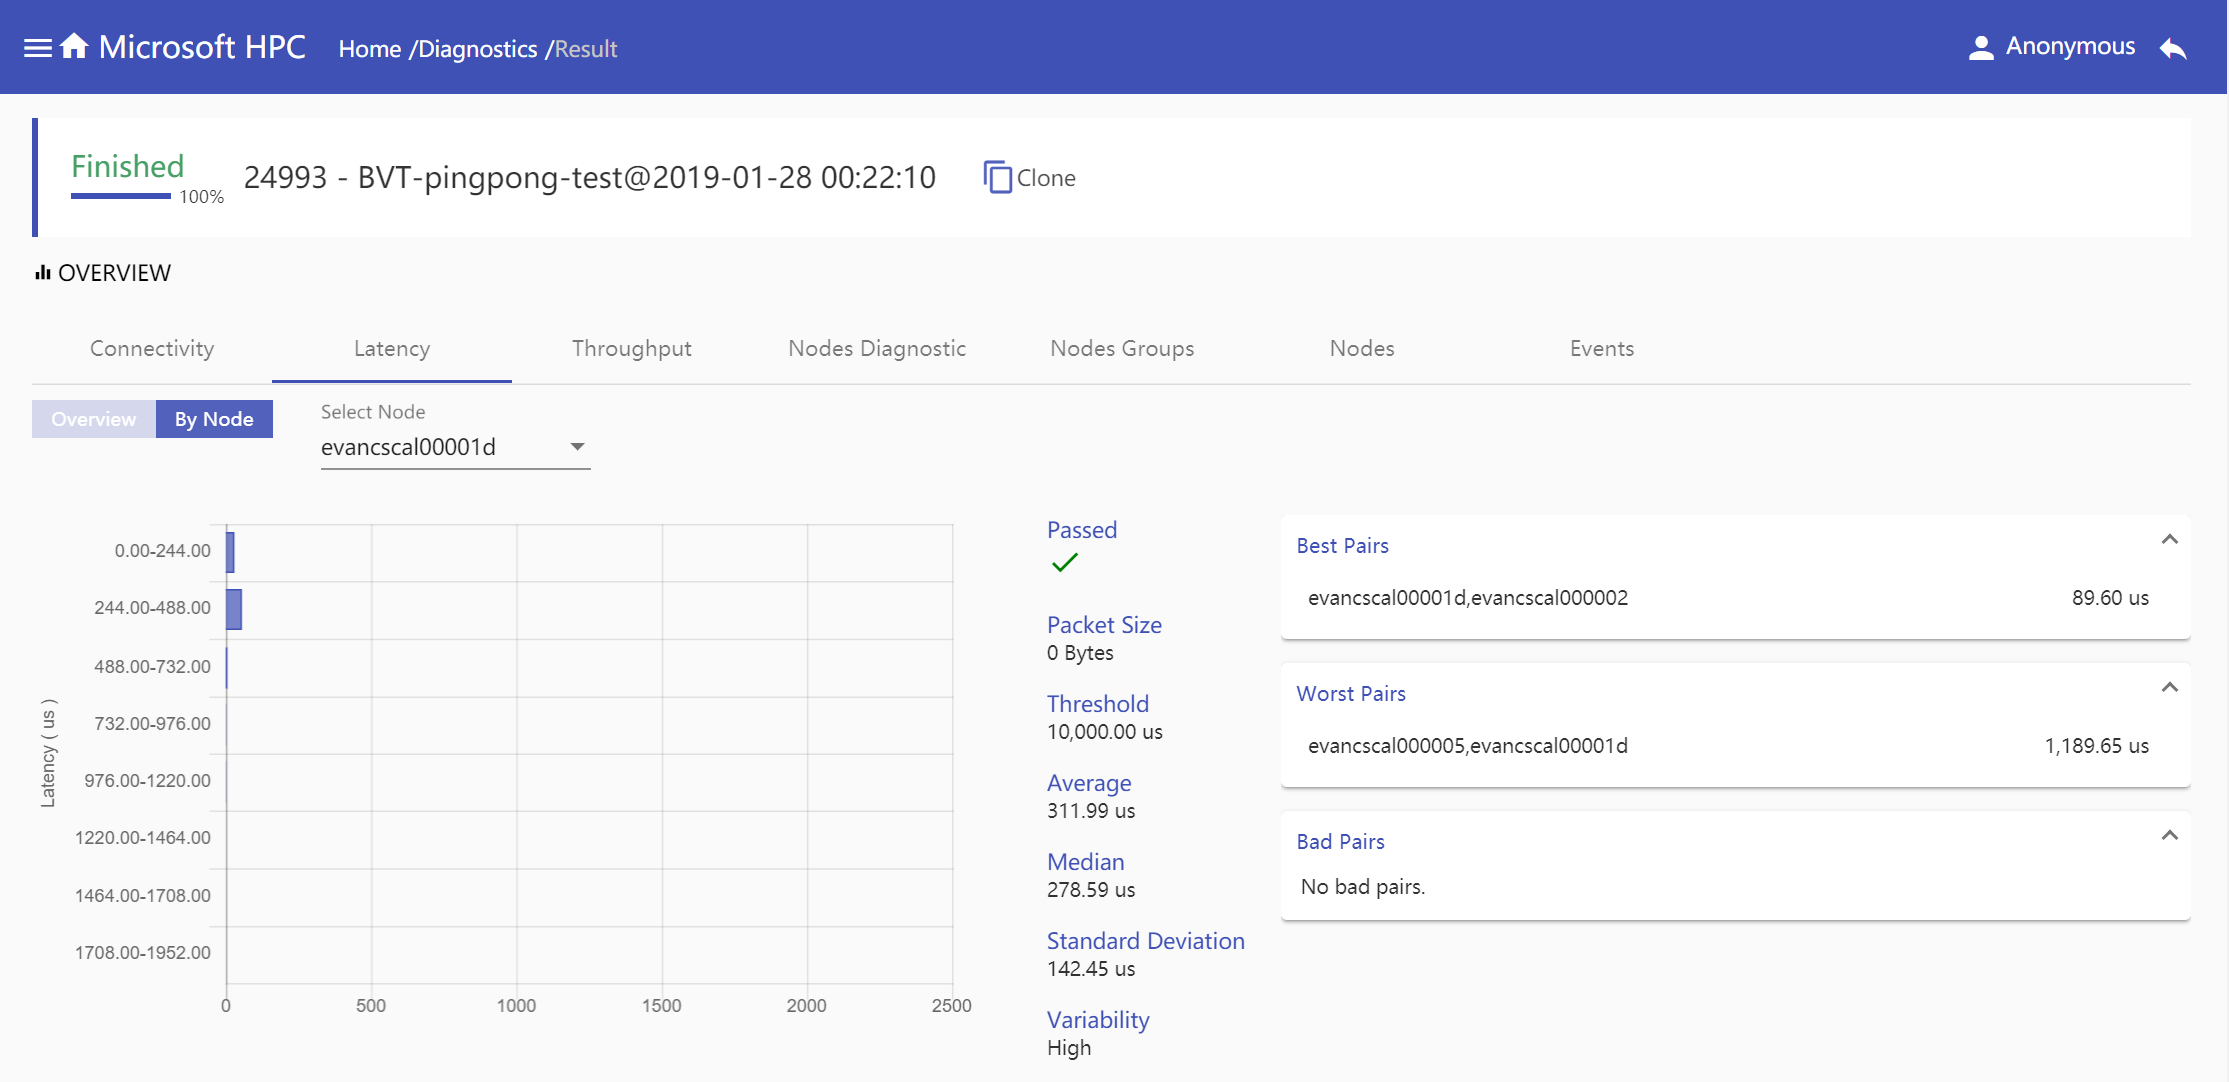
Latency: Latency information is given in two modes, overview mode shows all node pairs latency information in one diagnostic job and node mode shows specified node pairs latency information which selected node connects with. Both modes show latency range in histogram by node pairs number, show detail latency report information includes
Passed,Packet Size,Threshold,Average,Median,Standard DeviationandVariability, show pairs information based onBest Pairs,Worst PairsandBad Pairs.Overview Mode
Node Mode
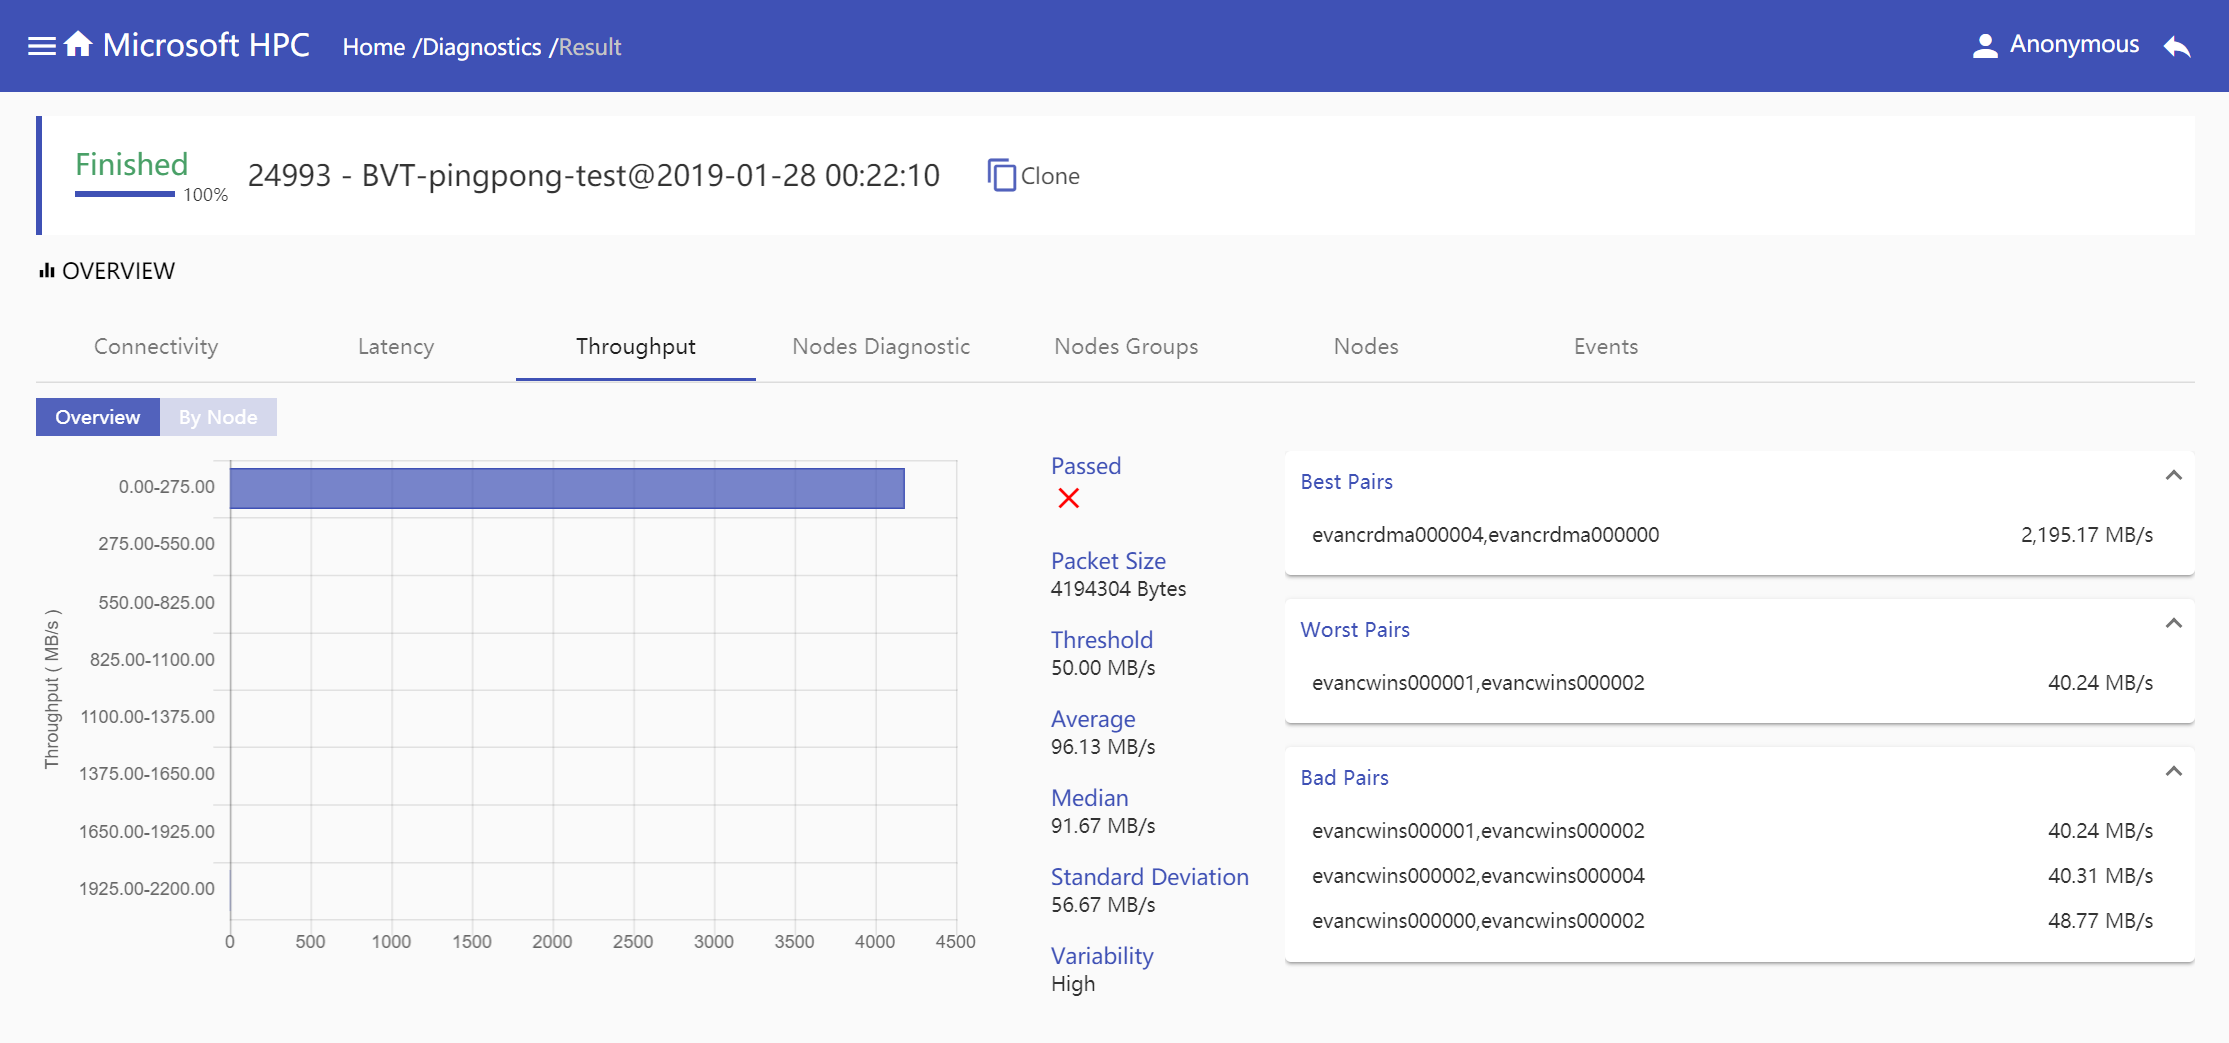
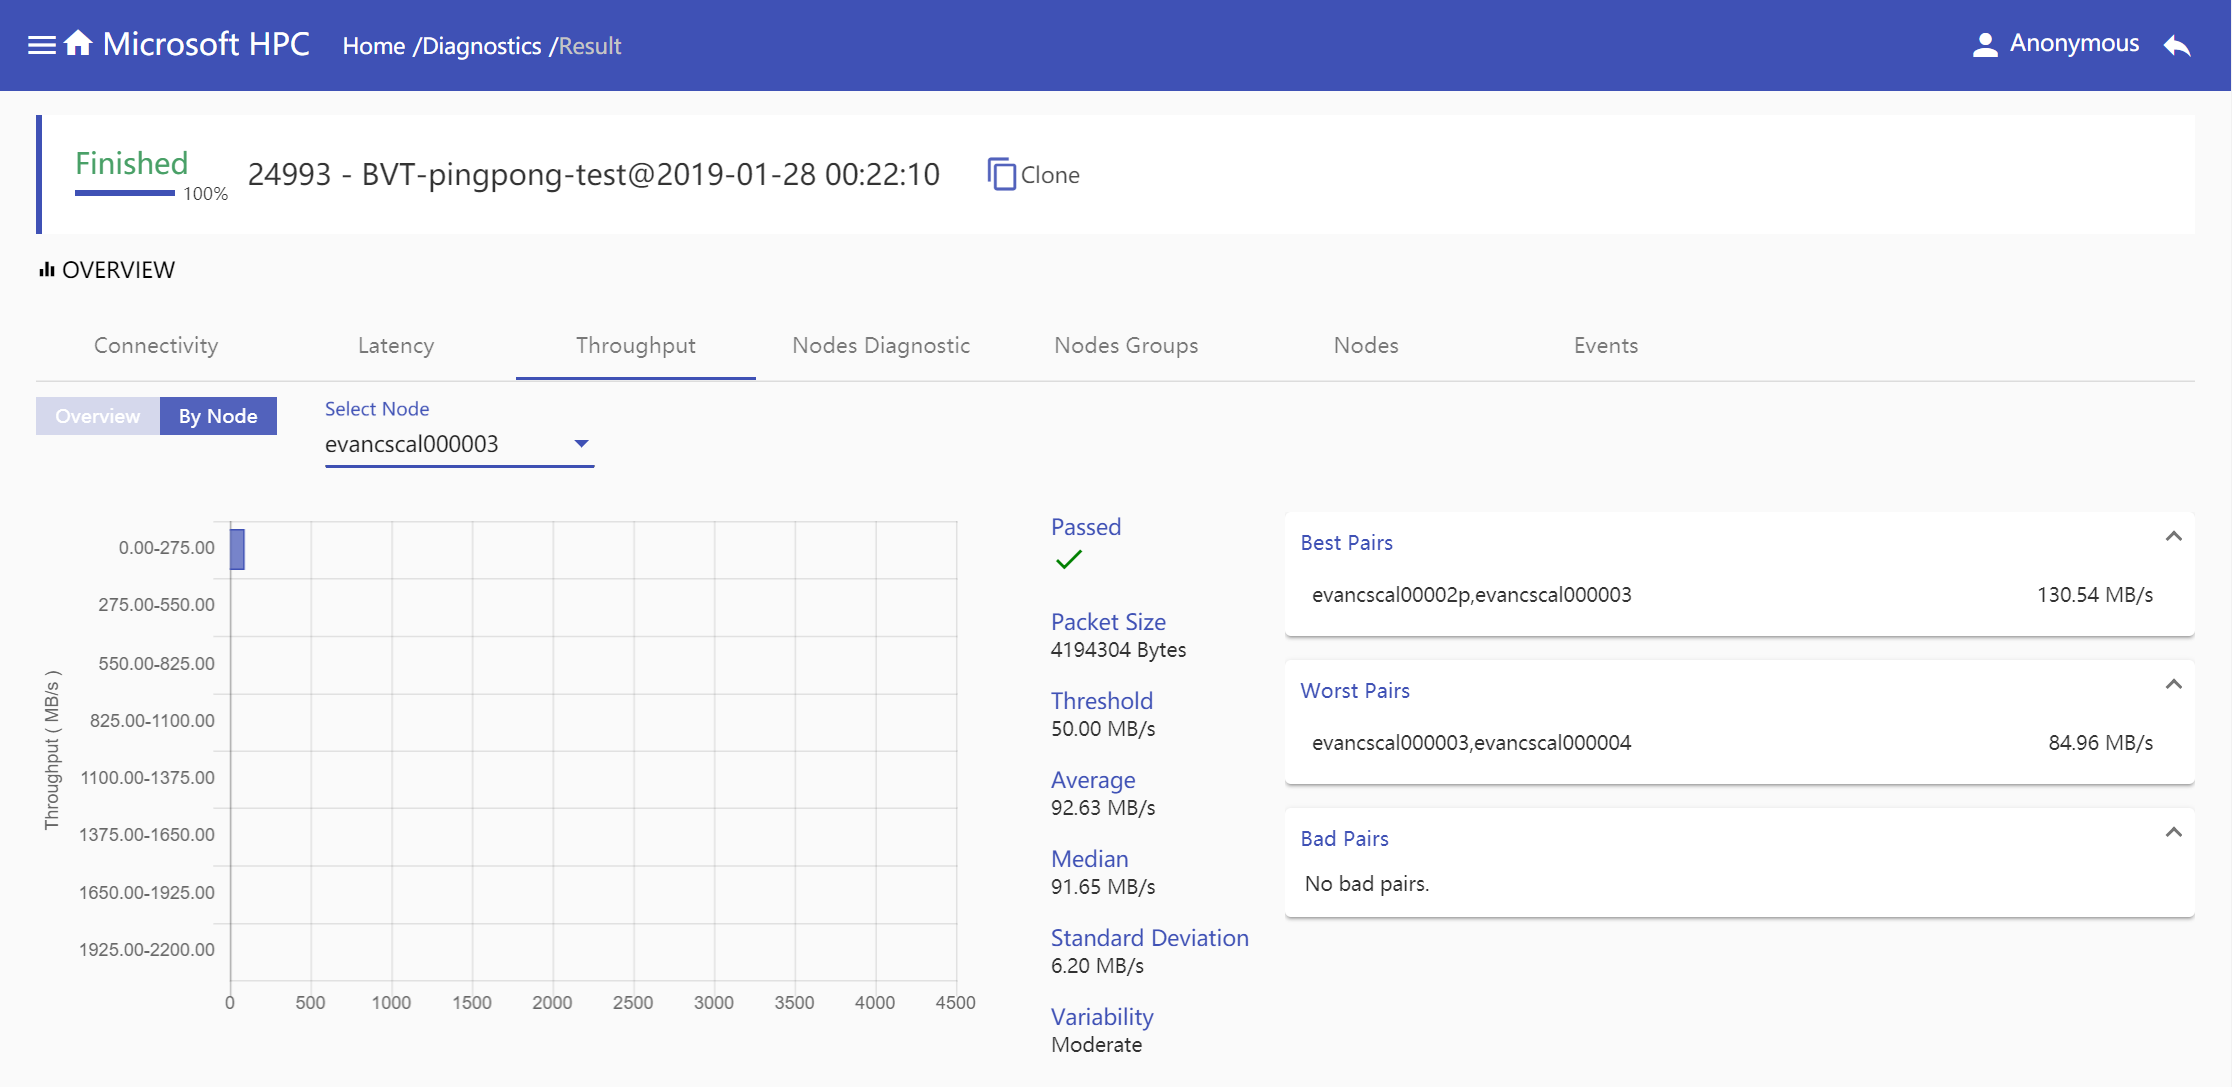
Throughput: Throughput information is given in two modes, overview mode shows all node pairs throughput information in one diagnostic job and node mode shows specified node pairs throughput information which selected node connects with. Both modes show throughput range in histogram by node pairs number, show detail throughput report information includes
Passed,Packet Size,Threshold,Average,Median,Standard DeviationandVariability, show pairs information based onBest Pairs,Worst PairsandBad Pairs.overview mode
Node Mode
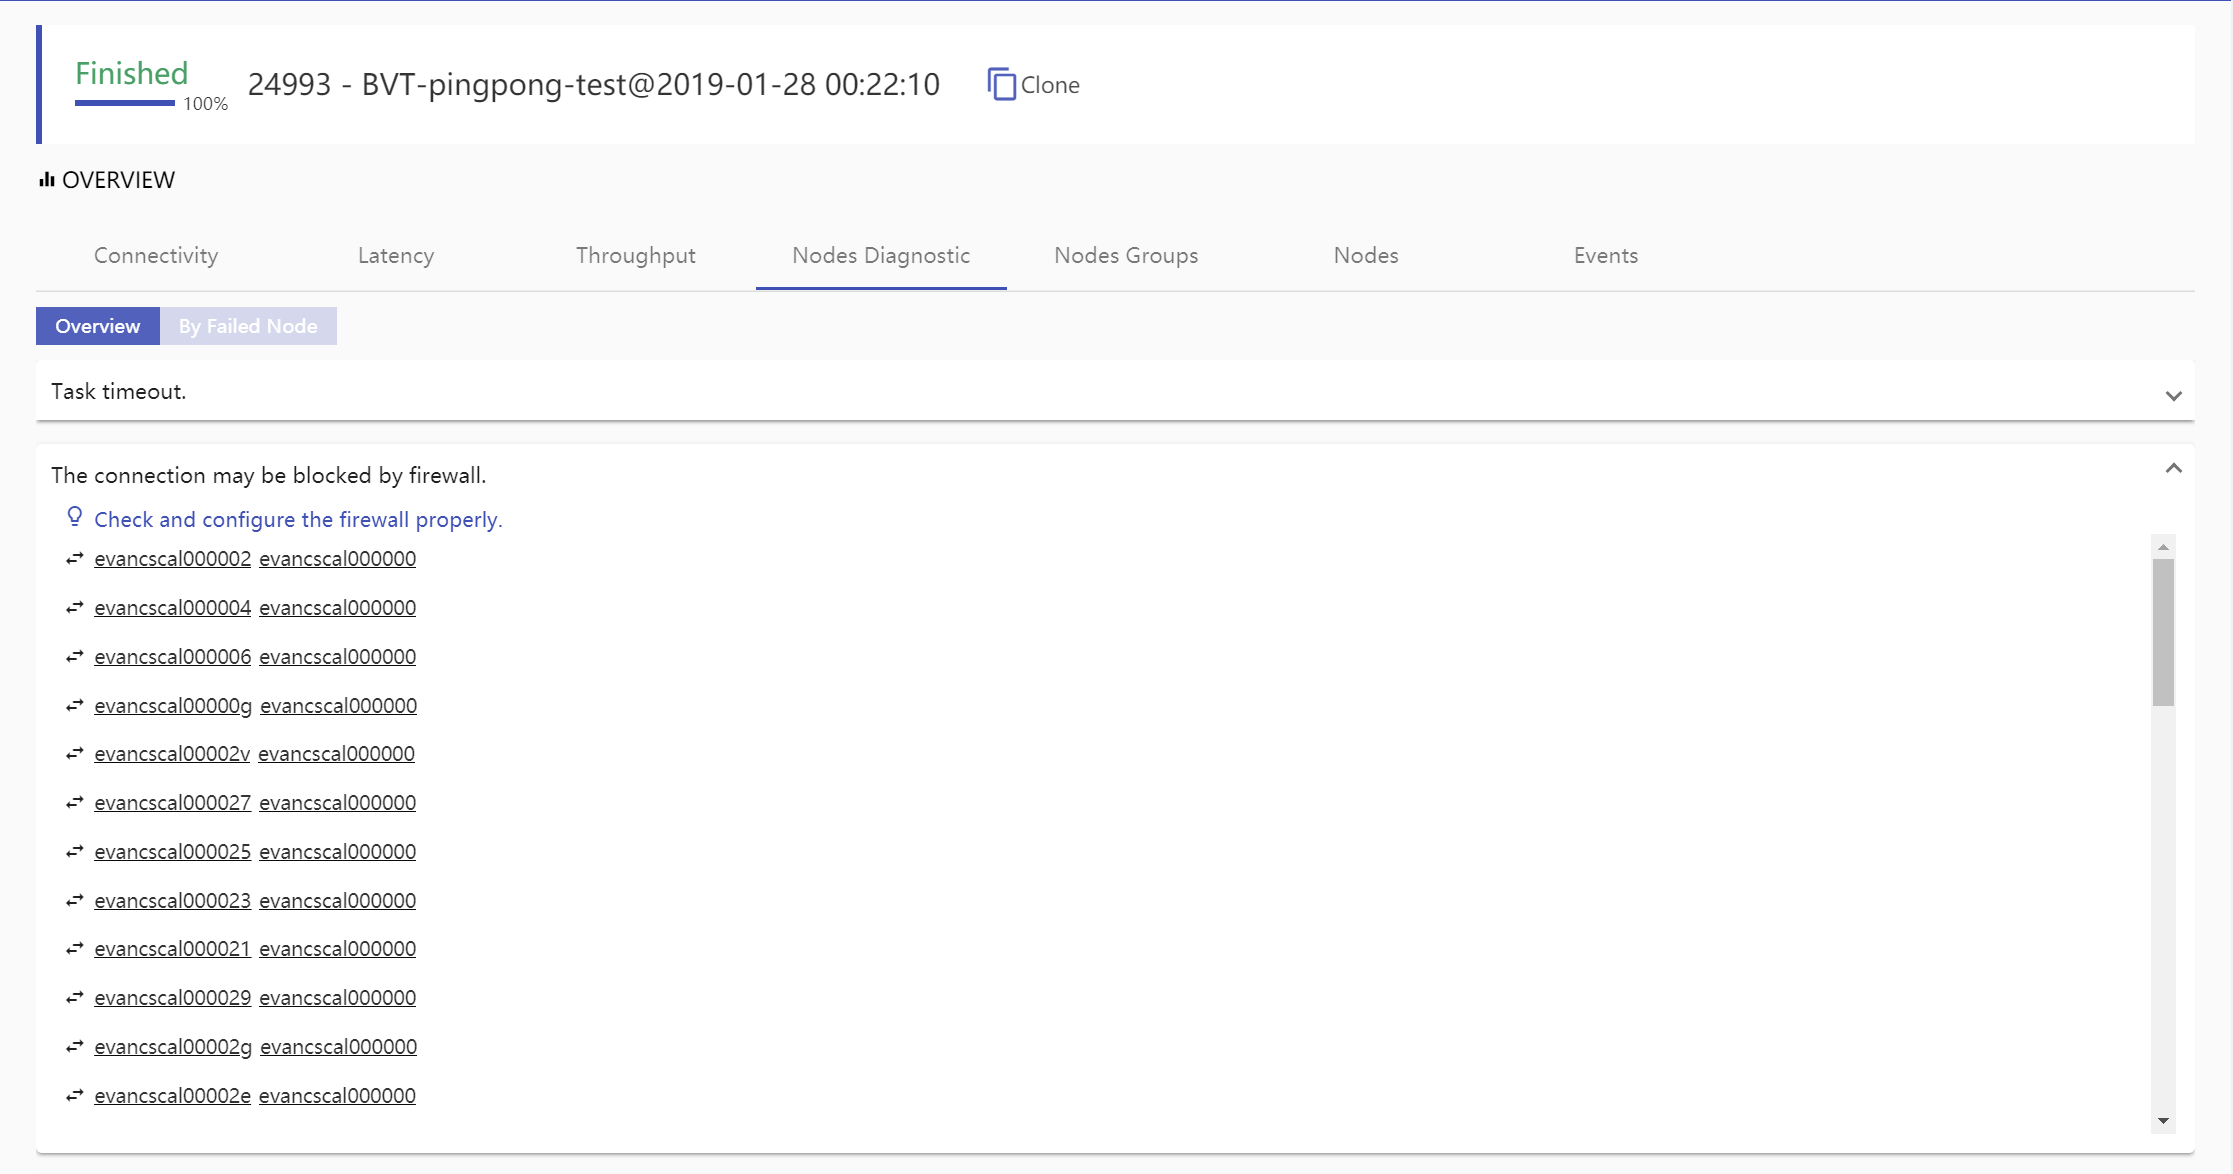
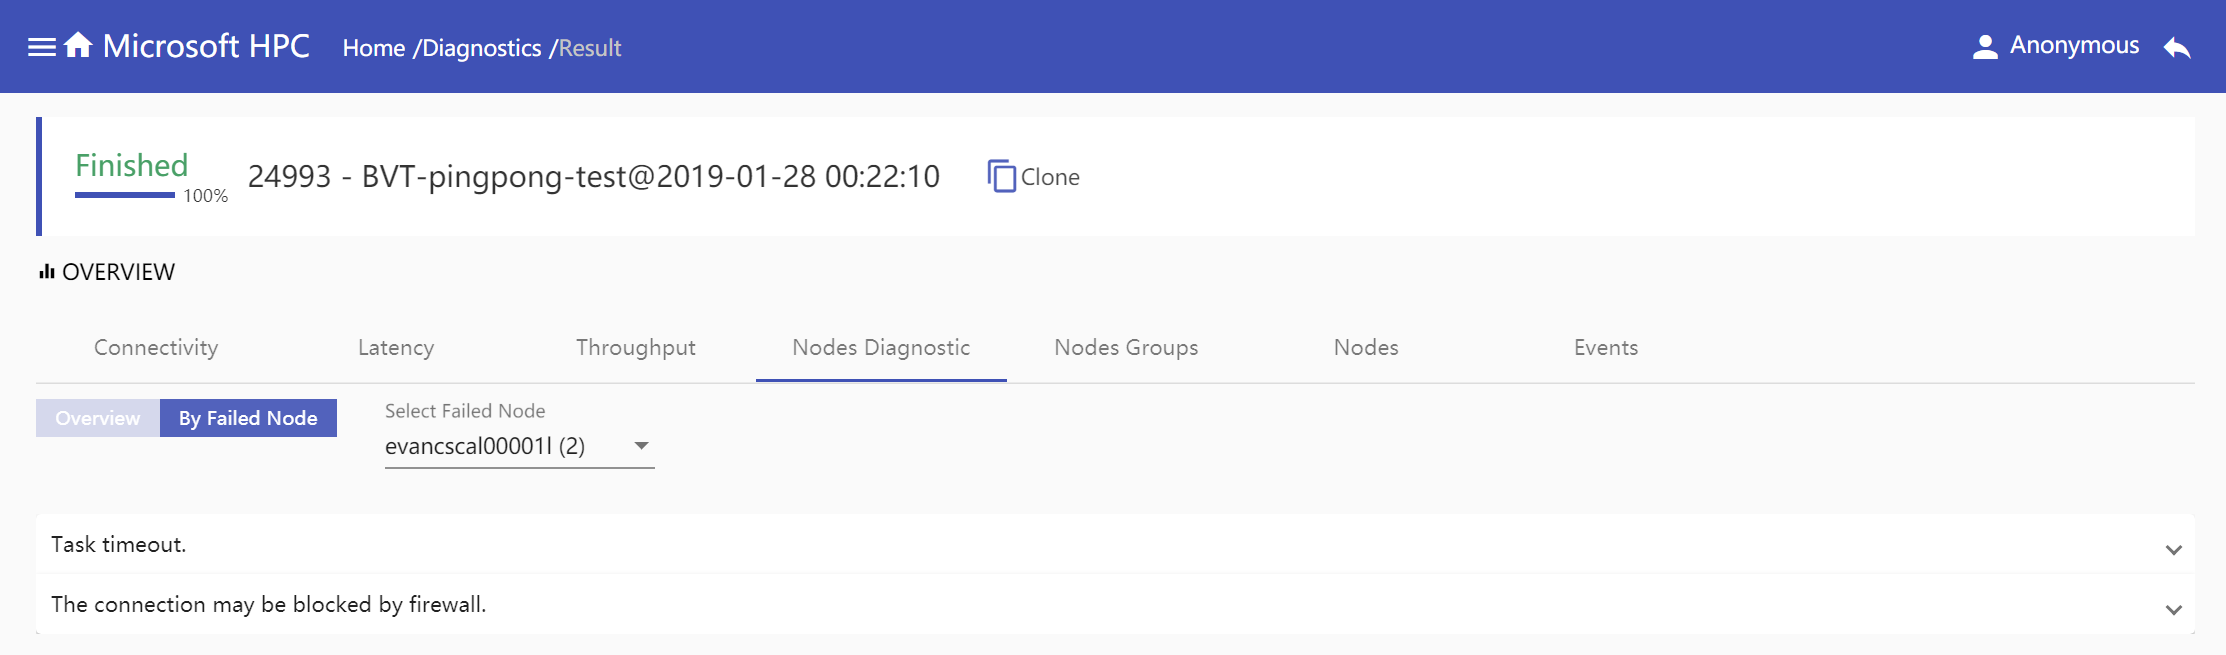
Node Diagnostic: Node diagnostic gives nodes failed reasons in two mode, overview mode and node mode. Overview mode shows all failed reasons aggregated in one diagnostic test, every failed reason may have one solution and display all involved nodes or node pairs. Node mode shows selected node failed reasons if it has.
Overview Mode
Node Mode
Nodes Groups: Show nodes groups in which nodes connect with each other and can get
pingpongtest result.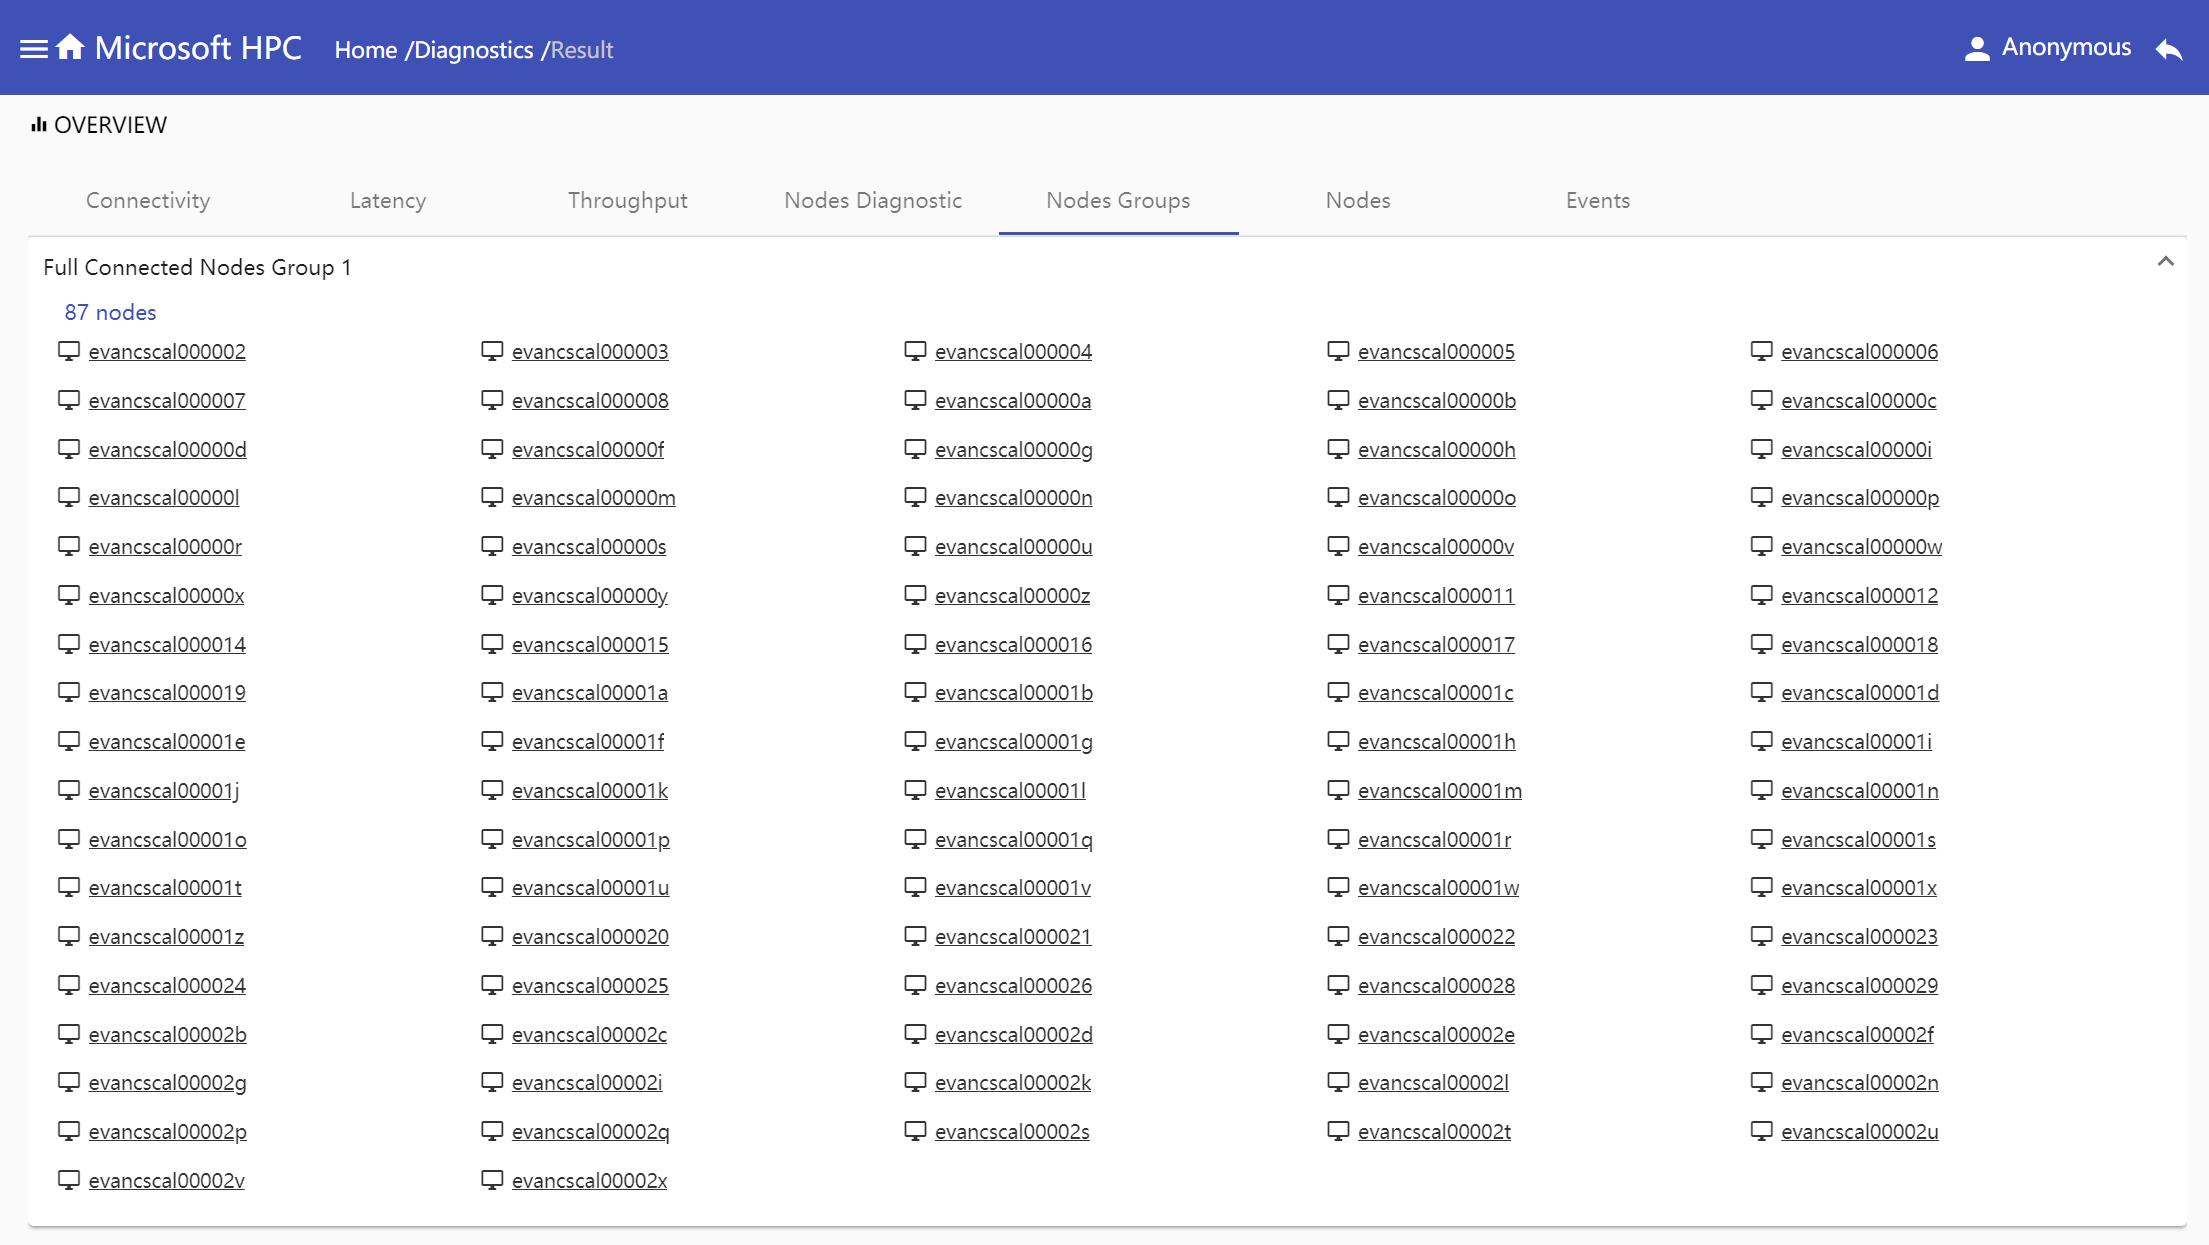
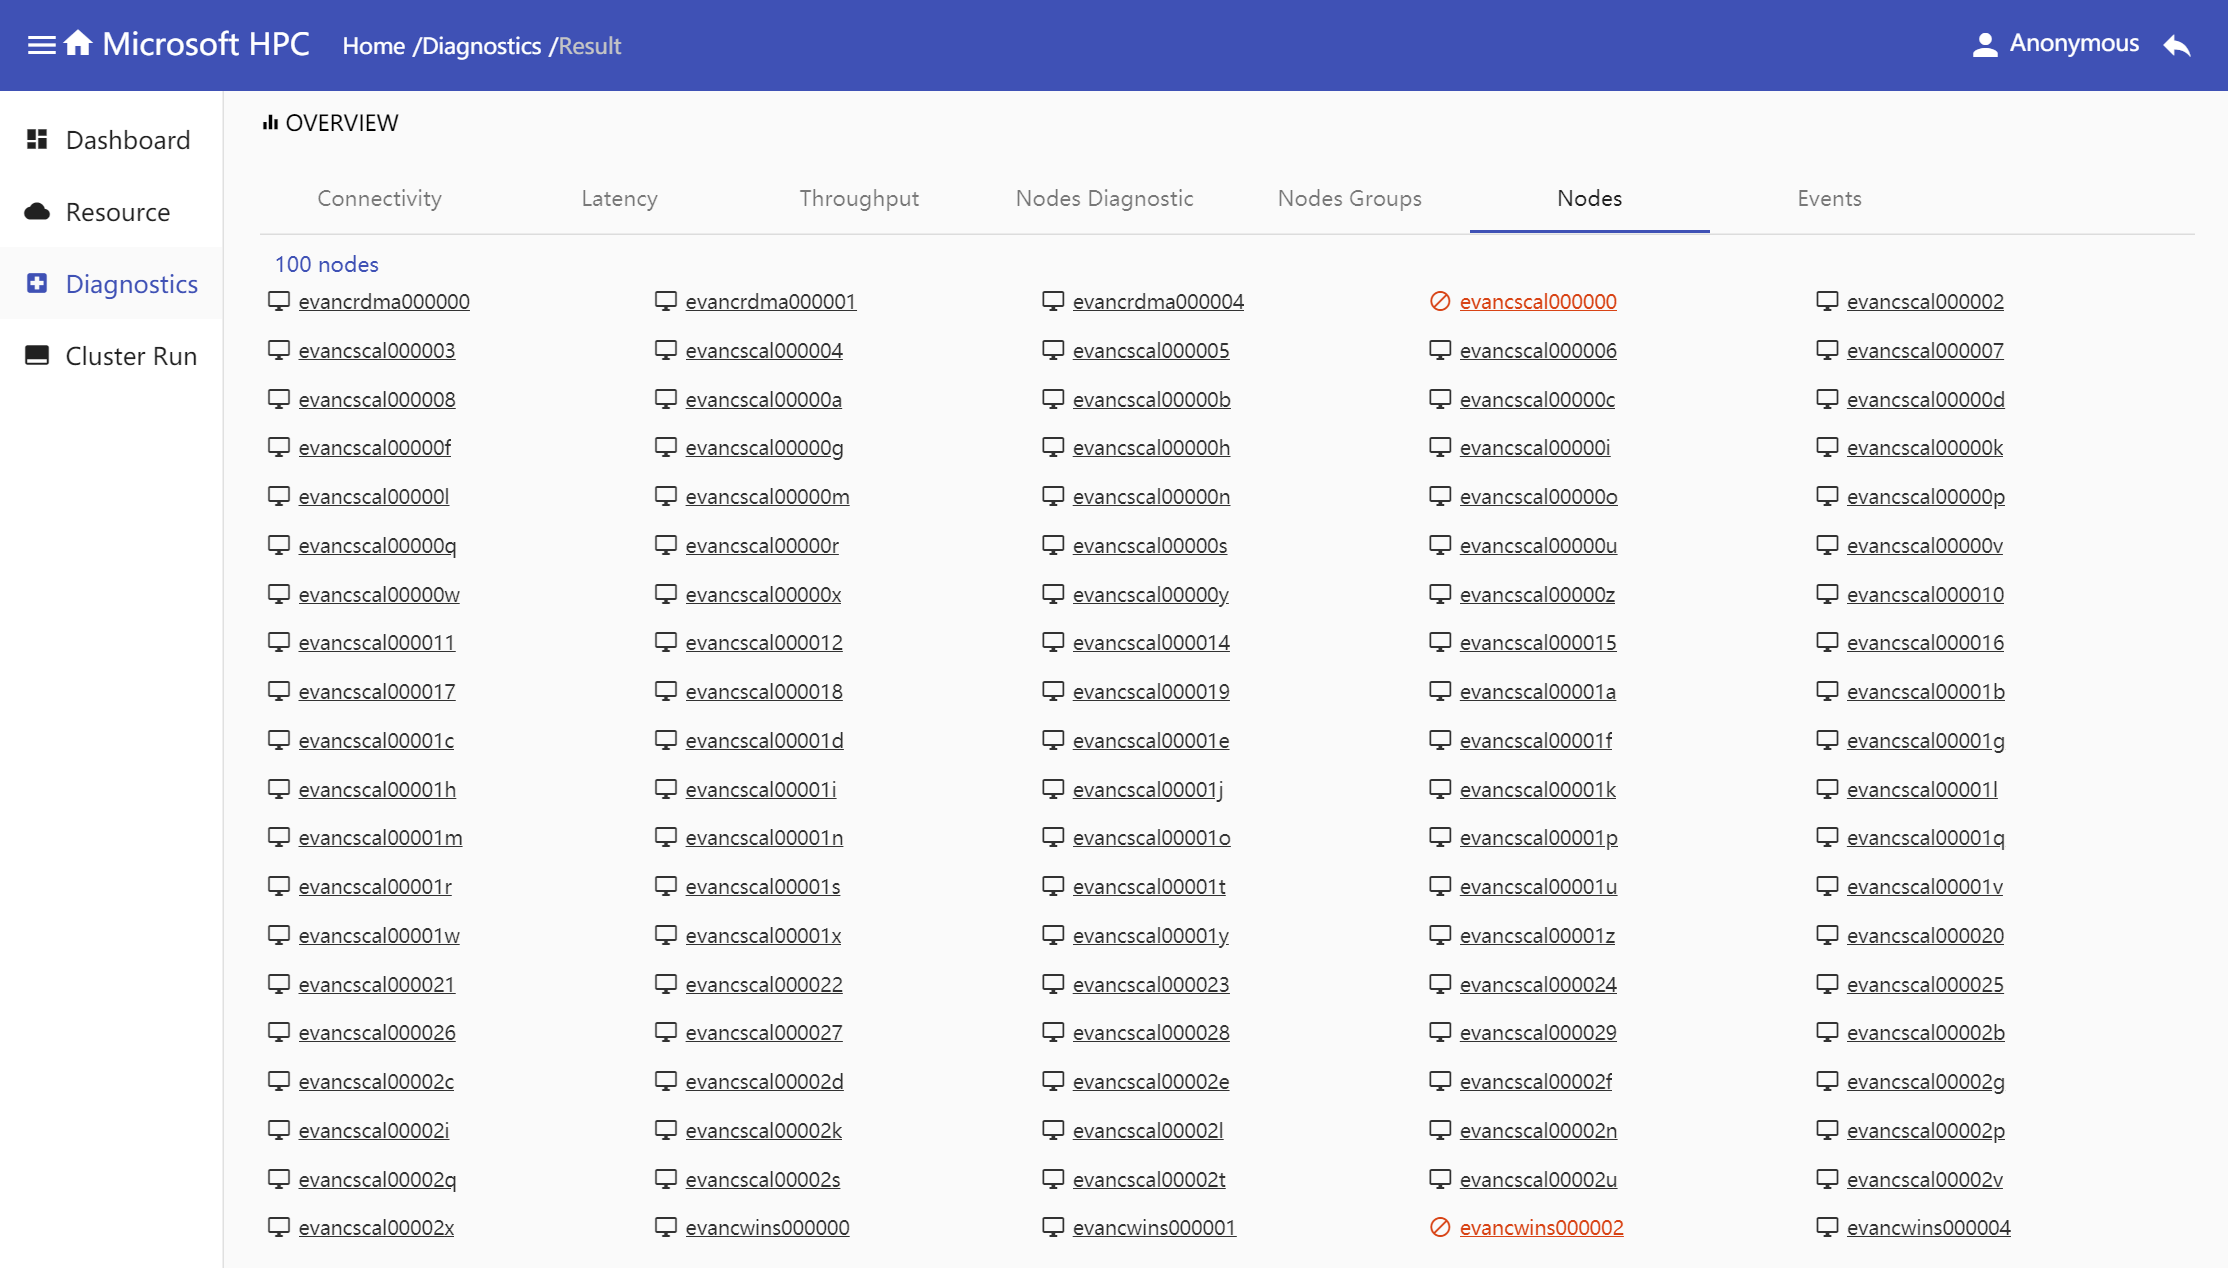
Nodes: Display all nodes which run the diagnostic test. In pingpong test, if one node is not connected with other nodes, we define this node is bad node which show in red color in nodes tab.
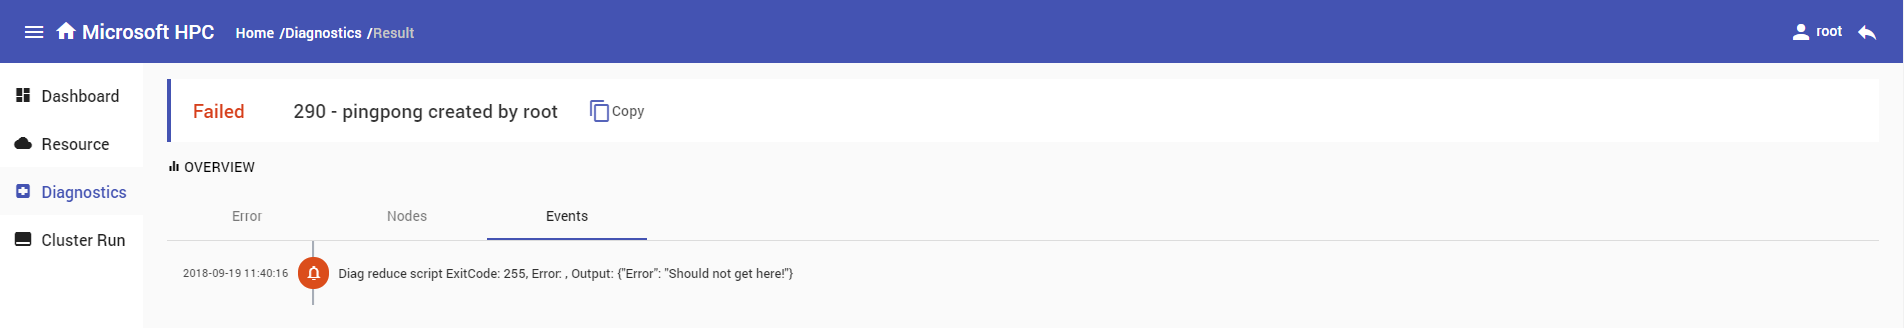
Events: Show job events during job runtime if it has.
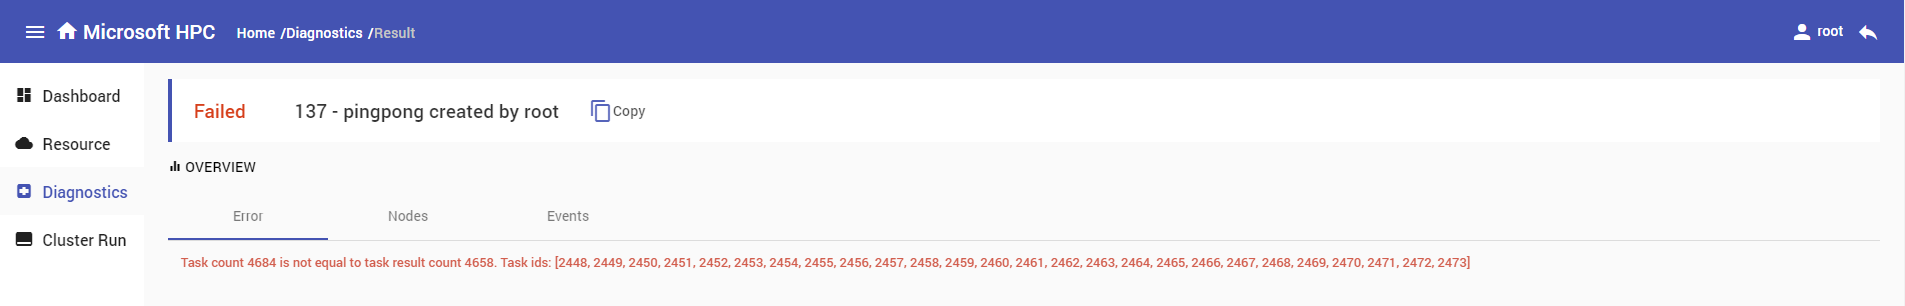
Error: If job aggregation result is not generated and error information will return.
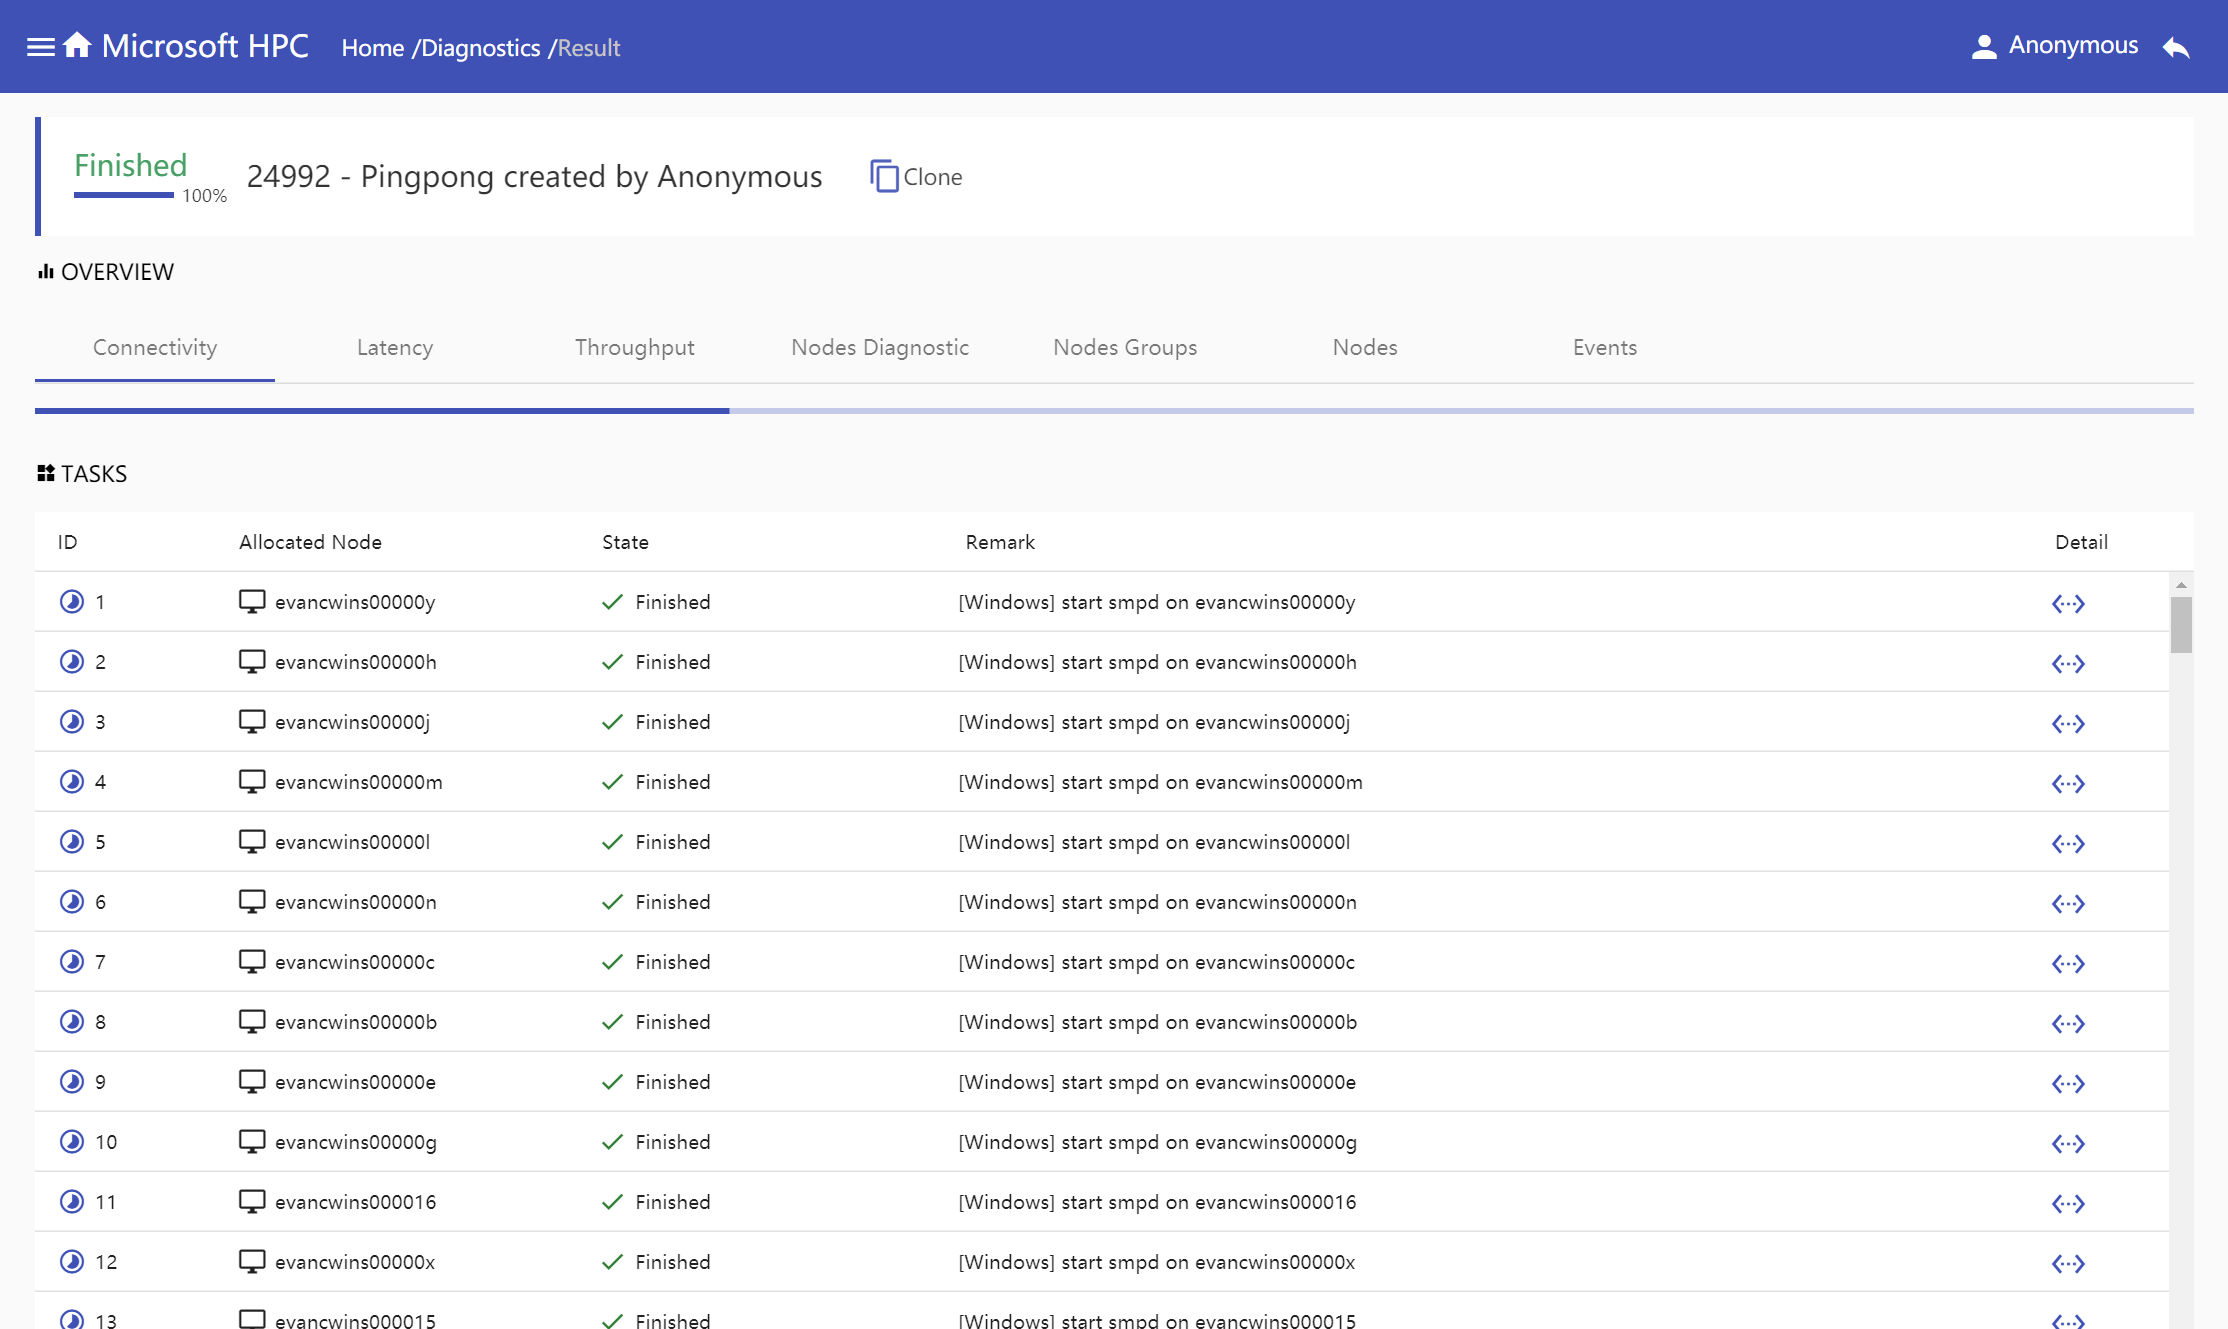
Tasks
Show all tasks in one diagnostic job in task table, which columns are task id, allocated nodes, state, remark and detail.
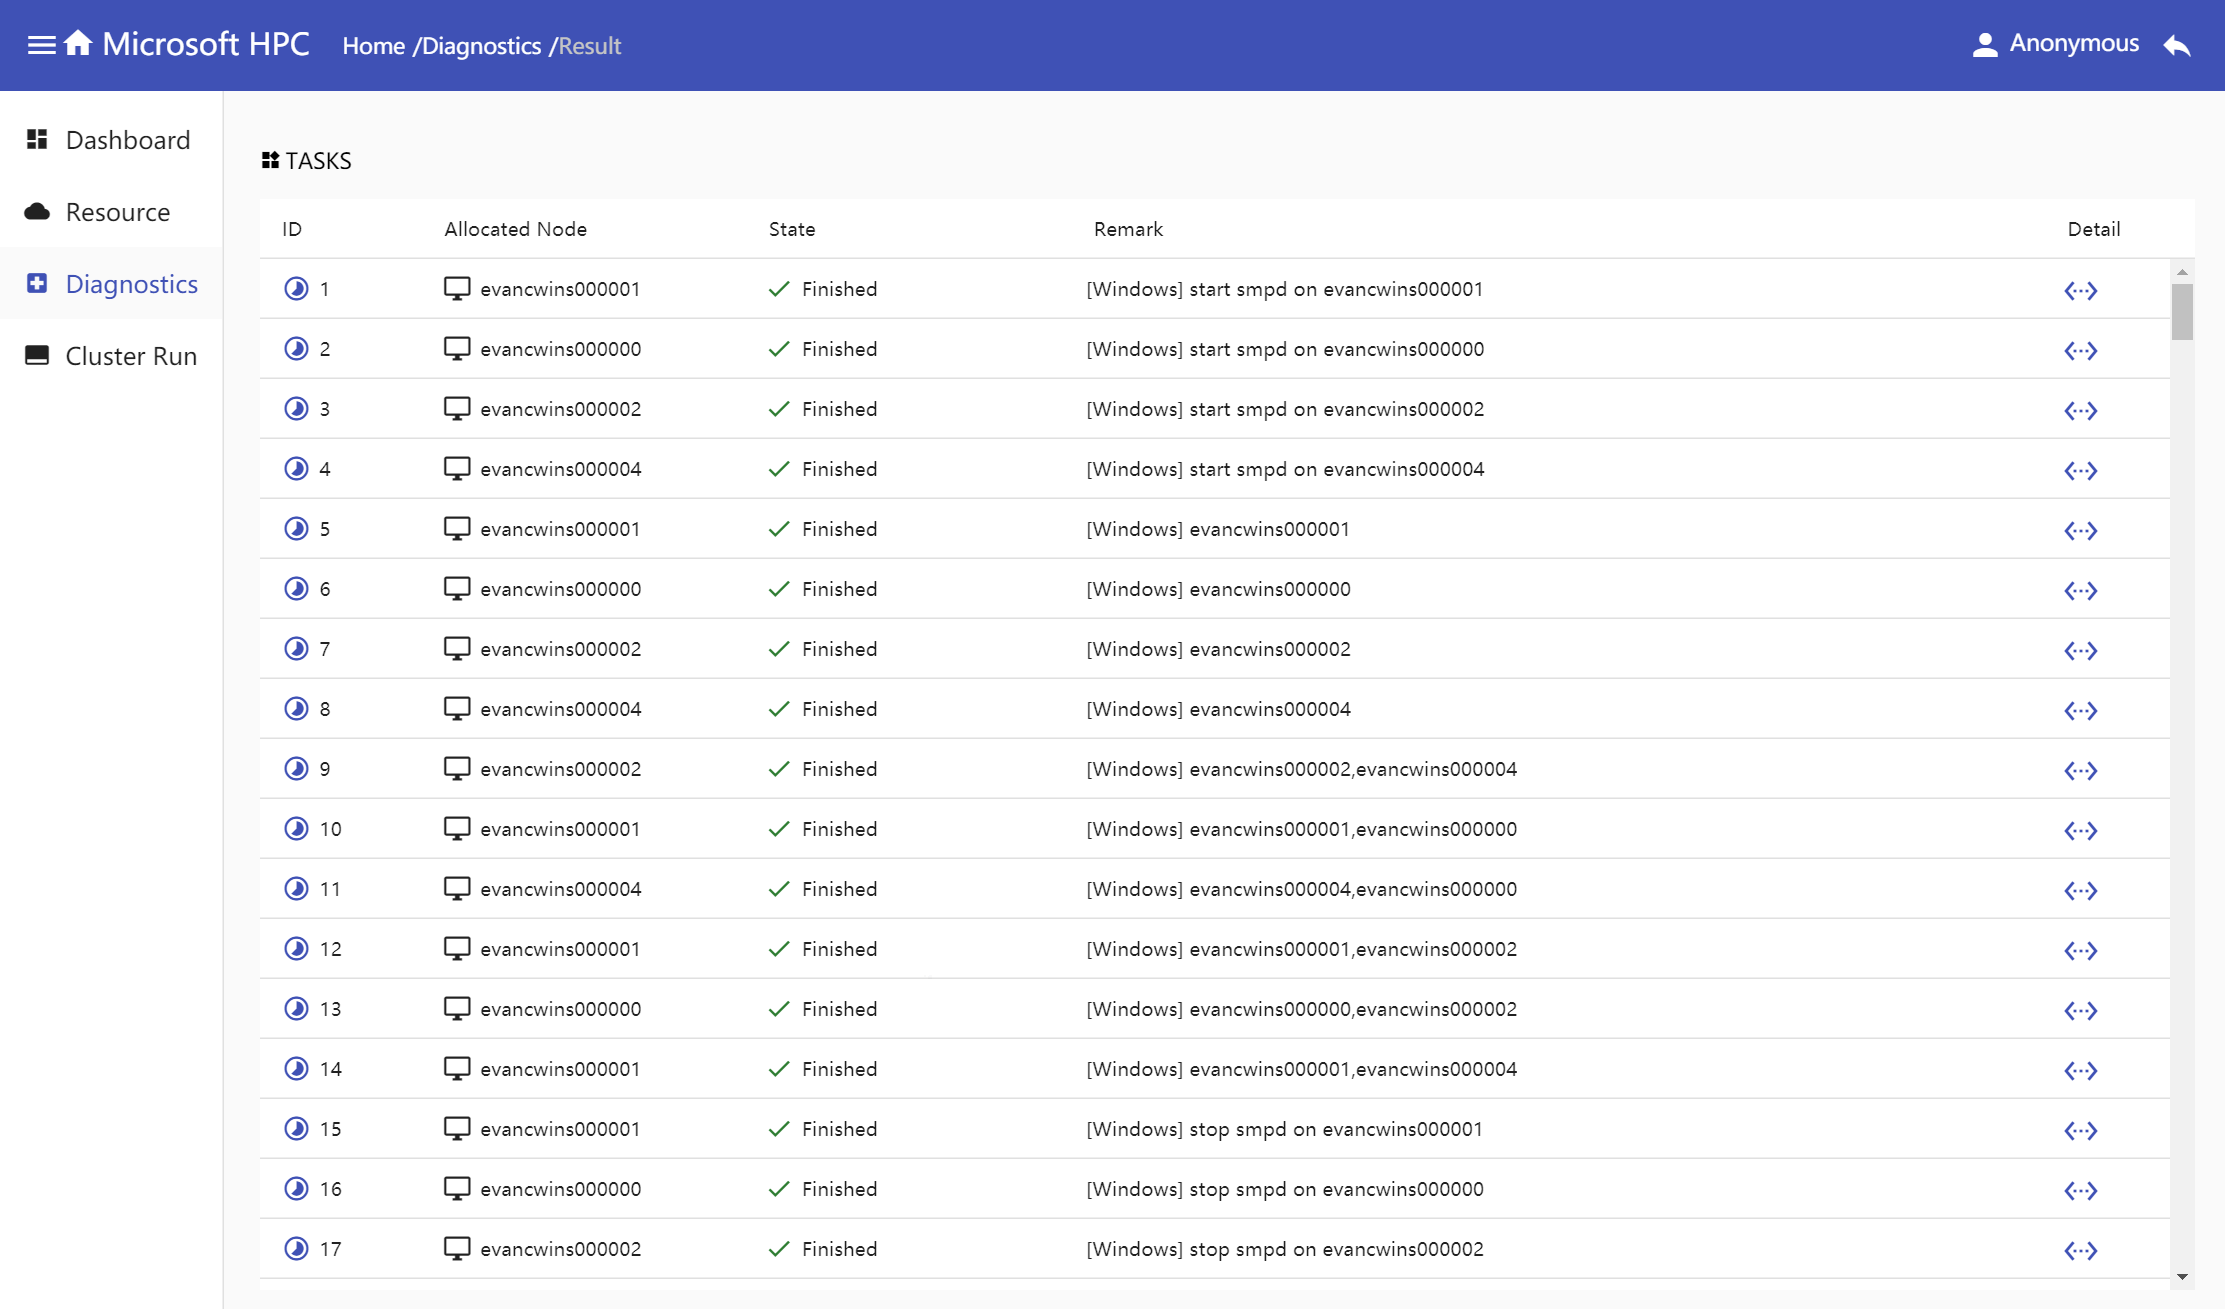
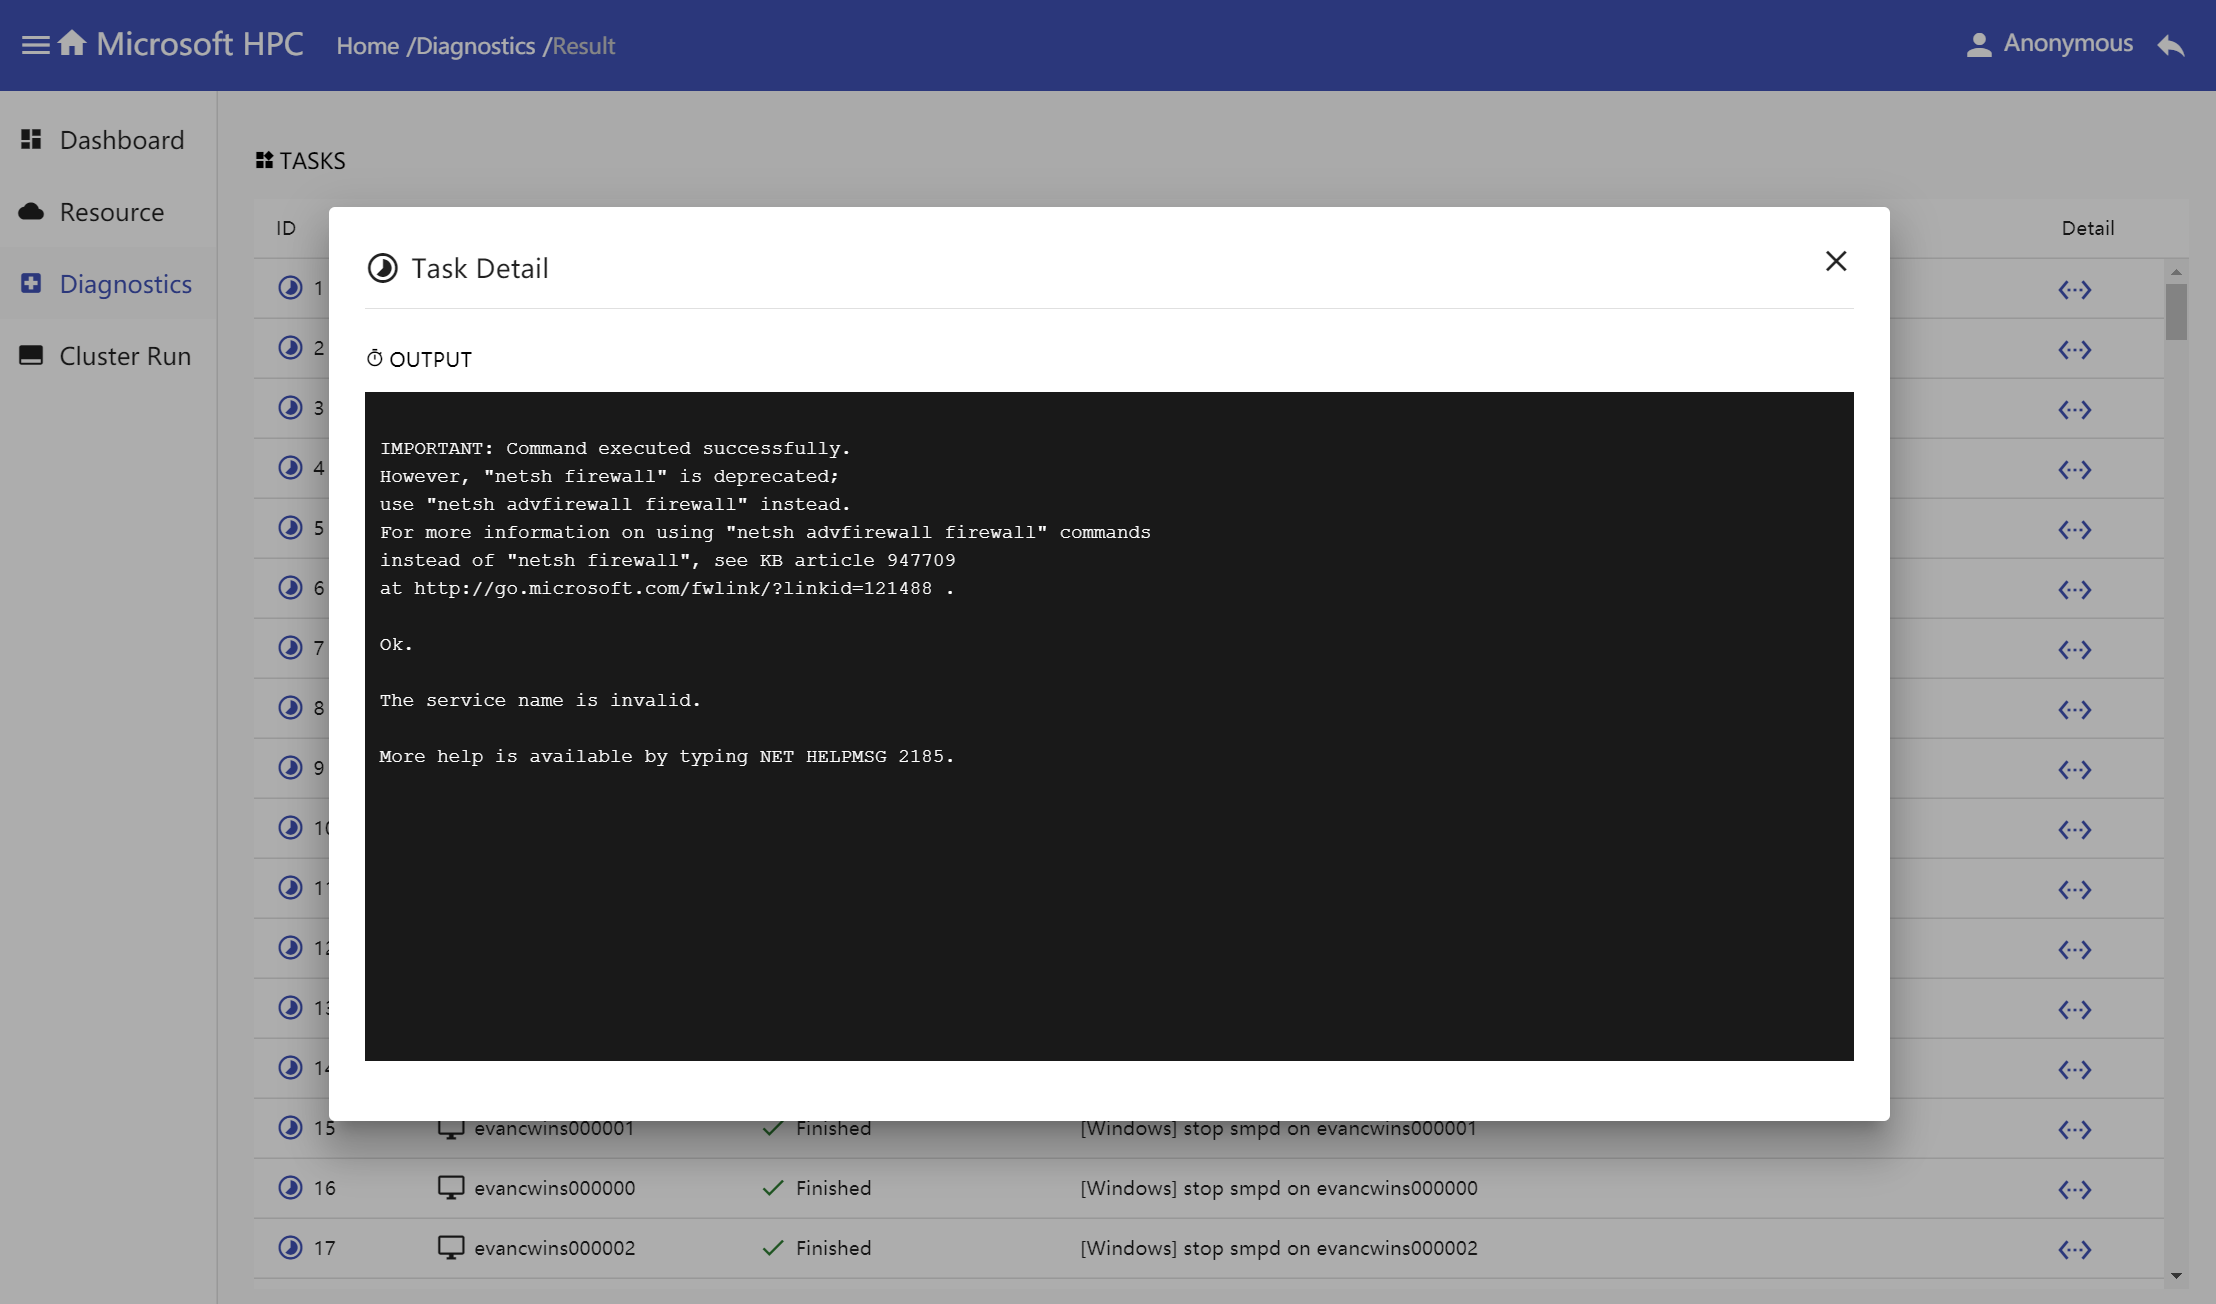
Click detail button in task table, task detail window shows task output.
Cluster Run
Run command to interact with cluster nodes and get nodes' real-time response.
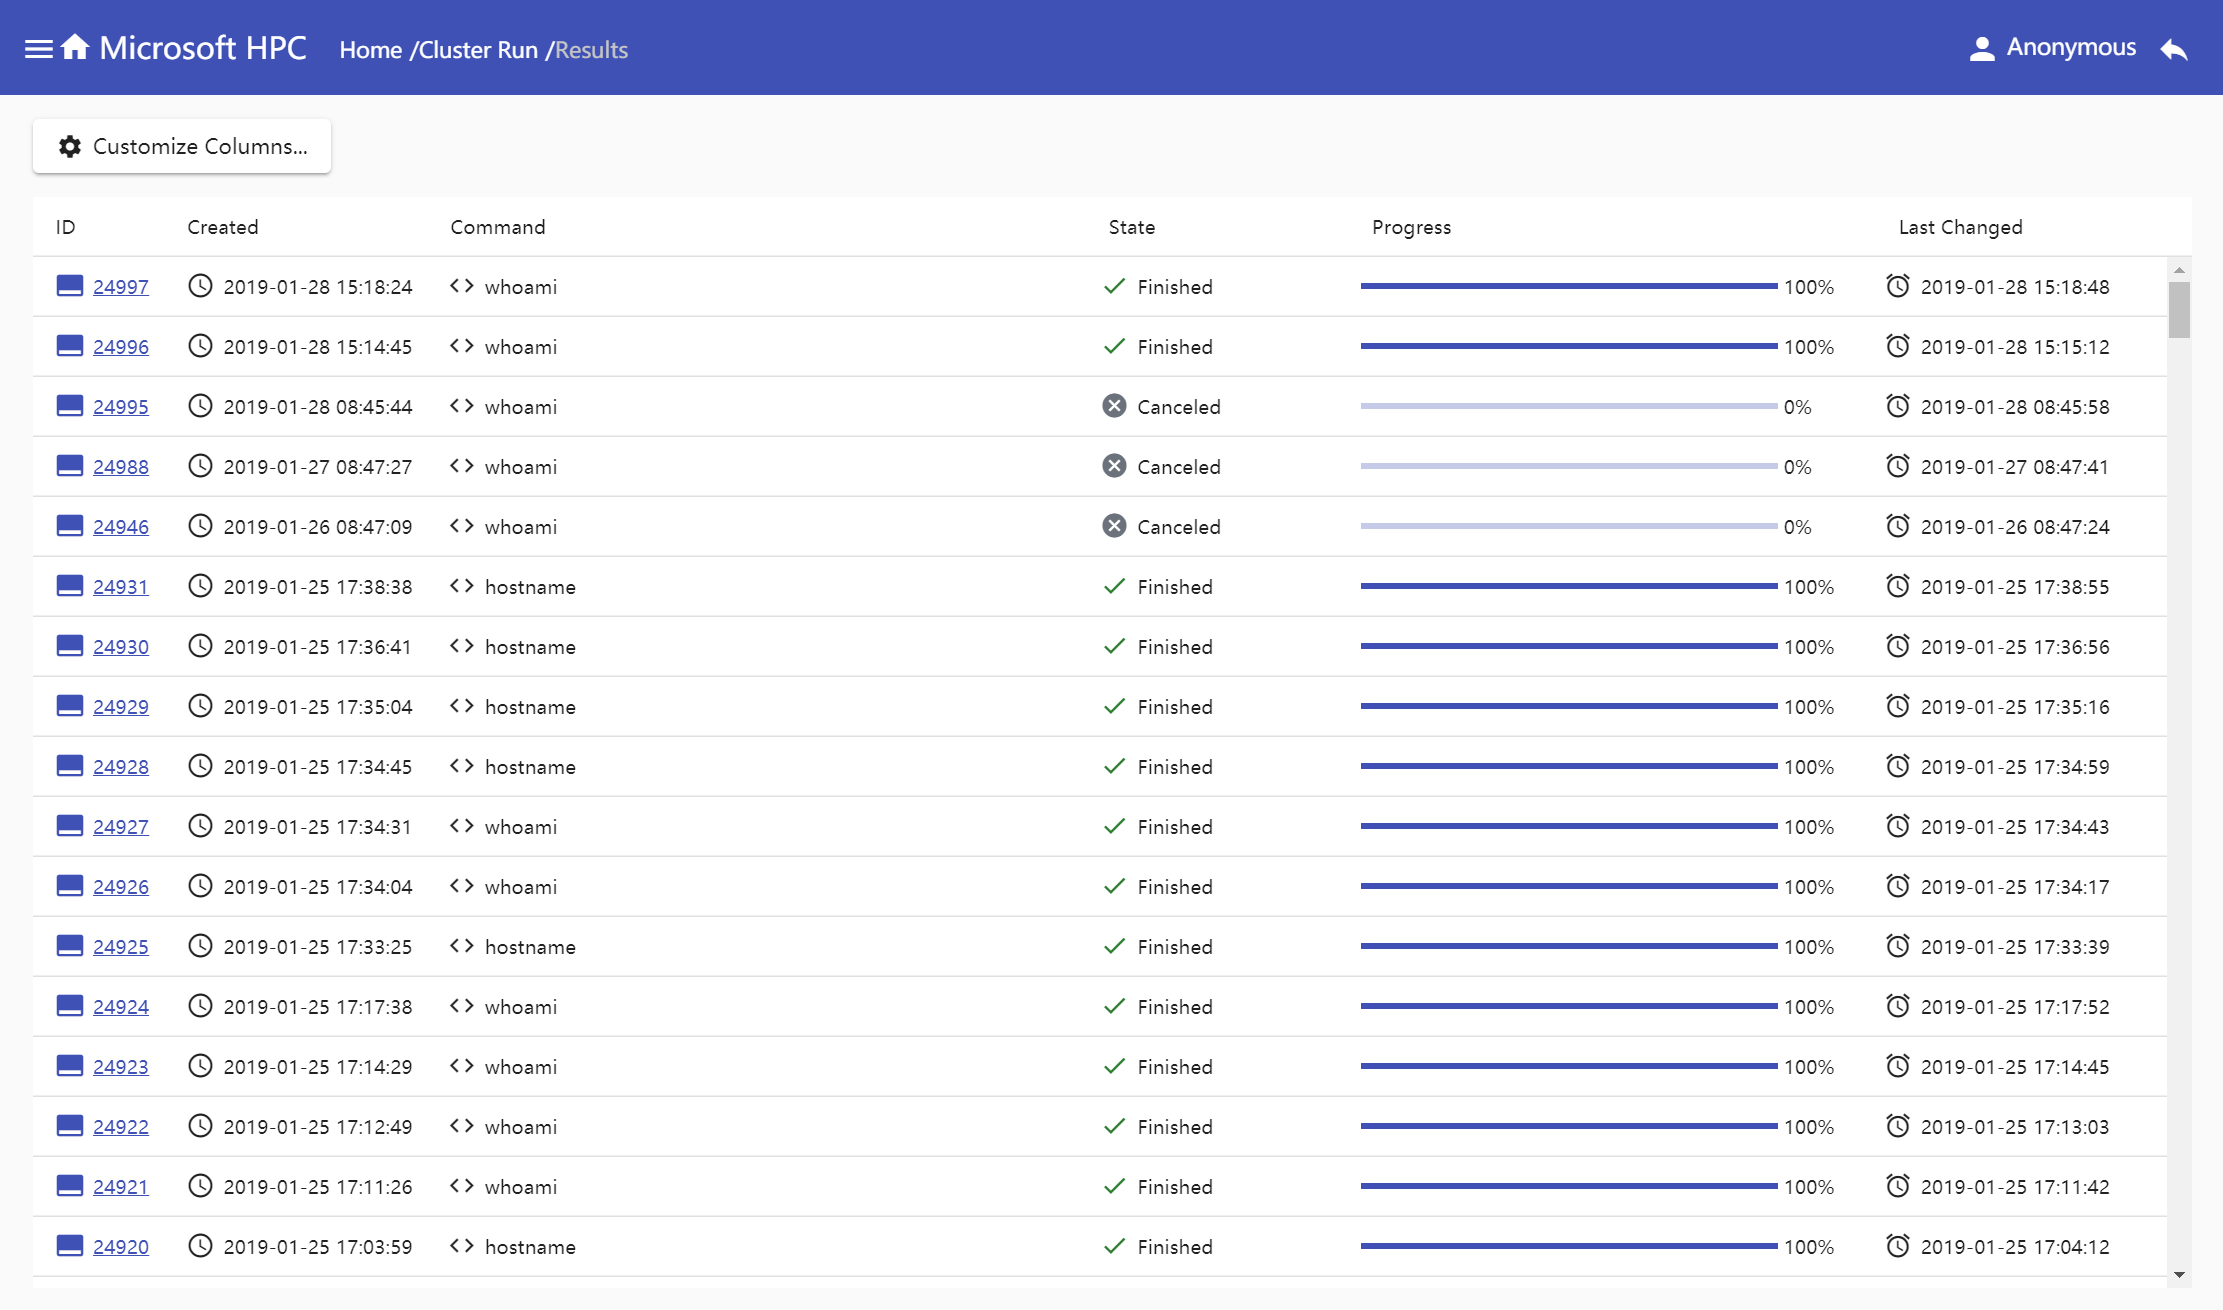
Cluster run table
Cluster run table's items sorted by job created time. You can customize list columns, by default, the table displays job's id, created time, last changed time, command content, job state and job progress. Here you can view the real-time state and progress of cluster run jobs.
How to use portal to create cluster run job
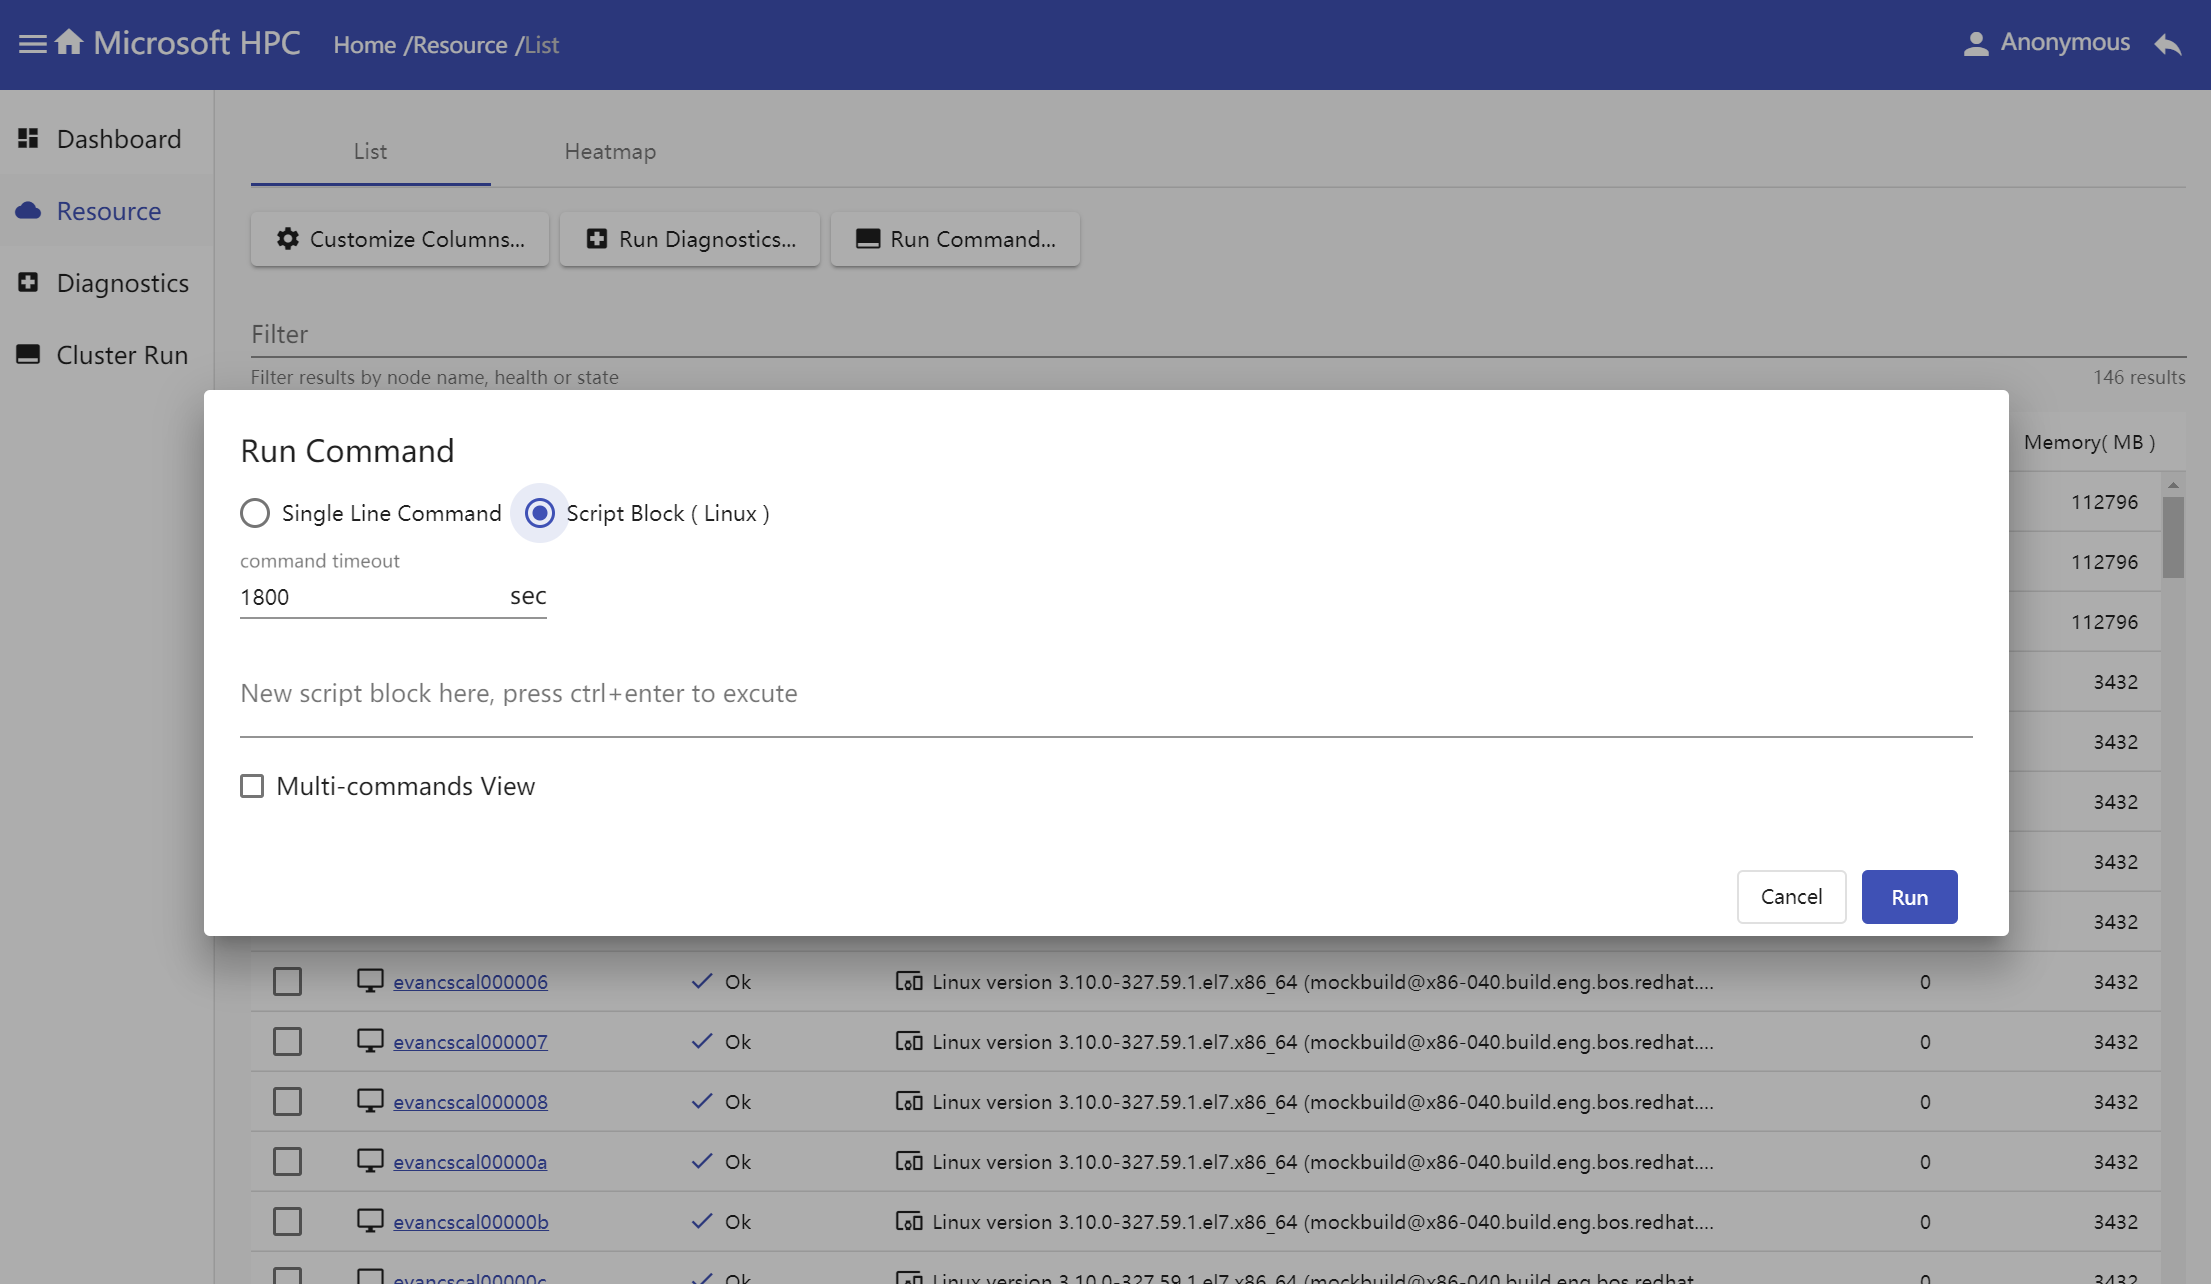
Select nodes in resource table and click 'Run Command' button.
Input command text in popup window, select command type and result view mode.
Single Line Command
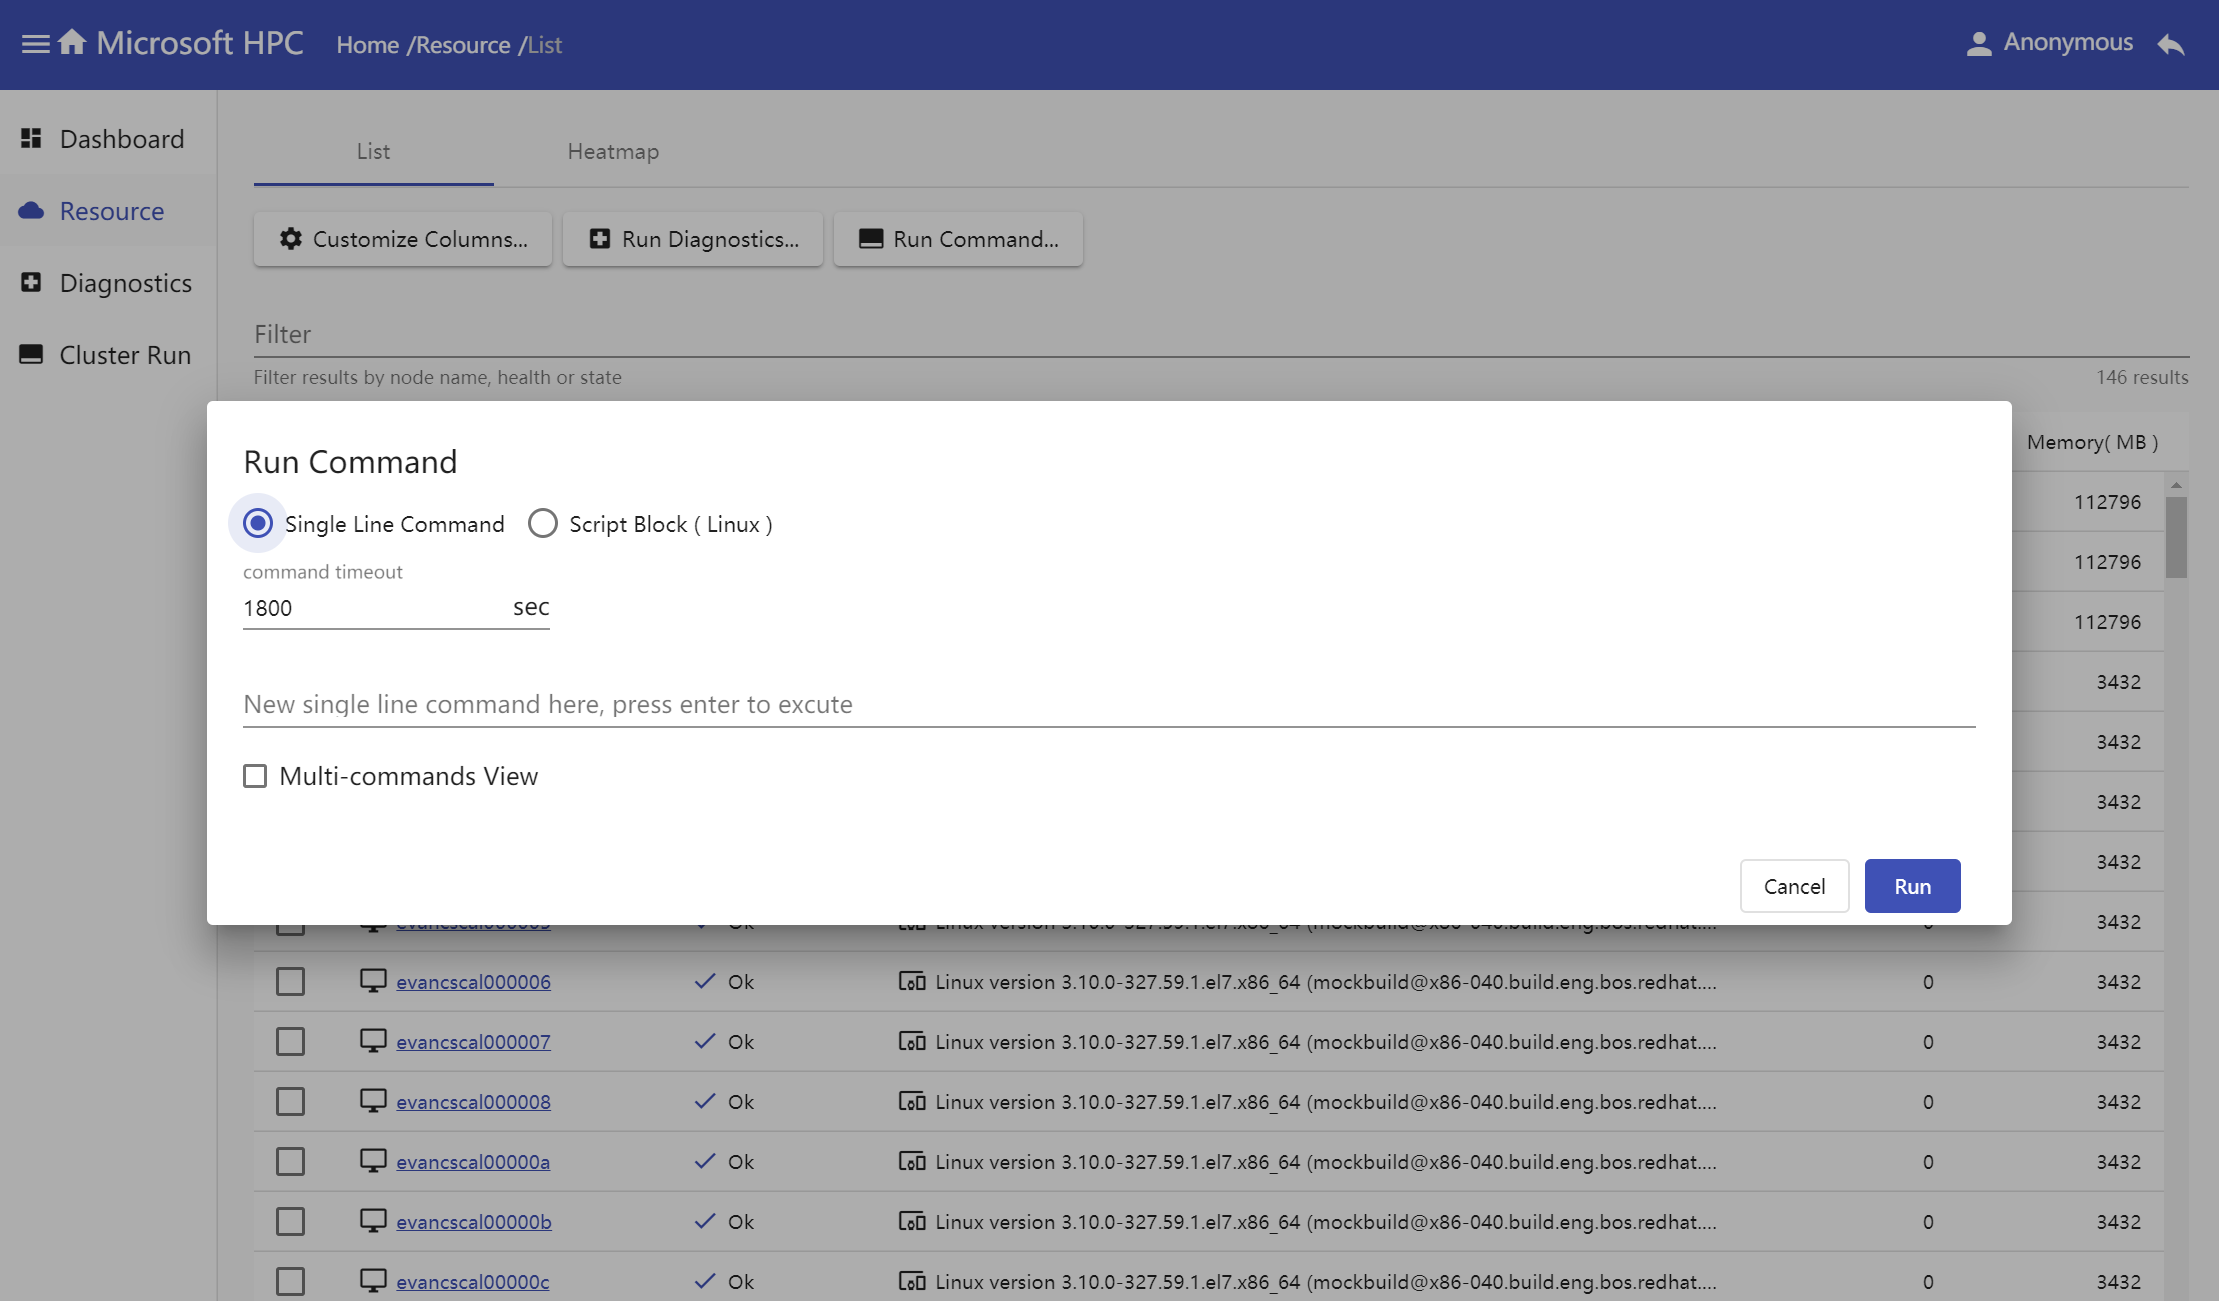
Script Block for Linux
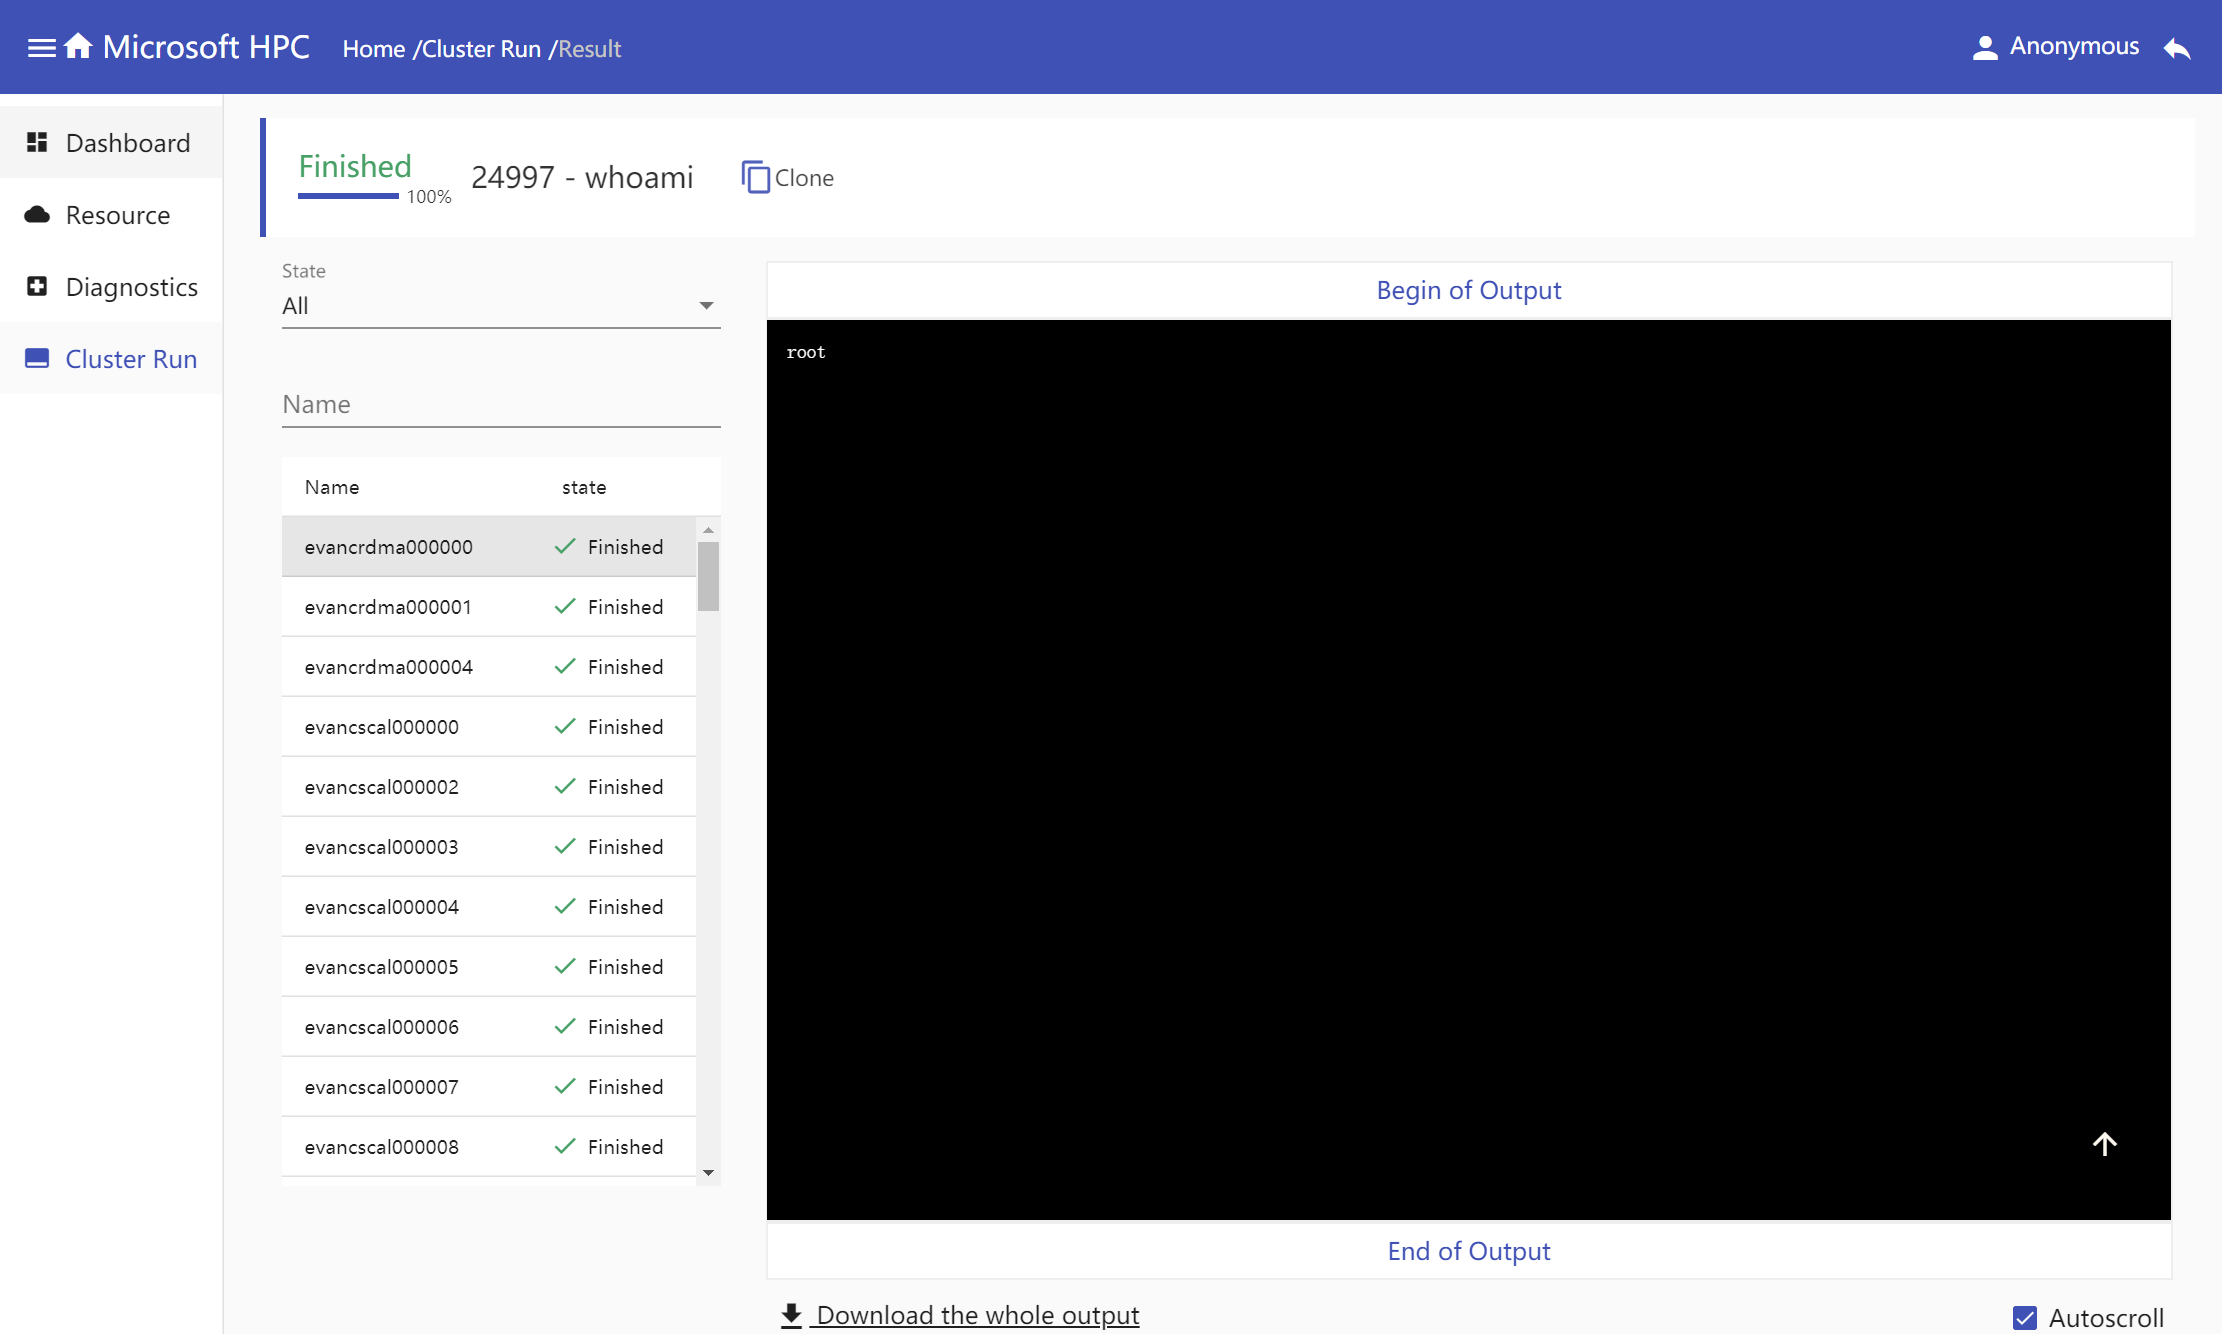
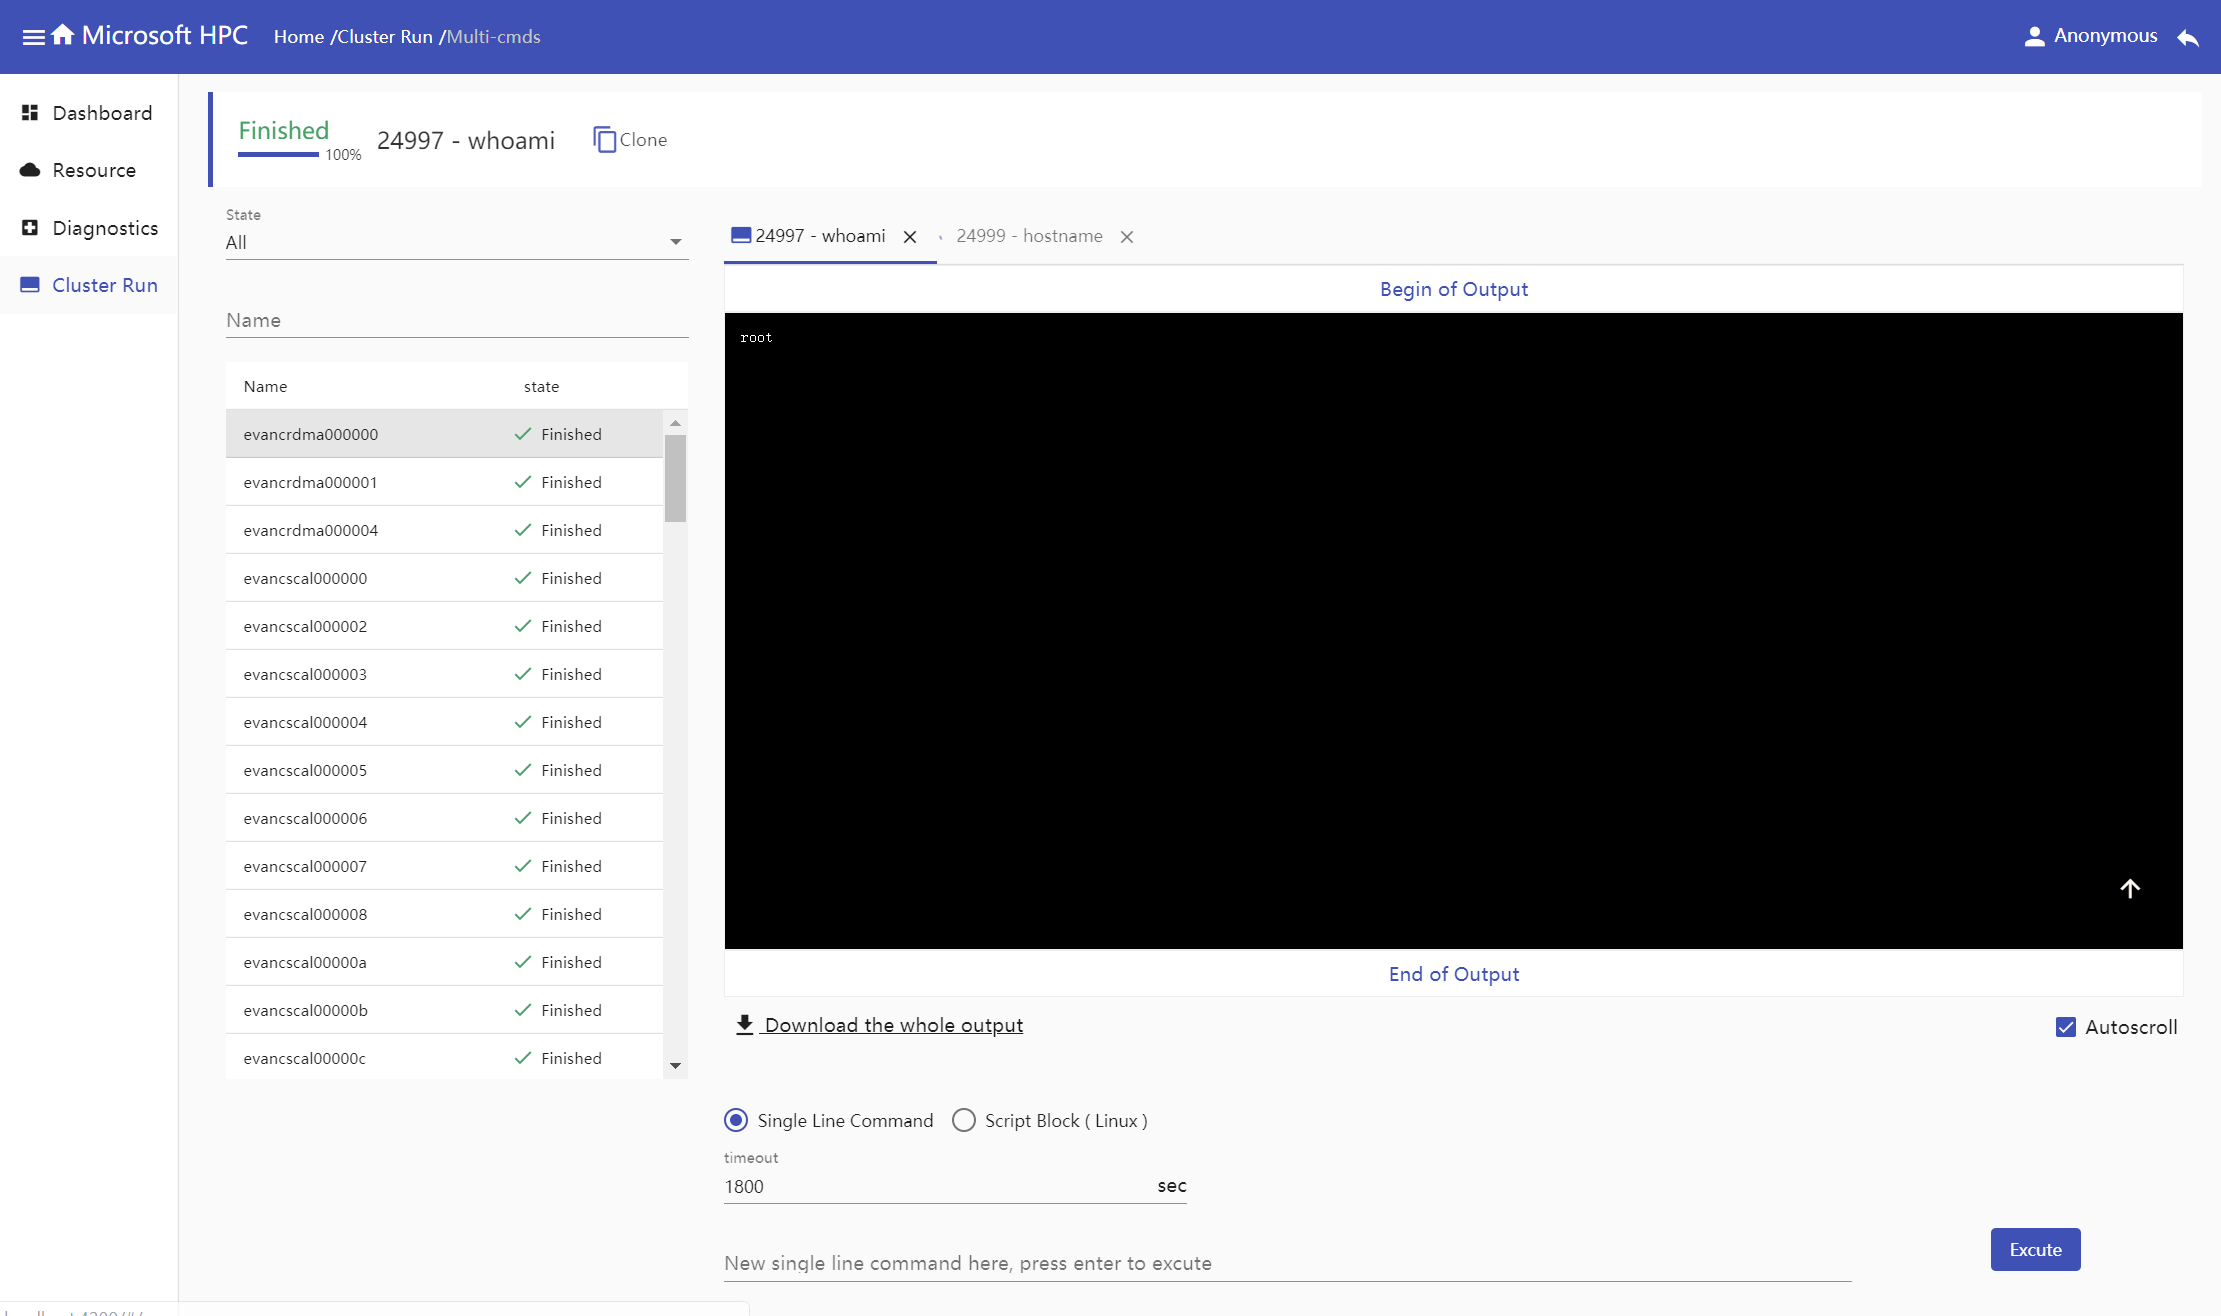
Waiting for test result. In multiple commands view, new commands could be run with the same nodes selected before.
Single Command View
Multiple Commands View
Cluster run result
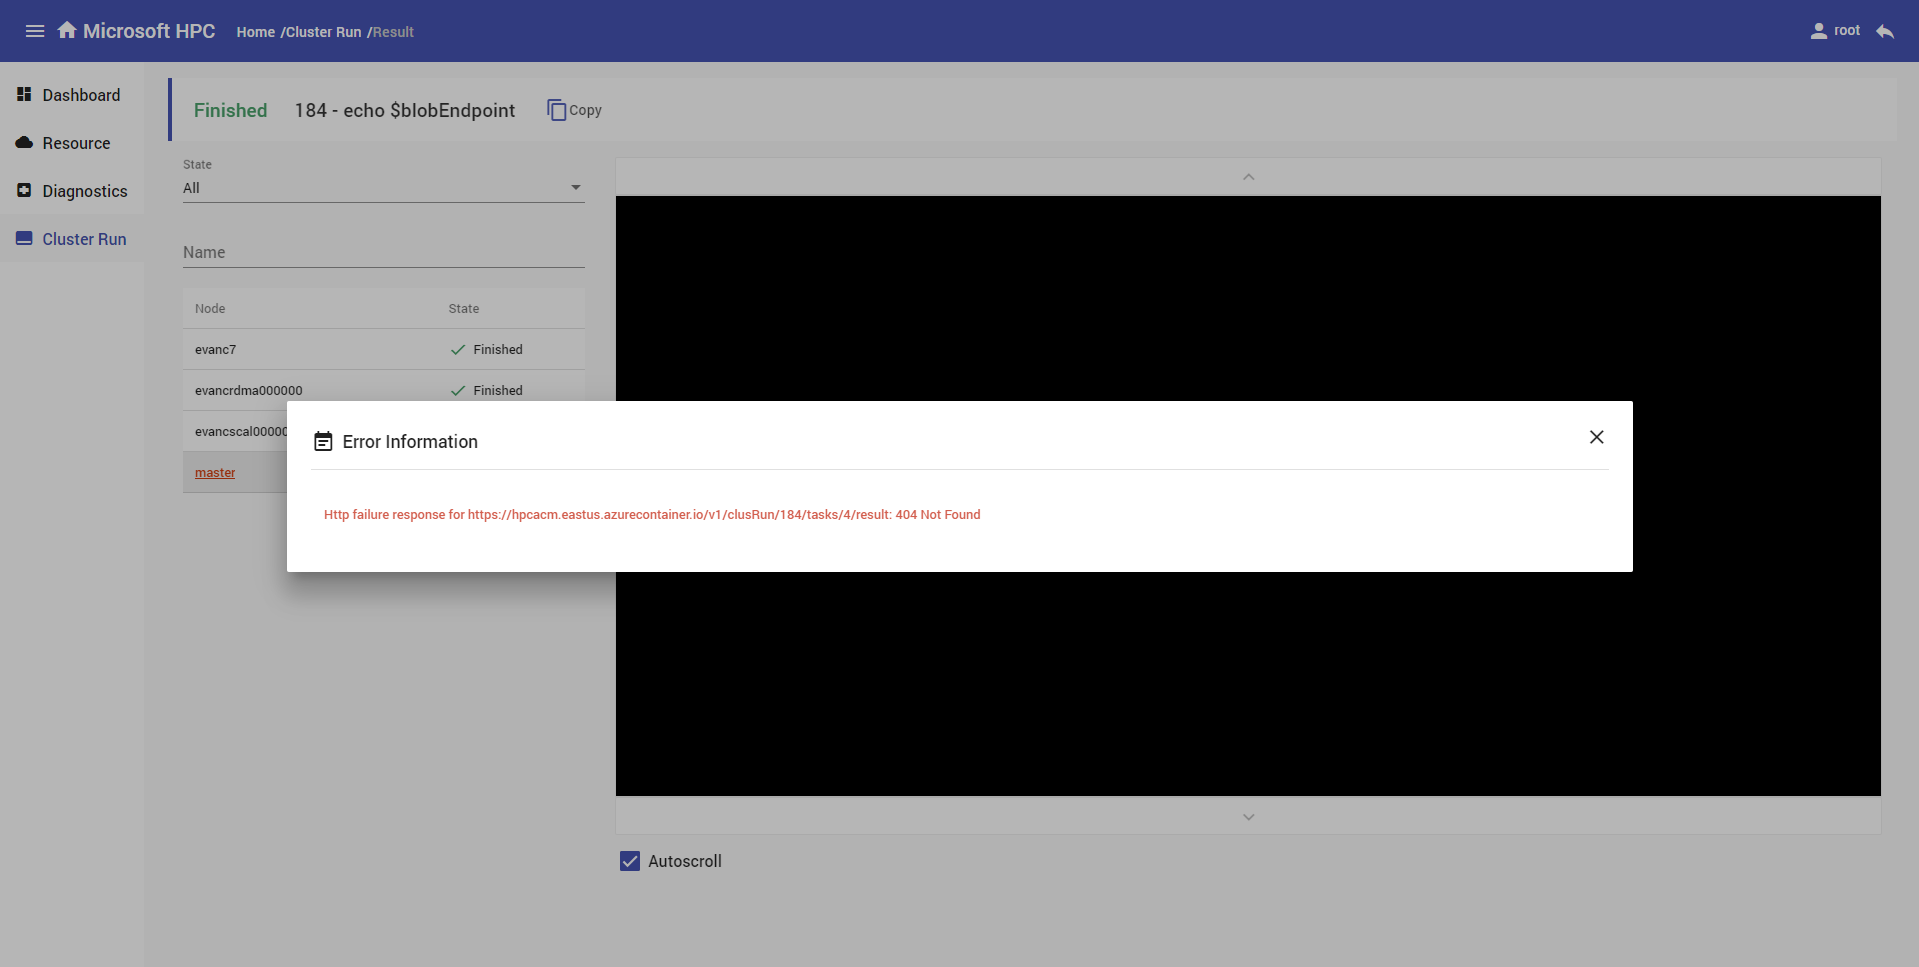
Cluster run result is showed by node, click one item in nodes' table, corresponding result executed command will show in right console and you could download command's whole output. If error happens in one node when getting command executed result, the node's name in nodes table will highlight in red color, and click the error node name, a window will popup to show the detailed error message.
Azure HPC Cluster Monitoring
View properties of cluster nodes and jobs and statistics of high level to monitor cluster condition.
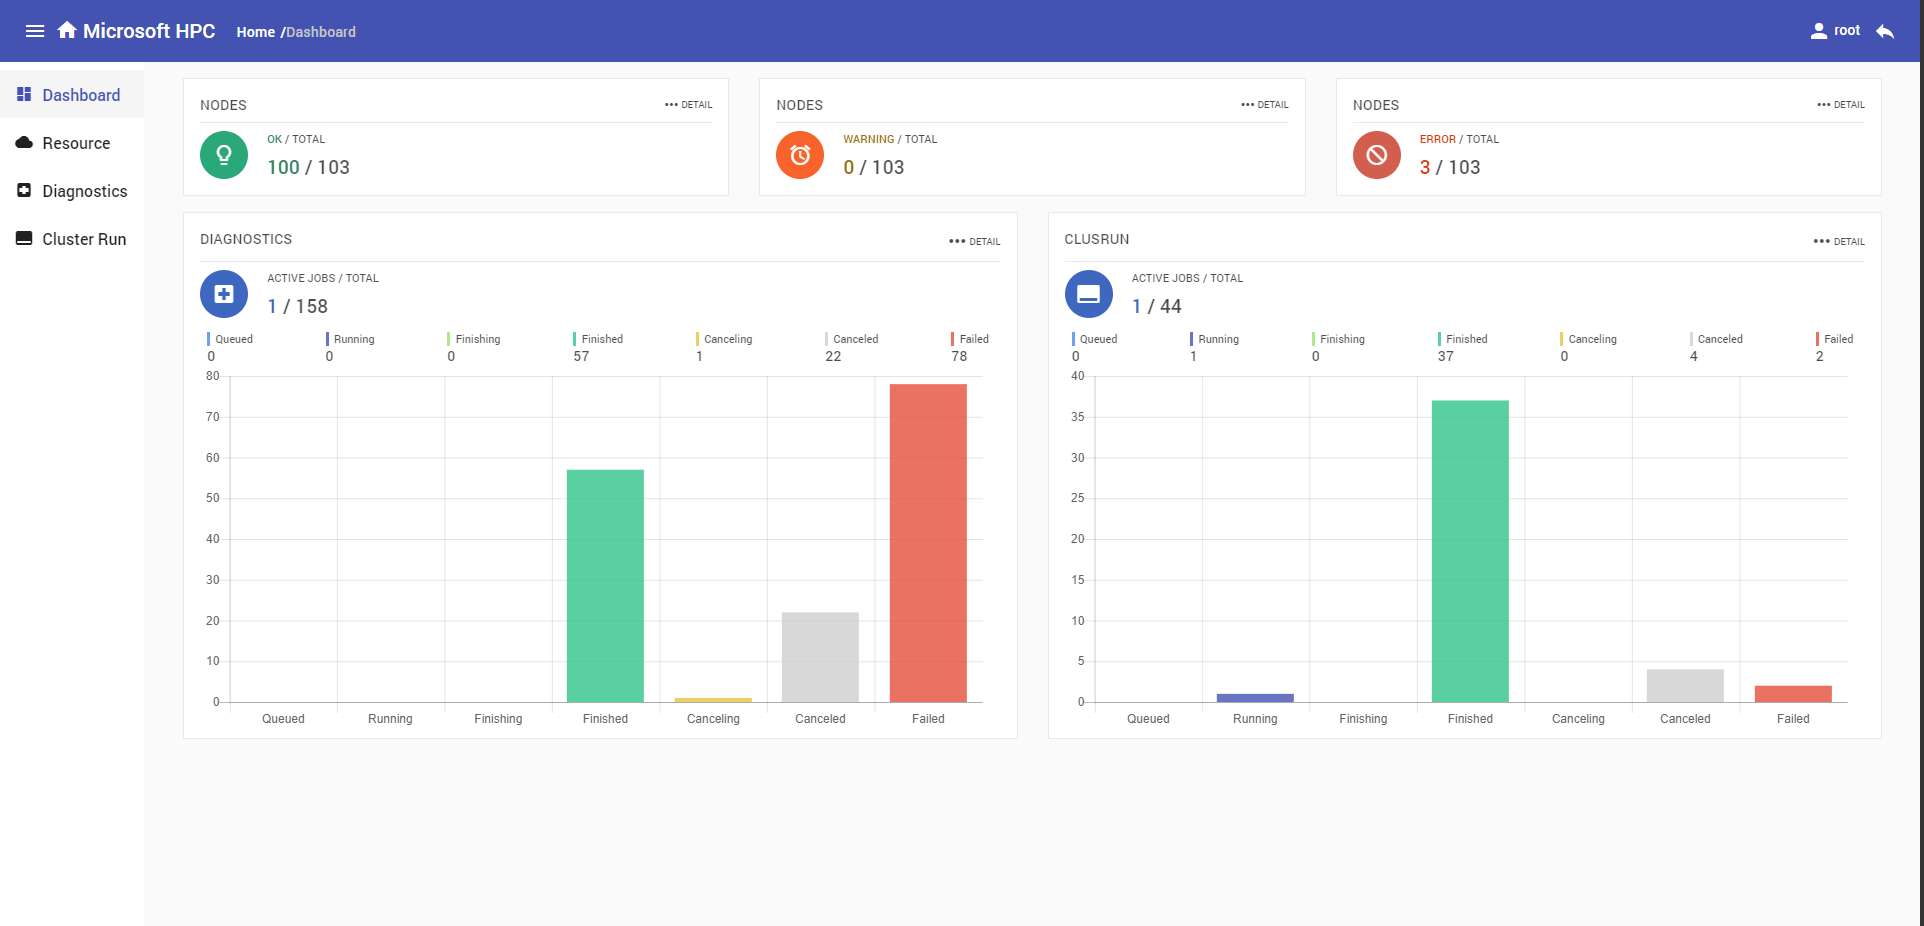
Dashboard
Dashboard shows cluster nodes and jobs at a glance. Nodes have three states, OK, WARNING and ERROR. Jobs could be divided into diagnostics and clusrun, each of them shows jobs by different job states in histogram, the job states include Queued, Running, Finishing, Finished, Canceling, Canceled, Failed.
Resource
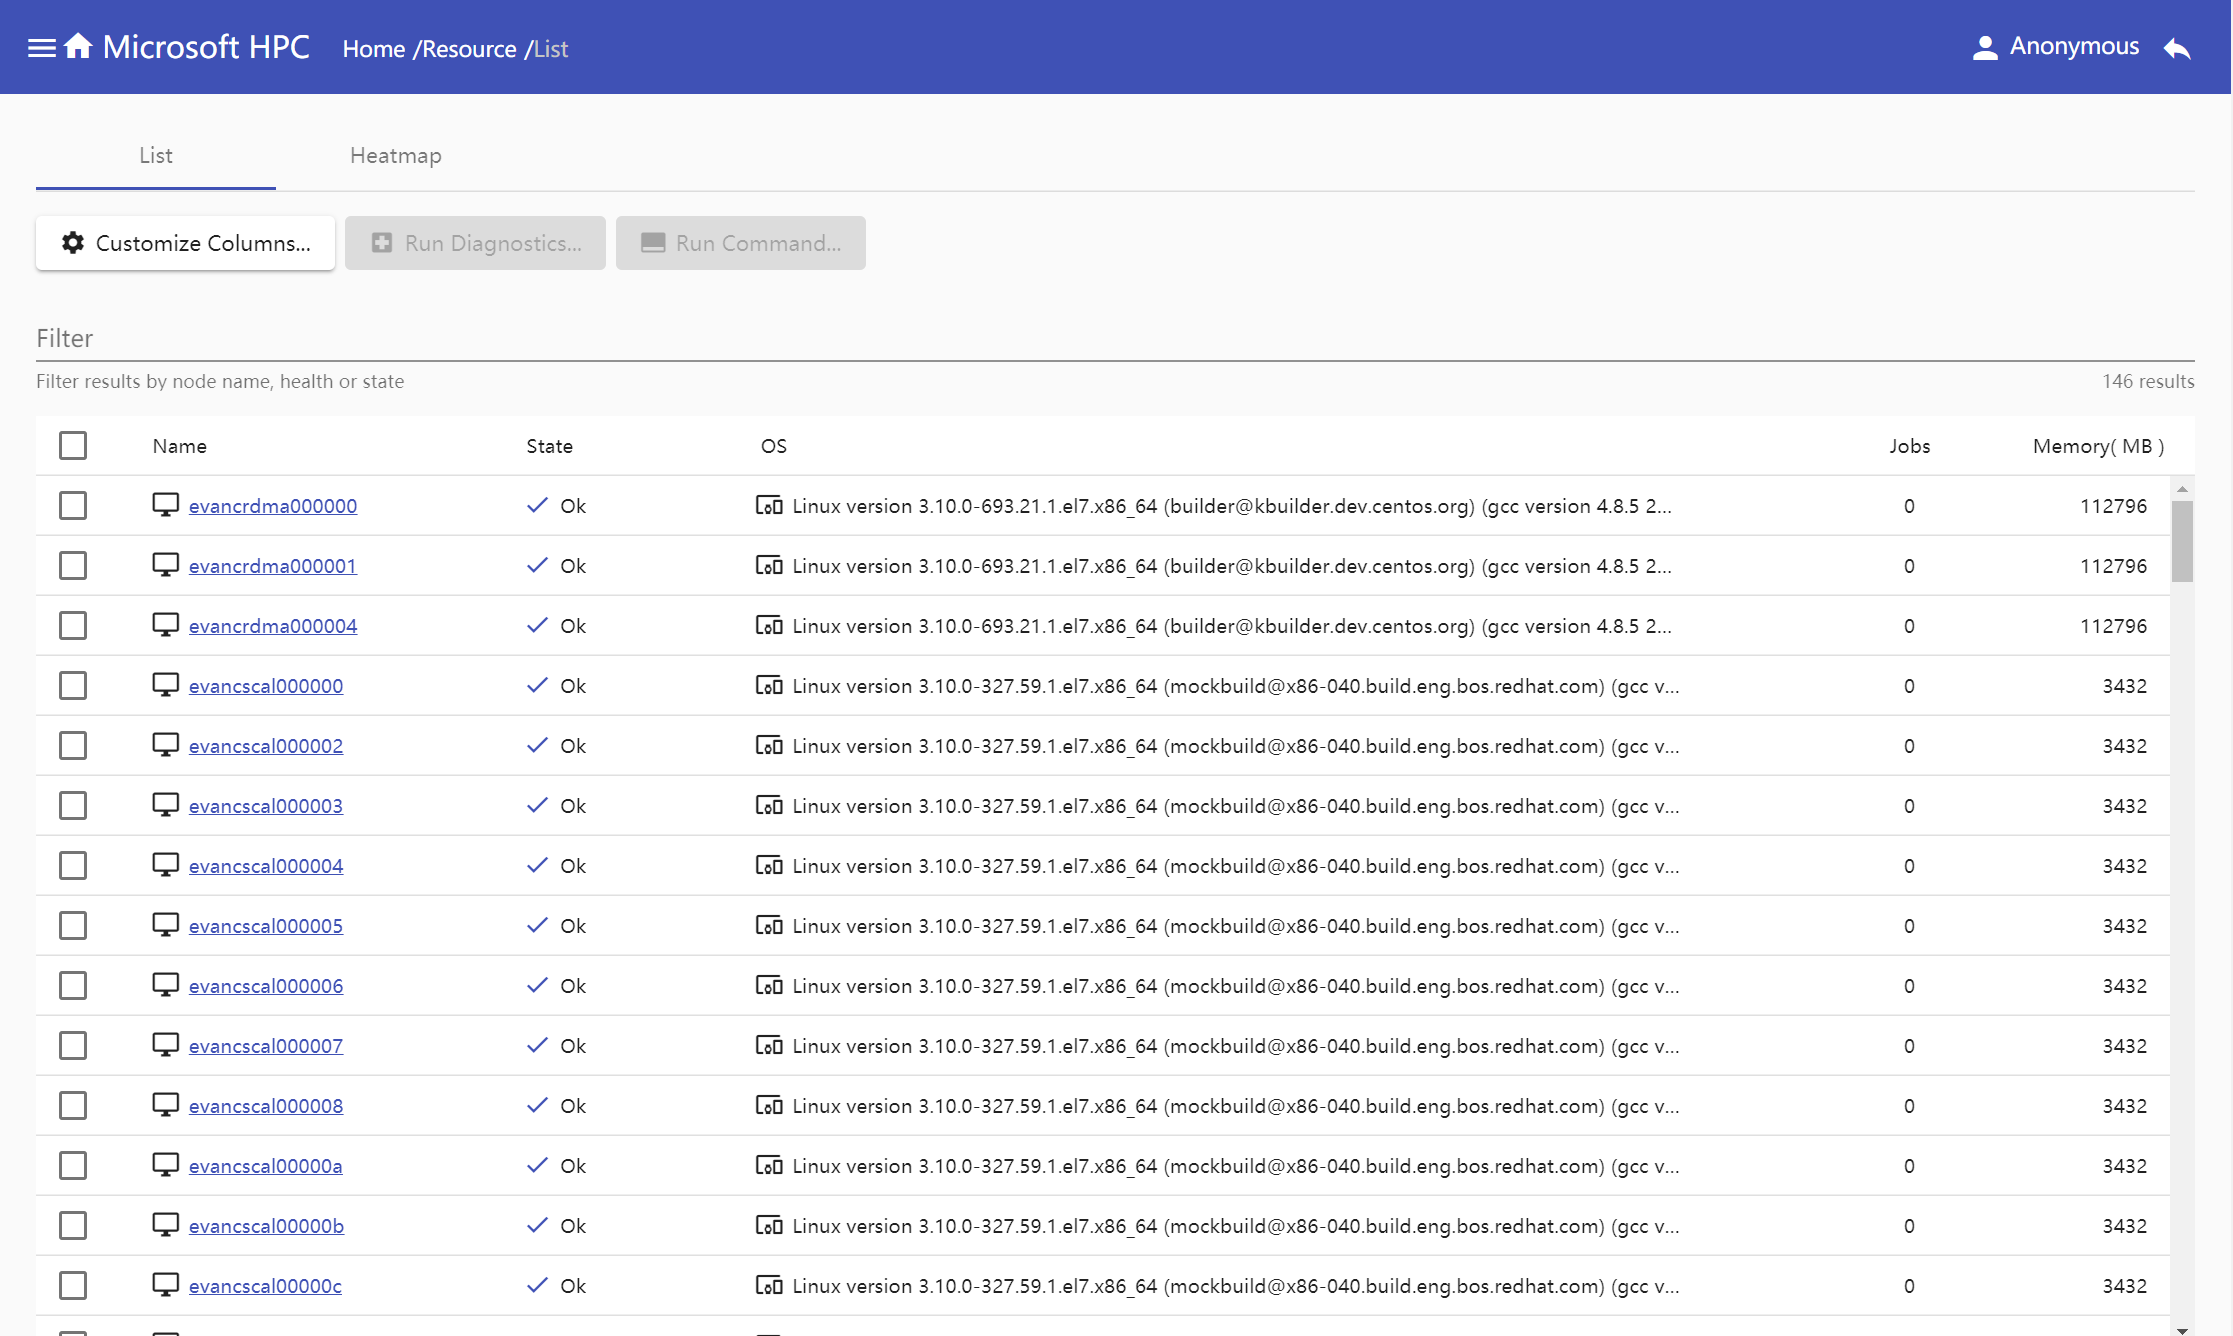
Resource Table
You can view cluster nodes intuitively and track nodes condition quickly via resource table. Resource table shows node name, state, OS, active Jobs count and memory, you also can customize table columns.
Node Information
Node Information includes basic information, nodes events and active jobs.
Basic Info: Display
CPUutilization,node metadata,network informationandnode registration information.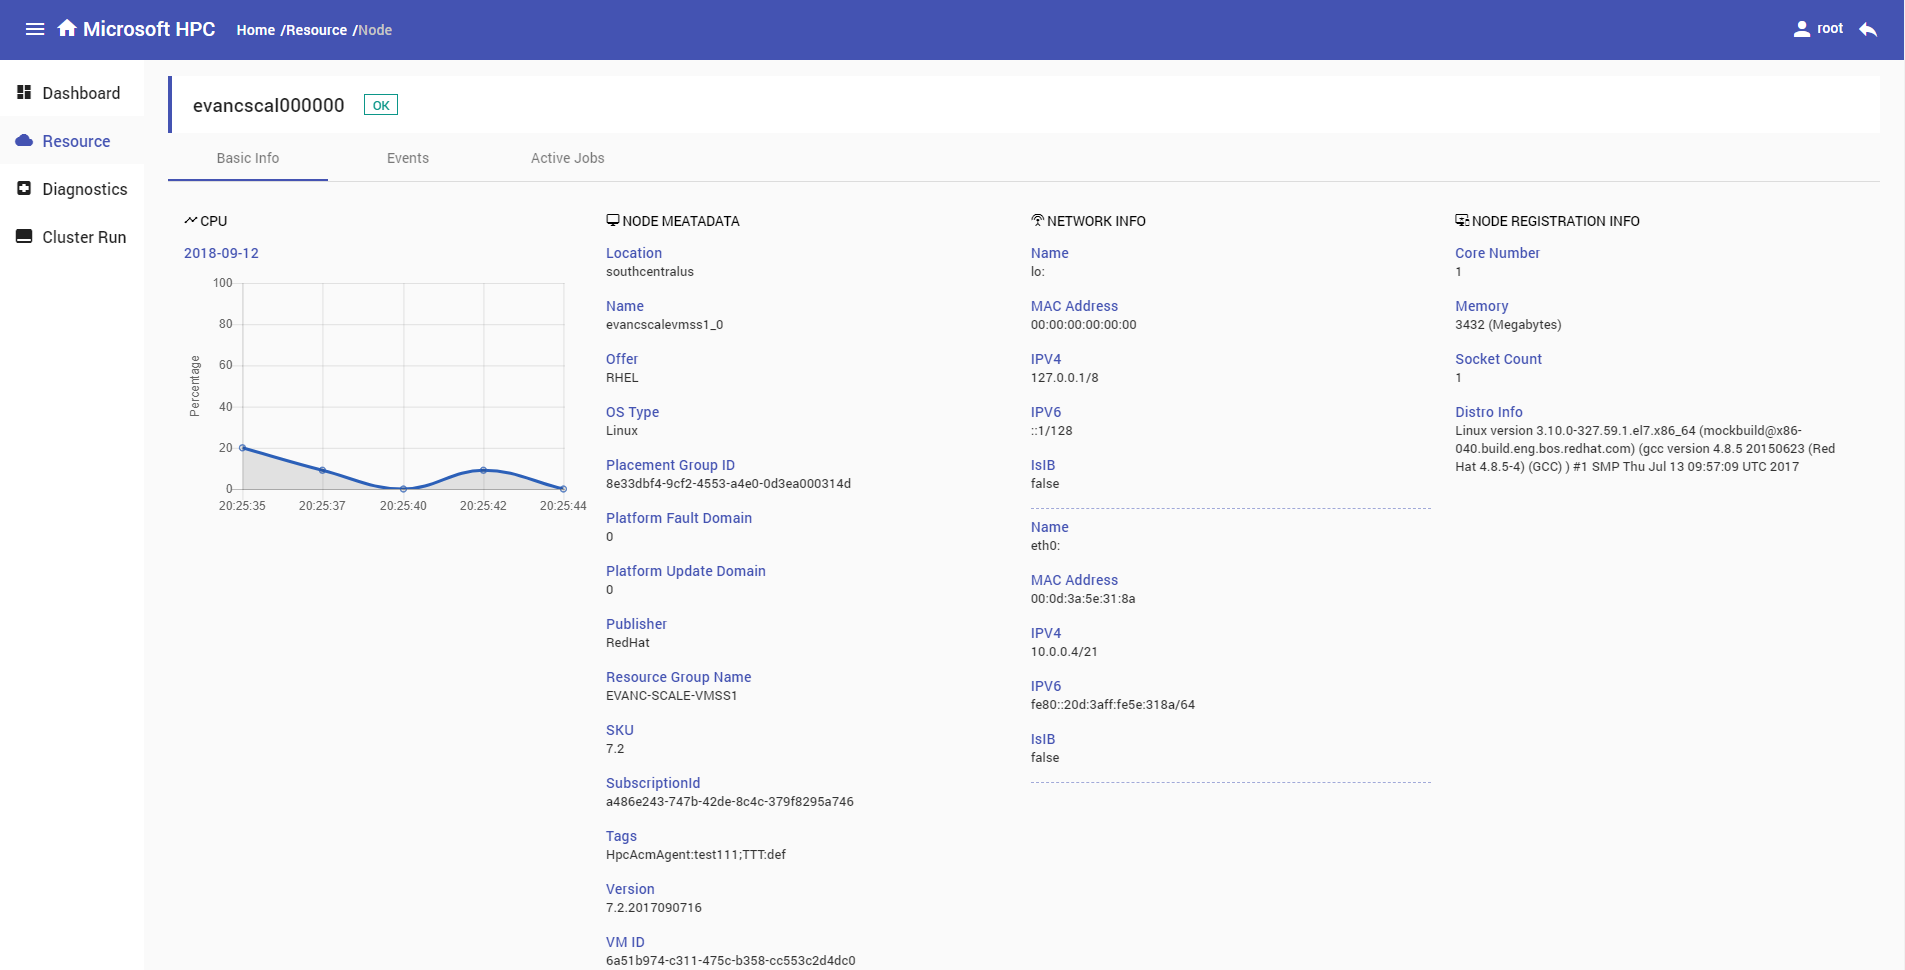
Events: Display
azure scheduled events.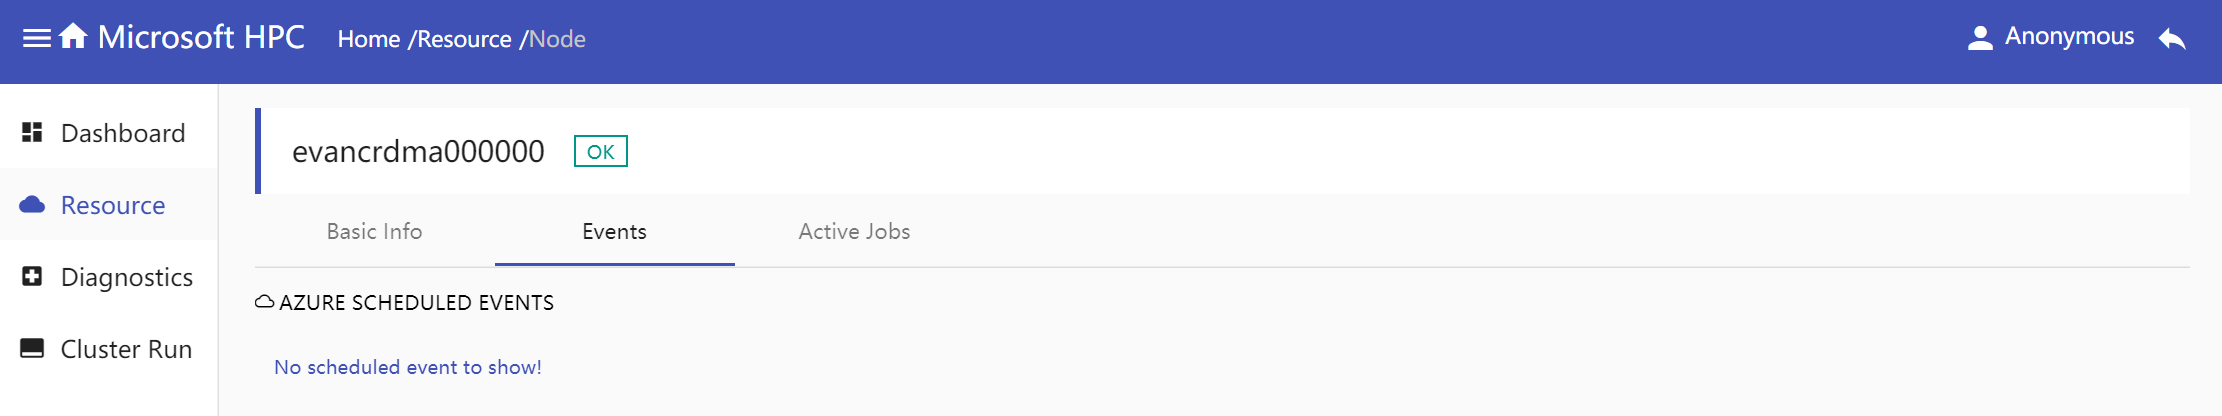
Active Jobs: Display active jobs running in this node which include diagnostics and clusrun.

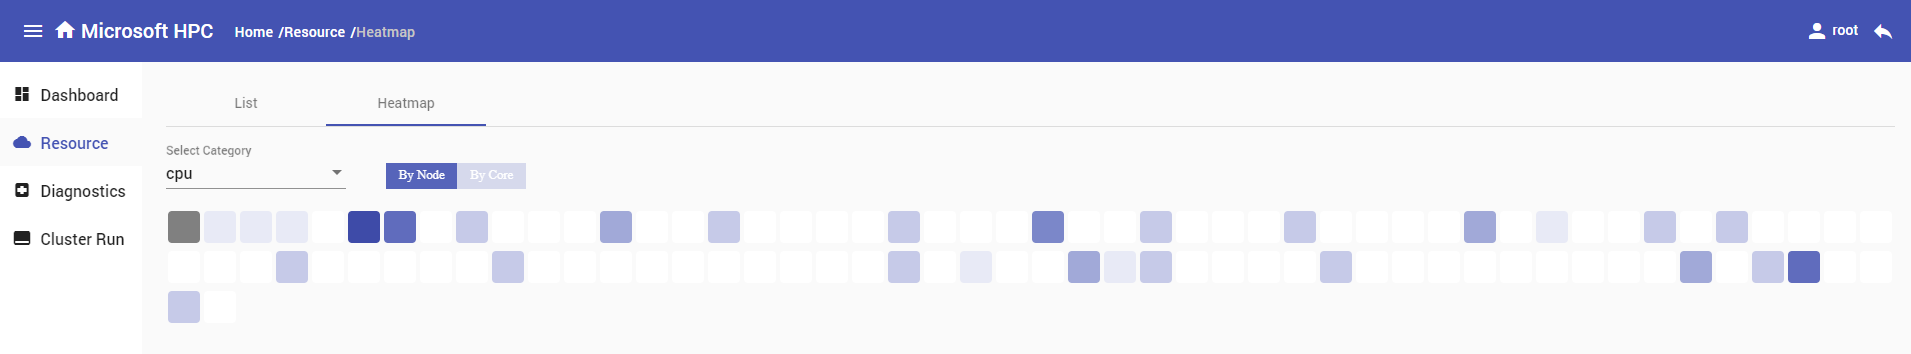
Heatmap
Heatmap gives a big picture of real-time resource utilization in cluster, now it only supports cpu metric. In the heatmap, the darker color the node display, the more resource the node utilize. Hover on the heatmap node square, the node name and cpu usage percent value will show in tooltip, and click on one node square, you will be navigated to the node's detail page.