Configure and monitor sprint burndown
Azure DevOps Services | Azure DevOps Server 2020 | Azure DevOps Server 2019 | TFS 2018 - TFS 2013
Throughout your sprint, you can monitor the sprint burndown chart to determine if your team is on track to complete its sprint plan. The in-context sprint burndown report supports tracking burndown based on Remaining Work assigned to sprint tasks.
Use this article to learn about:
- Metrics tracked in the sprint burndown report and widget
- Team activities required to track tasks and Remaining Work
- How to configure the Sprint Burndown widget
- How to view current and past sprint burndowns
Note
Sprint burndown reports are derived from data tracked by a team during a sprint or iteration. To learn more, see About teams and Agile tools.
The in-context Burndown Trend report
The in-context sprint burndown report is based on the tasks and Remaining Work estimates you define and update throughout the sprint cycle. For details, see Sprint planning and taskboard. To open the sprint burndown chart, jump to the section Open sprint burndown chart.
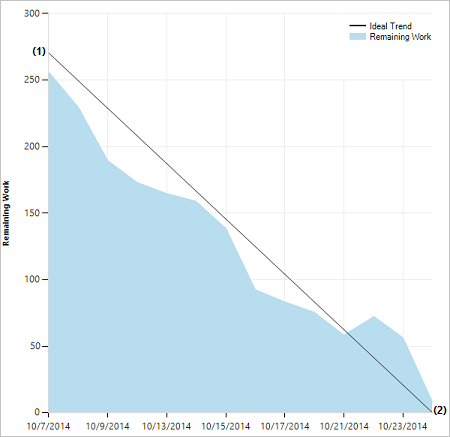
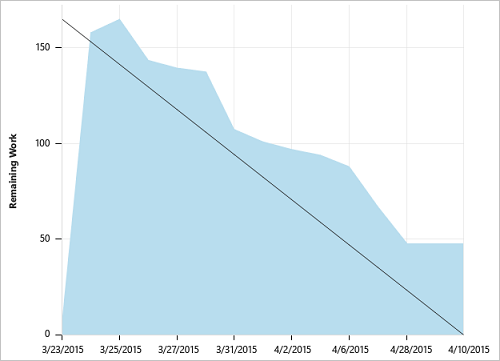
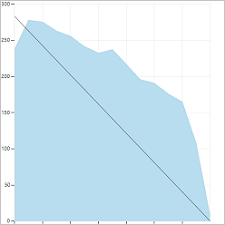
A healthy sprint burndown chart will look something like this. The Ideal Trend line connects the two points:
- (1) Team's total capacity at the start of the sprint.
- (2) 0 Remaining Work at the end of the sprint.
The slope represents the rate at which the team needs to burn down work to finish the sprint on time.
The actual graph, the blue area, represents the total amount of planned sprint work and how it changes throughout the course of the sprint. The blue area corresponds to the sum of all Remaining Work set for all sprint tasks, and possibly bugs, that have the current sprint as their iteration path.
Prerequisites
- You must be a member of a project. If you don't have a project yet, create one.
- If you haven't been added as a project member, get added now.
Team activities to track tasks and Remaining Work
To monitor sprint burndown, your team must schedule sprints and assign work to those sprints. For sprint burndown charts to show meaningful data, your team must carry out these extra actions.
Required activities:
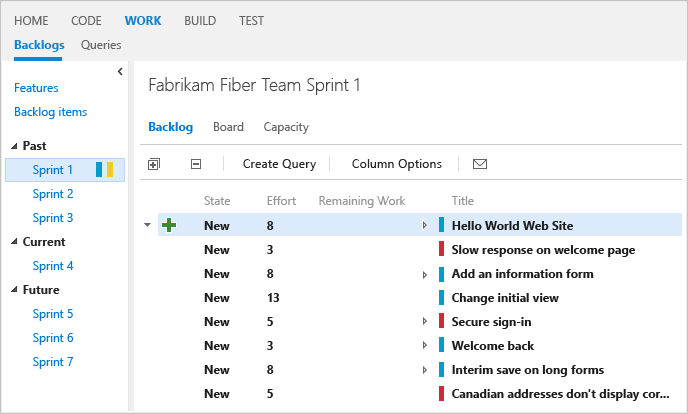
- Define and estimate tasks for each product backlog item you're working on in the sprint. If you work from your team's backlog and taskboard, the items you create will automatically be assigned to the current sprint (Iteration) and to your team's default Area Path.
- Update Remaining Work for each sprint task as work progresses.
Recommended activities:
- Define tasks that take a day or less to complete to lessen the effect of poor estimates.
- Don't divide tasks into subtasks. If you divide a task into subtasks, specify hours only for the subtasks. These hours are rolled up as summary values for the parent task.
- Update Remaining Work daily or several times within a week to support monitoring and achieve a smoother burndown chart.
- At the end of the sprint, update the task status of completed tasks and determine how to handle incomplete tasks.
Empty sprint burndown chart
If your sprint burndown chart appears empty, check these points:
- Have you assigned tasks to the sprint associated with the chart?
- Have you assigned Remaining Work to the tasks assigned to the sprint?
- Are the parent work items of the tasks assigned to the same sprint? If not, the tasks may appear in another sprint associated with the parent item.
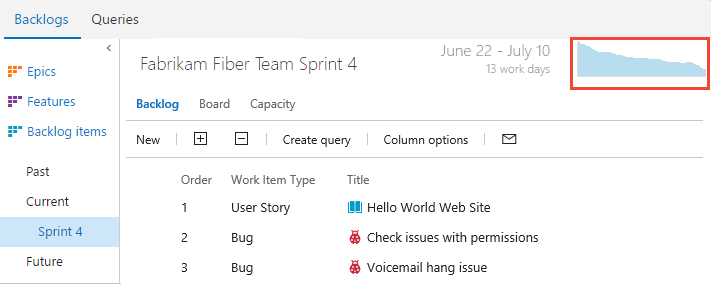
Open a Sprint backlog
You view the in-context sprint burndown report from a team's Sprint backlog.
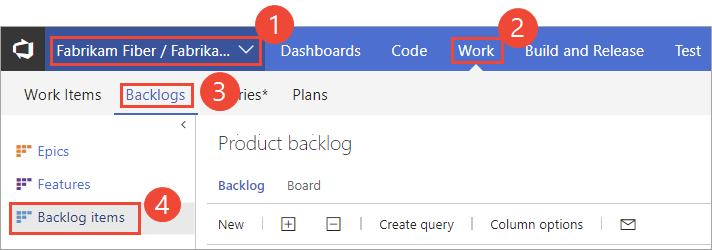
From your web browser, open your team's sprint backlog. (1) Select the team from the project/team selector, select (2) Work, (3) Backlogs, and then (4) the product backlog, which is Backlog items (for Scrum), Stories (for Agile), or Requirements (for CMMI).
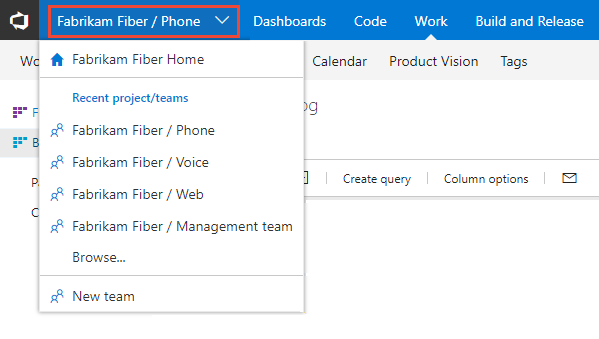
To select another team, open the project/team selector and select a different team or select the Browse option.
The set of sprints selected for your team appears in the left pane. If you don't see any sprints listed, you can add sprints or select existing sprints for your team's use. To learn how, see Define sprints.
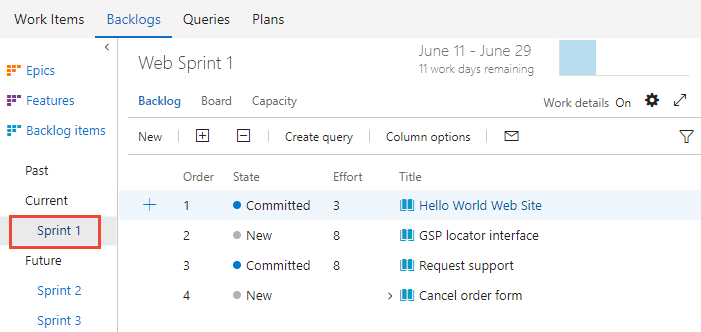
Select the sprint whose burndown chart you want to view.
The system lists only those sprints that have been selected for the current team focus. If you don't see the sprints you want listed, then see Define iteration paths.
View the in-context Burndown Trend report
Select the chart to display it in a larger view.
Current and past sprint burndown charts
As you complete each sprint, the system maintains a history of your activity.
To view a past sprint and its burndown chart, select the sprint listed under the Past section of the sidebar.
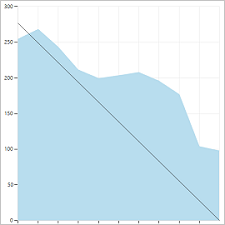
You can review sprint burndown in-context reports to show the team patterns in execution. The burndown charts maintain a record of the team's ability to plan and estimate.
| Sprint 1 | Sprint 2 | Sprint 3 |
|---|---|---|
 |
 |
 |
Teams may find it useful to review these reports periodically during their sprint retrospectives. It may spark useful discussions and lead to setting one or more sprint goals, such as:
- How does our projected velocity match up to our actual velocity?
- How can we more accurately determine how much we can accomplish in a sprint?
- How can we complete work at a more regular pace throughout the sprint?
Next steps
In addition to the sprint burndown chart, teams can review the velocity at which they work sprint over sprint. The velocity chart tracks how many backlog items your team works on in a sprint. You can use your team velocity as input into the forecast tool to help plan your sprints.
Related articles
You can learn more about defining, planning, and executing your sprints from these articles:
- Define iteration paths and configure team iterations
- Sprint planning
- Add tasks to backlog items
- Update and monitor your Taskboard
- Scrum and best practices
And, from these industry resources:
For on-premises deployments, you can specify the format that appears—h for hours or d for days—for the remaining work field.