View or configure team velocity
TFS 2017 | TFS 2015 | TFS 2013
Velocity provides a useful metric for gaining insight into how much work your team can complete during a sprint cycle. Each team is associated with one and only one velocity chart.
Note
For TFS 2018 and earlier versions, you can only view team velocity. There is no configuration of this report.
Velocity will vary depending on team capacity, sprint over sprint. However, over time, the velocity should indicate a reliable average that can be used to forecast the full backlog.
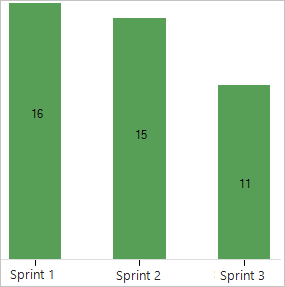
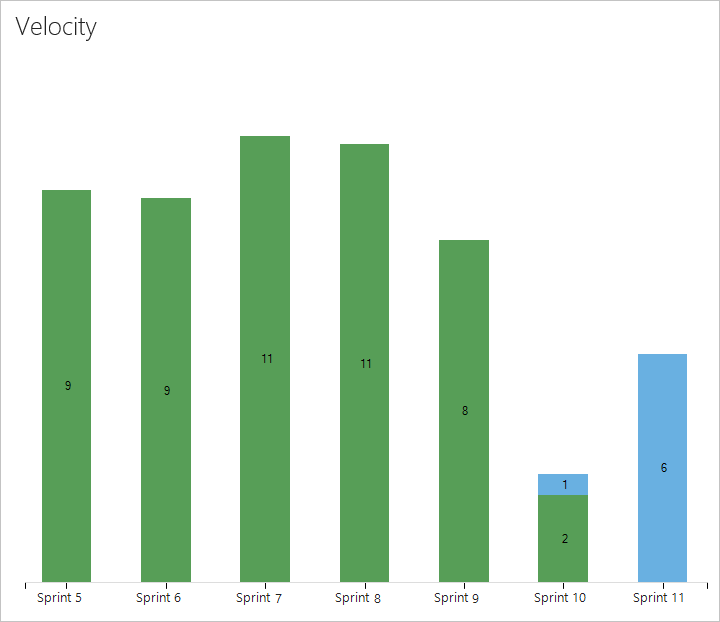
Example Velocity chart from the work tracking data store
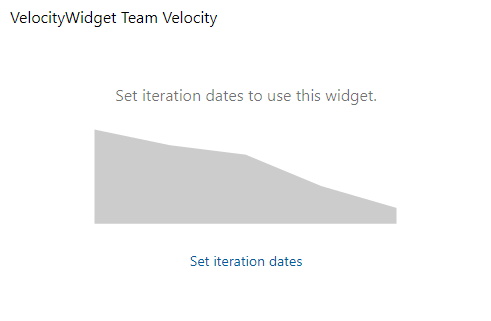
Once your team has completed a few sprints, they can use their velocity to forecast how much of the backlog they can finish within upcoming sprints. If your team hasn't completed a sprint or if you're working on items before a sprint start date, Velocity would have no data to analyze and forecast. You might see this message: Set iteration dates to use this widget. To resolve this situation, set an iteration date range to include present date or wait for the sprint to start. For usage guidance, see Velocity metrics and usage guidance.
Example: Velocity showing Set iteration dates to use this widget
Note
The images you see from your web portal may differ from the images you see in this article. These differences result from updates made to your web app, options that you or your admin have enabled, and which process was chosen when creating your project—Agile, Basic, Scrum, or CMMI. The Basic process is available with Azure DevOps Server 2019 Update 1 and later versions.
Use this article to learn:
- How to view the Velocity in-context report (work tracking data store)
- Required and recommended team activities to support velocity tracking
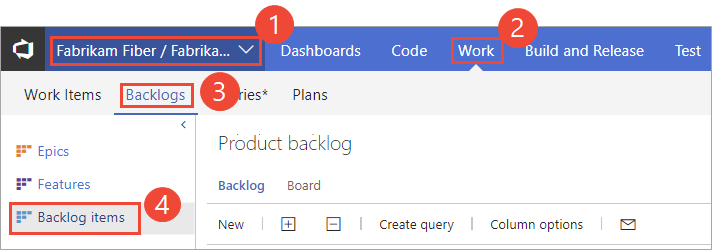
Open your backlog from the web portal
On your web browser, open your team's product backlog and select the team from the project and team selector. Then select Work > Backlogs. Select the product backlog, which is Backlog items for Scrum, Stories for Agile, or Requirements for CMMI.
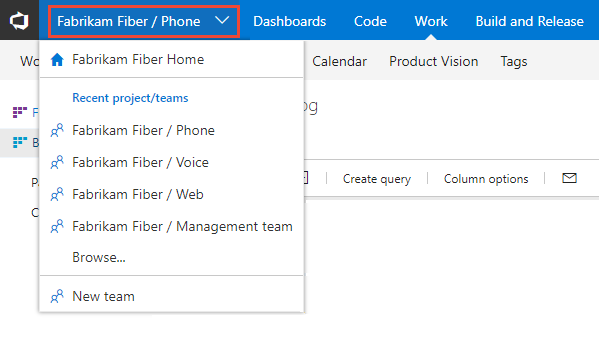
To select another team, open the project and team selector. Select a different team, or select the Browse option.
View the Velocity in-context report
From the web portal, open the product backlog and then select the velocity chart.

For charts to appear, your team must carry out these activities:
- Select sprints for your team.
- Assign backlog items to sprints.
- Estimate backlog items by defining the Effort, Story Points, or Size.
The report tracks your estimated backlog work (sum of Effort, Story Points, or Size) that your team has completed (green) in the previous sprints, or that are still in progress (blue).
As this chart shows, velocity will fluctuate from sprint-to-sprint for different kinds of reasons. However, you can quickly determine the average velocity by averaging the values shown in green for each sprint. You can then plug the average into the Forecast tool.
Note
Work items based on the Scrum process get counted in the chart once their State is set to Committed, whereas items based on the Agile and CMMI processes get counted once their State is set to Active. This behavior is set through the workflow states to category state mappings.
Required and recommended activities
For your team to gain the greatest utility from the velocity charts, follow these required and recommended tasks.
Required:
- Define iteration paths (aka sprints) and configure team iterations Sprints should be of the same duration.
- Define and estimate backlog items. If you work from your team's backlog, the items you create will automatically be assigned to the current sprint (Iteration) and to your team's default Area Path.
- Update the status of backlog items once work starts and when completed. Only backlog items whose State maps to a metastate of In Progress or Done will show up on the velocity chart or velocity widget.
Recommended:
- Define and size backlog items to minimize variability.
- Determine how your team wants to treat bugs. If your team chooses to treat bugs like requirements, bugs will show up on the backlog and be counted within the Velocity chart and forecasting.
- Set your team's area path. The forecast tool will forecast those items based on your team's default settings. These settings can specify to include items in area paths under the team's default or exclude them.
- Don't create a hierarchy of backlog items and bugs. The Kanban board, sprint backlog, and task board only show the last node in a hierarchy, called the leaf node. For example, if you link items within a hierarchy that is four levels deep, only the items at the fourth level appear on the Kanban board, sprint backlog, and task board.
Instead of nesting requirements, bugs, and tasks, we recommend that you maintain a flat list-only creating parent-child links one level deep between items. Use Features to group requirements or user stories. You can quickly map stories to features, which creates parent-child links in the background. - At the end of the sprint, update the status of those backlog items that the team has fully completed. Incomplete items should be moved back to the product backlog and considered in a future sprint planning meeting.
Add other teams
If you work with several teams, and each team wants to work with their own backlog view, velocity chart, and forecast tool, you can add teams. Each team then gets access to their own set of Agile tools. Each Agile tool filters work items to only include those whose assigned area paths and iteration paths meet those set for the team.