Tutorial: Detect anomalies at the edge with the Remote Monitoring solution accelerator
In this tutorial, you configure the Remote Monitoring solution to respond to anomalies detected by an IoT Edge device. IoT Edge devices let you process telemetry at the edge to reduce the volume of telemetry sent to the solution and to enable faster responses to events on devices. To learn more about the benefits of edge processing, see What is Azure IoT Edge.
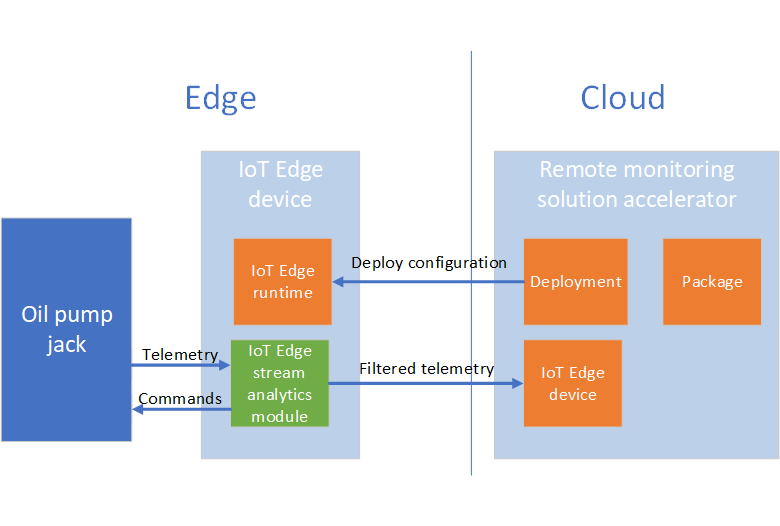
To introduce edge processing with remote monitoring, this tutorial uses a simulated oil pump jack device. This oil pump jack is managed by an organization called Contoso and is connected to the Remote Monitoring solution accelerator. Sensors on the oil pump jack measure temperature and pressure. Operators at Contoso know that an abnormal increase in temperature can cause the oil pump jack to slow down. Operators at Contoso don't need to monitor the device's temperature when it's within its normal range.
Contoso wants to deploy an intelligent edge module to the oil pump jack that detects temperature anomalies. Another edge module sends alerts to the Remote Monitoring solution. When an alert is received, a Contoso operator can dispatch a maintenance technician. Contoso could also configure an automated action, such as sending an email, to run when the solution receives an alert.
The following diagram shows the key components in the tutorial scenario:
In this tutorial, you:
- Add an IoT Edge device to the solution
- Create an Edge manifest
- Import the manifest as a package that defines the modules to run on the device
- Deploy the package to your IoT Edge device
- View alerts from the device
On the IoT Edge device:
- The runtime receives the package and installs the modules.
- The stream analytics module detects temperature anomalies in the pump and sends commands resolve the issue.
- The stream analytics module forwards filtered data to the solution accelerator.
This tutorial uses a Linux virtual machine as an IoT Edge device. You also install an edge module to simulate the oil pump jack device.
If you don't have an Azure subscription, create a free account before you begin.
Prerequisites
To follow this tutorial, you need a deployed instance of the Remote Monitoring solution accelerator in your Azure subscription.
Use Azure Cloud Shell
Azure hosts Azure Cloud Shell, an interactive shell environment that you can use through your browser. You can use either Bash or PowerShell with Cloud Shell to work with Azure services. You can use the Cloud Shell preinstalled commands to run the code in this article without having to install anything on your local environment.
To start Azure Cloud Shell:
| Option | Example/Link |
|---|---|
| Select Try It in the upper-right corner of a code block. Selecting Try It doesn't automatically copy the code to Cloud Shell. |  |
| Go to https://shell.azure.com, or select the Launch Cloud Shell button to open Cloud Shell in your browser. |  |
| Select the Cloud Shell button on the menu bar at the upper right in the Azure portal. |  |
To run the code in this article in Azure Cloud Shell:
Start Cloud Shell.
Select the Copy button on a code block to copy the code.
Paste the code into the Cloud Shell session by selecting Ctrl+Shift+V on Windows and Linux or by selecting Cmd+Shift+V on macOS.
Select Enter to run the code.
Add an IoT Edge device
There are two steps to add an IoT Edge device to your Remote Monitoring solution accelerator. This section shows you how to use:
- Add an IoT Edge device on the Device Explorer page in the Remote Monitoring web UI.
- Install the IoT Edge runtime in a Linux virtual machine (VM).
Add an IoT Edge device to your solution
To add an IoT Edge device to the Remote Monitoring solution accelerator, navigate to the Device Explorer page in the web UI and click + New device.
In the New device panel, choose IoT Edge device and enter oil-pump as the device ID. You can leave the default values for the other settings. Then click Apply:

Make a note of the device connection string, you need it in the next section of this tutorial.
When you register a device with the IoT hub in the Remote Monitoring solution accelerator, it's listed on the Device Explorer page in the web UI:

To make it easier to manage the IoT Edge devices in the solution, create a device group and add the IoT Edge device:
Select the oil-pump device in the list on the Device Explorer page and then click Jobs.
Create a job to add the IsEdge tag to the device using the following settings:
Setting Value Job Tags Job Name AddEdgeTag Key IsOilPump Value Y Type Text 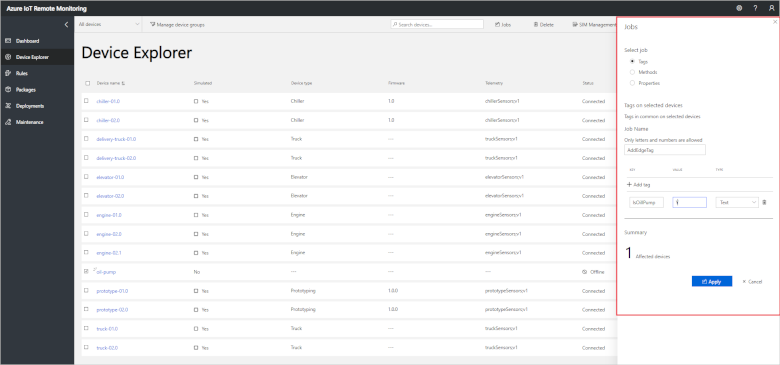
Click Apply, then Close.
On the Device Explorer page, click Manage device groups.
Click Create new device group. Create a new device group with the following settings:
Setting Value Name OilPumps Field Tags.IsOilPump Operator = Equals Value Y Type Text 
Click Save.


You IoT Edge device is now in the OilPumps group.
Install the Edge runtime
An Edge device requires the Edge runtime to be installed. In this tutorial, you install the Edge runtime in an Azure Linux VM to test the scenario. The following steps use the Azure cloud shell in install and configure the VM:
To create a Linux VM in Azure, run the following commands. You can use a location close to where you are:
az group create \
  --name IoTEdgeDevices \
  --location eastus
az vm create \
  --resource-group IoTEdgeDevices \
  --name EdgeVM \
  --image microsoft_iot_edge:iot_edge_vm_ubuntu:ubuntu_1604_edgeruntimeonly:latest \
  --admin-username azureuser \
  --generate-ssh-keys \
  --size Standard_B1ms
To configure the Edge runtime with the device connection string, run the following command using the device connection string you made a note of previously:
az vm run-command invoke \
  --resource-group IoTEdgeDevices \
  --name EdgeVM \
  --command-id RunShellScript \
  --scripts 'sudo /etc/iotedge/configedge.sh "YOUR_DEVICE_CONNECTION_STRING"'
Be sure to include your connection string inside double-quotation marks.
You've now installed and configured the IoT Edge runtime on a Linux device. Later in this tutorial, you use the Remote Monitoring solution to deploy IoT Edge modules to this device.
Create an Edge manifest
To simulate the oil jack pump device, you need to add the following modules to your Edge device:
- Temperature simulation module.
- Azure Stream Analytics anomaly detection.
The following steps show you how to create an Edge deployment manifest that includes these modules. Later in this tutorial you import this manifest as a package in the Remote Monitoring solution accelerator.
Create the Azure Stream Analytics job
You define the Stream Analytics job in the portal before packaging it as an Edge module.
In the Azure portal, create an Azure storage account using the default options in the IoTEdgeDevices resource group. Make a note of the name you chose.
In the Azure portal, create a Stream Analytics Job in the IoTEdgeDevices resource group. Use following configuration values:
Option Value Job name EdgeDeviceJob Subscription Your Azure subscription Resource group IoTEdgeDevices Location East US Hosting environment Edge Streaming units 1 Open the EdgeDeviceJob Stream Analytics job in the portal, click Inputs, and add an Edge Hub stream input called telemetry.
In the EdgeDeviceJob Stream Analytics job in the portal, click Outputs and add an Edge Hub output called output.
In the EdgeDeviceJob Stream Analytics job in the portal, click Outputs and add a second Edge Hub output called alert.
In the EdgeDeviceJob Stream Analytics job in the portal, click Query and add the following select statement:
SELECT
avg(machine.temperature) as temperature,
'F' as temperatureUnit
INTO output
FROM telemetry TIMESTAMP BY timeCreated
GROUP BY TumblingWindow(second, 5)
SELECT 'reset' as command
INTO alert
FROM telemetry TIMESTAMP BY timeCreated
GROUP BY TumblingWindow(second, 3)
HAVING avg(machine.temperature) > 400
In the EdgeDeviceJob Stream Analytics job in the portal, click Storage account settings. Add the storage account you added to the IoTEdgeDevices resource group as the start of this section. Create a new container called edgeconfig.
The following screenshot shows the saved Stream Analytics job:

You've now defined a Stream Analytics job to run on your edge device. The job calculates average temperature over a 5-second window. The job also sends an alert if the average temperature in a 3-second window goes above 400.
Create the IoT Edge deployment
Next, you create an IoT Edge deployment manifest that defines the modules to run on your Edge device. In the next section, you import this manifest as a package in the Remote Monitoring solution.
In the Azure portal, navigate to the IoT hub in your Remote Monitoring solution. You can find the IoT hub in the resource group that has the same name as your Remote Monitoring solution.
In the IoT hub, click IoT Edge in the Automatic Device Management section. Click Add an IoT Edge deployment.
On the Create Deployment > Name and Label page, enter the name oil-pump-device. Click Next.
On the Create Deployment > Add Modules page, click + Add. Choose IoT Edge Module.
In the IoT Edge Custom Modules panel, enter temperatureSensor as the name, and asaedgedockerhubtest/asa-edge-test-module:sensor-ad-linux-amd64 as the image URI. Click Save.
On the Create Deployment > Add Modules page, click + Add to add a second module. Choose Azure Stream Analytics Module.
In the Edge deployment panel, select your subscription and the EdgeDeviceJob you created in the previous section. Click Save.
On the Create Deployment > Add Modules page, click Next.
On the Create Deployment > Specify Routes page, add the following code:
{
  "routes": {
    "alertsToReset": "FROM /messages/modules/EdgeDeviceJob/outputs/alert INTO BrokeredEndpoint(\"/modules/temperatureSensor/inputs/control\")",
    "telemetryToAsa": "FROM /messages/modules/temperatureSensor/* INTO BrokeredEndpoint(\"/modules/EdgeDeviceJob/inputs/telemetry\")",
    "ASAToCloud": "FROM /messages/modules/EdgeDeviceJob/* INTO $upstream"
  }
}
This code routes the output from the Stream Analytics module to the correct locations.
Click Next.
On the Create Deployment > Specify Metrics page, click Next.
On the Create Deployment > Target Devices page, enter 10 as the priority. Click Next.
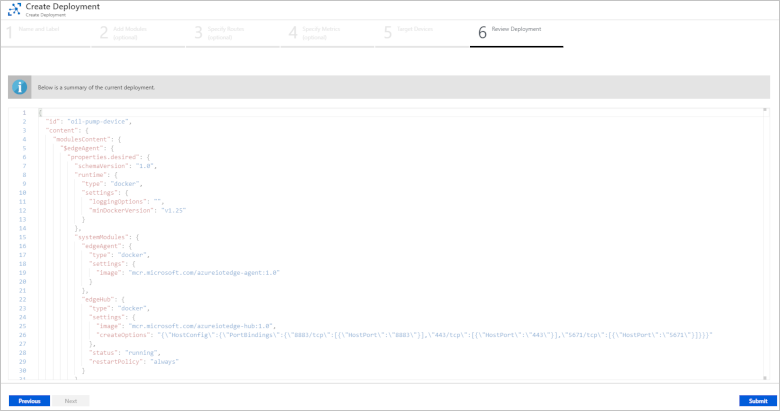
On the Create Deployment > Review Deployment page, click Submit:
On the main IoT Edge page, click IoT Edge deployments. You can see oil-pump-device in the list of deployments.
Click the oil-pump-device deployment and then click Download IoT Edge manifest. Save the file as oil-pump-device.json to a suitable location on your local machine. You need this file in the next section of this tutorial.

You've now created an IoT Edge manifest to import into the Remote Monitoring solution as a package. Typically, a developer creates the IoT Edge modules and manifest file.
Import a package
In this section, you import the Edge manifest as a package in the Remote Monitoring solution.
In the Remote Monitoring web UI, navigate to the Packages page and click + New Package:
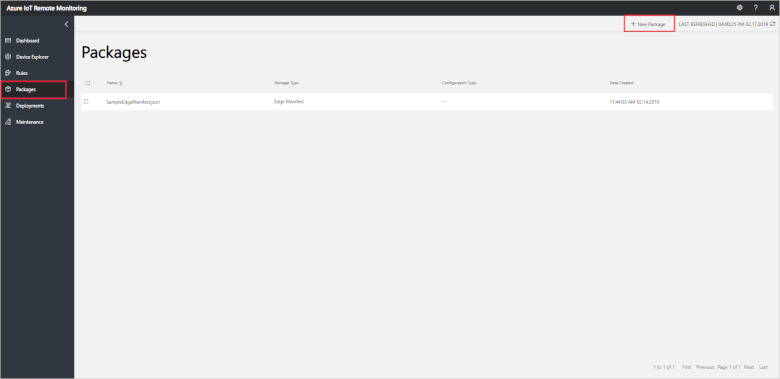
On the New Package panel, choose Edge Manifest as the package type, click Browse to find the oil-pump-device.json file on your local machine, and click Upload:
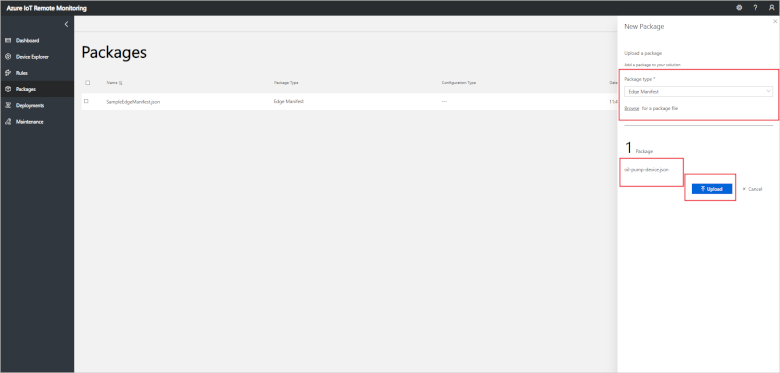
The list of packages now includes the oil-pump-device.json package.


In the next section, you create a deployment that applies the package to your Edge device.
Deploy a package
Now you're ready to deploy the package to your device.
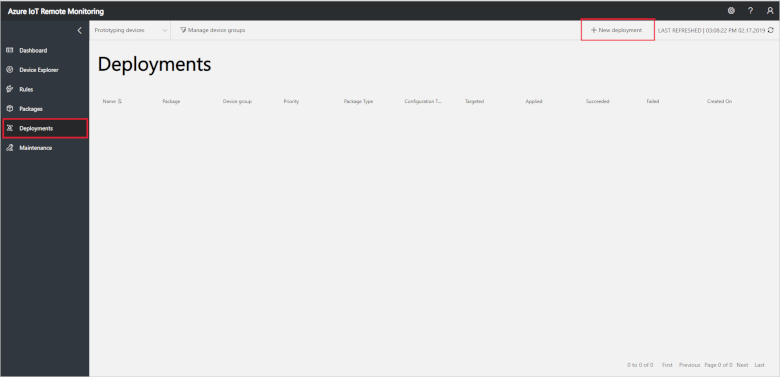
In the Remote Monitoring web UI, navigate to the Deployments page and click + New deployment:
In the New deployment panel, create a deployment with the following settings:
Option Value Name OilPumpDevices Package type Edge Manifest Package oil-pump-device.json Device Group OilPumps Priority 10 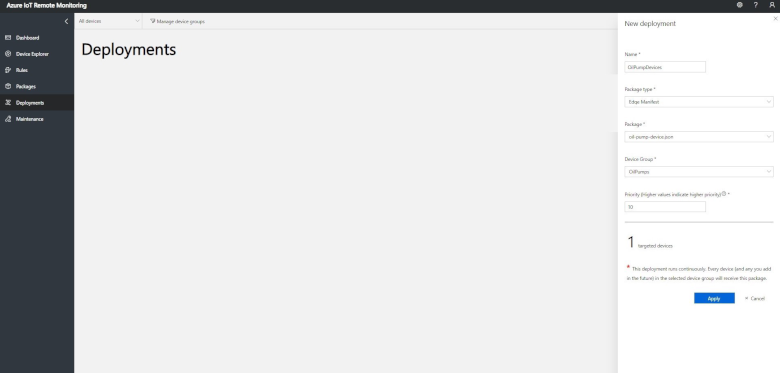
Click Apply.


You need to wait several minutes for the package to deploy to your device and for telemetry to start flowing from the device.

The Deployments page shows the following metrics:
- Targeted shows the number of devices in the device group.
- Applied shows the number of devices that have had the deployment content applied.
- Succeeded shows the number of Edge devices in the deployment reporting success from the IoT Edge client runtime.
- Failed shows the number of Edge devices in the deployment reporting failure from the IoT Edge client runtime.
Monitor the device
You can view the temperature telemetry from your oil pump device in the Remote Monitoring web UI:
Navigate to the Device Explorer page and select your oil pump device.
In the Telemetry section of the Device details panel, click Temperature:
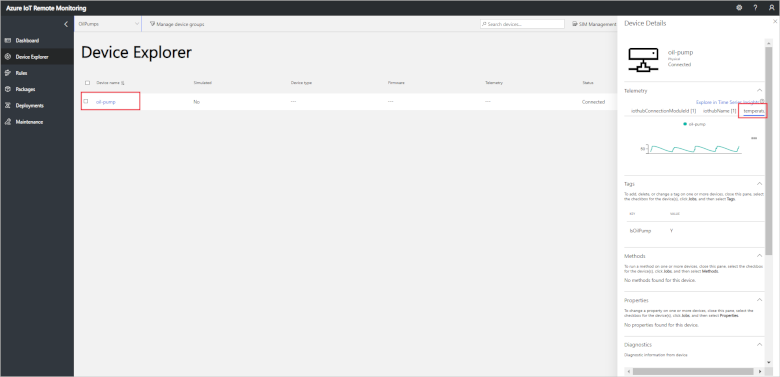

You can see how the temperature rises until it reaches a threshold. The Stream Analytics Edge module detects when the temperature reaches this threshold and sends a command to the device to reduce the temperature immediately. All of this processing happens on the device without communicating with the cloud.
If you want to notify operators when the threshold was reached, you can create a rule in the Remote Monitoring web UI:
Navigate to the Rules page and click + New rule.
Create a new rule with the following settings:
Option Value Rule name Oil pump temperature Description Oil pump temperature exceeded 300 Device group OilPumps Calculation Instant Field temperature Operator > Value 300 Severity level Info 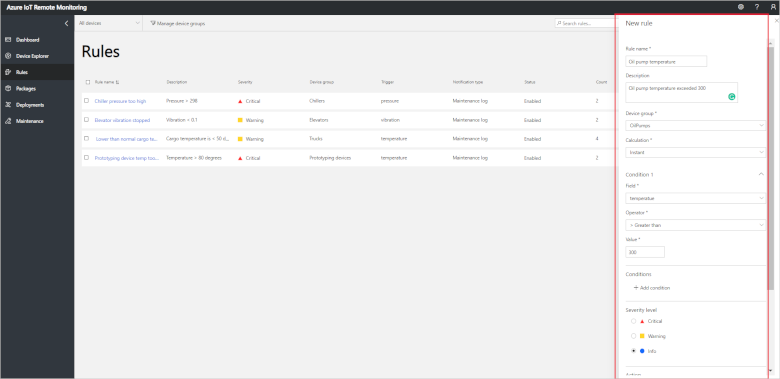
Click Apply.
Navigate to the Dashboard page. An alert shows in the Alerts panel when the temperature in the oil-pump device goes over 300.

Next steps
This tutorial showed you how to add and configure an IoT Edge device in the Remote Monitoring solution accelerator. To learn more about working with IoT Edge packages in the Remote Monitoring solution, see the following how-to guide:
To learn more about installing the IoT Edge runtime, see Install the Azure IoT Edge runtime on Linux (x64).
To learn more about Azure Stream Analytics on Edge devices, see Deploy Azure Stream Analytics as an IoT Edge module.