Azure Maps HTML Marker Layer module
An Azure Maps Web SDK module that provides a layer that renders point data from a data source as HTML elements on the map. This layer works with both GeoJSON based and Vector tile based data sources.
Only Point features will be rendered and not any points from other feature types.
Note that this is an experimental library that attempts to achieve the following:
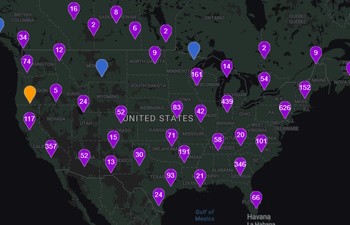
- Power the creation of HTML markers with a data sources, and thus unlock the benifits of using data sources, usch as clustering, for HTML markers.
- Support larger data sets by dynamically adding/removing items based on the map view, thus increasing potential performance of using HTML markers.
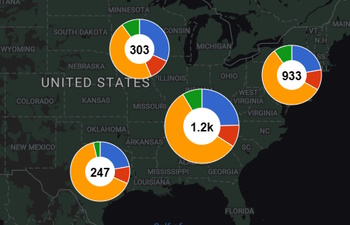
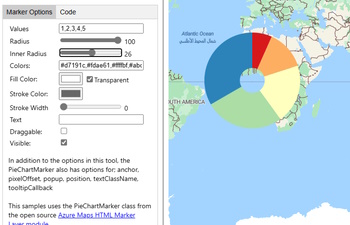
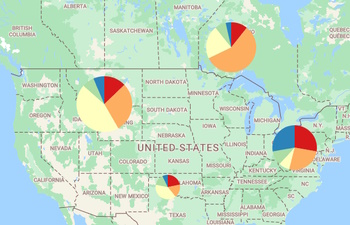
- Add a way to create fully interactive pie charts as markers on the map.
- Create consistency with how other things are rendered with layers in Azure Maps.
Getting started
Download the project and copy the azure-maps-html-marker-layer JavaScript file from the dist folder into your project.
See the documentation for more details on a specific feature or take a look at one of the samples below.
Samples
Clustered Pie Chart HTML Markers
HTML Marker layer and vector tiles

Alternative solution
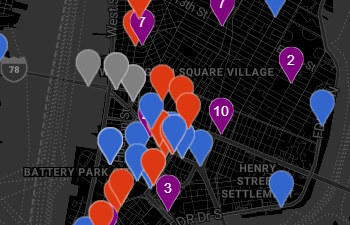
If you simply want to be able to cluster HTML Markers, you can leverage a library like Supercluster to achieve this in Azure Maps. Here is an example:
<!DOCTYPE html>
<html lang="en">
<head>
    <title></title>
    <meta charset="utf-8" />
    <meta name="viewport" content="width=device-width, initial-scale=1, shrink-to-fit=no" />

    <!-- Add references to the Atlas Map control JavaScript and CSS files. -->
    <link href="https://atlas.microsoft.com/sdk/javascript/mapcontrol/2/atlas.min.css" rel="stylesheet" />
    <script src="https://atlas.microsoft.com/sdk/javascript/mapcontrol/2/atlas.min.js"></script>

    <!-- Add a reference to the Supercluster library -->
    <script src="https://unpkg.com/supercluster@7.1.2/dist/supercluster.min.js"></script>

    <script>
        var map, superCluster;

        var earthquakeFeed = "https://earthquake.usgs.gov/earthquakes/feed/v1.0/summary/all_month.geojson";

        function GetMap() {
            //Initialize a map instance.
            map = new atlas.Map('myMap', {
                view: 'Auto',

                authOptions: {
                    authType: 'subscriptionKey',
                    subscriptionKey: '<Your Azure Maps Key>'
                }
            });

            //Wait until the map resources are ready.
            map.events.add('ready', function () {

                //Create a cluster instance.
                superCluster = new Supercluster({
                    radius: 35,
                    maxZoom: 18
                });

                //Add a map move event to re-render the clusters as the map moves.
                //For added performance, use 'moveend' event instead. Markers will snap into view when the map is done moving rather than constantly being rendered as the map moves.
                map.events.add('move', render);

                //Load data
                fetch(earthquakeFeed).then(r => r.json()).then(r => {
                    //Load data into the super cluster.
                    superCluster.load(r.features);

                    //Render initial state.
                    render();
                });
            });
        }

        function render() {
            //Get the map's camera information.
            var cam = map.getCamera();

            //Get clusters for the current map's bounding box, and rounding zoom level (super cluster only supports integer zoom levels).
            var points = superCluster.getClusters(cam.bounds, Math.round(cam.zoom));

            //Loop through the clustered points and create HTML markers.
            var markers = [];
            points.forEach(p => {
                var m = new atlas.HtmlMarker({
                    position: p.geometry.coordinates,
                    text: (p.properties.cluster) ? p.properties.point_count_abbreviated : '',
                    color: (p.properties.cluster) ? 'red' : 'DodgerBlue'
                });

                //Copy over id's and properties.
                m.id = p.id;
                m.properties = p.properties;

                markers.push(m);
            });

            //Clear the markers that are on the map and add the new set of markers.
            map.markers.clear();
            map.markers.add(markers);
        }
    </script>
    <style>
        body, html {
            margin: 0;
            padding: 0;
            width: 100%;
            height: 100%;
        }

        #myMap {
            width: 100%;
            height: 100%;
        }
    </style>
</head>
<body onload="GetMap()">
    <div id="myMap"></div>
</body>
</html>
Related Projects
- Azure Maps Web SDK Open modules - A collection of open source modules that extend the Azure Maps Web SDK.
- Azure Maps Web SDK Samples
- Azure Maps Gov Cloud Web SDK Samples
- Azure Maps & Azure Active Directory Samples
- List of open-source Azure Maps projects
Additional Resources
Contributing
We welcome contributions. Feel free to submit code samples, file issues and pull requests on the repo and we'll address them as we can. Learn more about how you can help on our Contribution Rules & Guidelines.
You can reach out to us anytime with questions and suggestions using our communities below:
This project has adopted the Microsoft Open Source Code of Conduct. For more information, see the Code of Conduct FAQ or contact opencode@microsoft.com with any additional questions or comments.
License
MIT
See License for full license text.