Monitor Cloud Connector using Operations Management Suite (OMS)
Important
Cloud Connector Edition will retire July 31, 2021 along with Skype for Business Online. Once your organization has upgraded to Teams, learn how to connect your on-premises telephony network to Teams using Direct Routing.
Read this article to learn how to monitor your Cloud Connector version 2.1 and later deployment by using Microsoft Operations Management Suite (OMS).
You can now monitor your Cloud Connector version 2.1 and later deployment by using Operations Management Suite (OMS), a Microsoft cloud IT management solution. OMS Log Analytics enables you to monitor and analyze the availability and performance of resources including physical and virtual machines. For more information about OMS and Log Analytics, see What is Operations Management Suite (OMS)?
This article contains the following sections:
Prerequisites
Configure Cloud Connector to use OMS
Configure OMS
Analyze the alerts in your Log Analytics repository
Recommended monitoring set
Prerequisites
Before you can use OMS to monitor your Cloud Connector deployment, you'll need the following:
An Azure account and an OMS workspace. If you don't already have an Azure account, you need to create one to use OMS Log Analytics. For information about how to create an Azure account and set up an OMS workspace, see Get started with a Log Analytics workspace.
Cloud Connector version 2.1 or later
Log Analytics new log search is required for Cloud Connector monitoring. For more information, see Upgrade your Azure Log Analytics workspace to new log search.
Configure Cloud Connector to use OMS
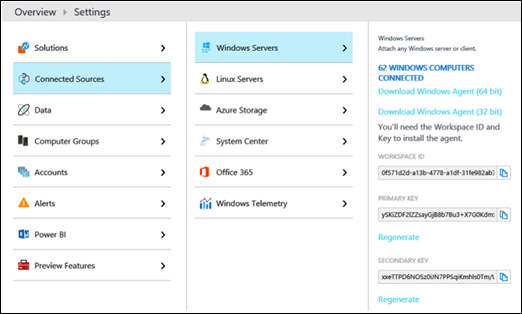
You'll need to configure your Cloud Connector on-premises environment to use OMS. To do this, you need your OMS workspace ID and key, which you can find by using the OMS portal as follows: Settings -->Connected Sources --> Windows Servers:
How you configure Cloud Connector to use OMS depends on your scenario:
If you are installing a new Cloud Connector appliance or you want to re-deploy an appliance, follow these steps before you run Install-CcAppliance:
In the CloudConnector.ini file [Common] section, set the OMSEnabled parameter to True.
Each time Cloud Connector is deployed or upgraded, it tries to install the OMS agent automatically onto the VMs. Enable this feature so the OMS agent can survive the Cloud Connector automatic update.
To configure the OMS ID and key, run Set-CcCredential -AccountType OMSWorkspace.
If you are installing an OMS agent onto an existing Cloud Connector appliance, follow these steps:
In the CloudConnector.ini file [Common] section, set OMSEnabled=true.
Run Import-CcConfiguration.
Run Install-CcOMSAgent.
Note
If the OMSWorkspace credential has never been set, you are prompted for the credential when you run install-CcOMSAgent.
If you want to update the OMS workspace ID or key in a Cloud Connector appliance that has already installed an OMS agent:
To configure the OMS ID and key, run Set-CcCredential -AccountType OMSWorkspace.
To apply the updates, run Install-CcOMSAgent.
For all scenarios, verify that the agents are connected as follows:
In the OMS portal, go to Settings -> Connected Sources -> Windows Servers. You see a list of connected machines.
Configure OMS
Next, you need to specify your OMS configuration by using the OMS portal. Specifically, you need to:
Specify information about event logs and performance counters.
Create alerts.
Specify information about event logs and performance counters
In the OMS portal, you must specify information about the event logs and performance counters as follows:
Go to Settings->Data->Windows Event logs, and add event logs for:
Lync Server
Application
Note
You must manually enter Lync Server in the text box. It does not appear as an option in the drop-down list.
For more information, see Windows event log data sources in Log Analytics
Go to Settings->Data-> Windows Performance Counters, and add performance counters for:
OS level counters. You can add OS level counters, such as processor usage, memory usage, network usage, or you can use existing solutions such as Capacity and Performance, Network Performance Monitor without adding counters explicitly. No matter how you decide to monitor them, Microsoft recommends that you monitor these OS counters.
Skype for Business counters. There are numerous counters provided by Skype for Business. You can find these counters by logging on to any Mediation Server and opening the Performance Monitor. These counters start with "LS:". Microsoft recommends that you start with the following capacity counters at a minimum, and add others that are of interest:
Total active calls:
LS:MediationServer - Inbound Calls(_Total)- Current
LS:MediationServer - Outbound Calls(_Total)- Current
Total active media bypass calls:
LS:MediationServer - Inbound Calls(_Total)- Active media bypass calls
LS:MediationServer - Outbound Calls(_Total)- Active media bypass calls
Note
You must manually enter the performance counters in the text box. They do not appear as options in the drop-down list.
For more information, see Windows and Linux performance data sources in Log Analytics
Create alerts
There are two types of alerts in OMS: Number of results alerts and Metric measurement alerts. For more information about creating alerts, see Working with alert rules in Log Analytics.
You should consider the following when creating alerts:
Make sure the alert is a Number-of-results alert, which is the default selection.
The demo queries require that "Number of results" is set to "Greater than 0".
It's recommended that you set both Time window and Alert frequency to 5 minutes.
It is recommended that you don't enable "Suppress alerts" for demo alerts.
For typical alert scenarios, Microsoft recommends creating a pair of alerts: one error alert and one reset alert. For the error alert, select severity level Critical; for the reset alert, select severity level Informational.
The following sections describe how to create sample alerts.
Create an alert pair: "RTCMEDSRV is NOT running in Mediation Servers" and "RTCMEDSRV is back in running in Mediation Servers"
To create this alert pair:
The query for the error alert is:
Event | where Computer contains "MediationServer" | where EventLog == "Lync Server" and (EventID == 25002 or EventID == 25003) | summarize arg_max(TimeGenerated, EventID) by Computer | where EventID == 25003The query uses the computer filter where Computer contains "MediationServer" . The filter selects only the computer whose name contains the string "MediationServer".
You would replace the filter with your own computer filter or remove it. You can create complex string filters without regular expressions. You can also choose to use regular expressions. Moreover, you can create a computer group by saving a search query and using that group as your computer filter in your alert query. For more information, see Computer groups in Log Analytics log searches.
For each computer, the error query gets the last event log for both the RTCMEDSRV service start and service stop. It will return one log if the last event is the service stop event; it will return nothing if the last event is the service start event. In short, the query would return a list of servers whose RTCMEDSRV is stopped in the time window.
The query for the reset alert is:
Event | where Computer contains "MediationServer" | where EventLog == "Lync Server" and (EventID == 25002 or EventID == 25003) | summarize arg_max(TimeGenerated, EventID) by Computer | where EventID == 2500The reset query does exactly the opposite thing of the error query. For each computer, it will return one if the last event is the service start event; it will return nothing if the last event is the service stop event.
Create an alert pair: " Too many concurrent calls in Mediation Servers" and "Concurrent calls fall back to normal load"
To create this alert:
The query for the error alert is:
Perf | where Computer contains "MediationServer" | where (ObjectName == "LS:MediationServer - Outbound Calls" or ObjectName == "LS:MediationServer - Inbound Calls") | summarize arg_max(TimeGenerated, CounterValue) by ObjectName, Computer | summarize TotalCalls = sum(CounterValue) by Computer| where TotalCalls >= 500For each computer, the query will get the last counters for inbound call and outbound call and sum those two values. It will return one log if the sum value exceeds 500; it will return nothing if it doesn't. In short, the query would return a list of servers whose concurrent calls are too many in the time window.
The query for the reset alert is:
Perf | where Computer contains "MediationServer" | where (ObjectName == "LS:MediationServer - Outbound Calls" or ObjectName == "LS:MediationServer - Inbound Calls") | summarize arg_max(TimeGenerated, CounterValue) by ObjectName, Computer | summarize TotalCalls = sum(CounterValue) by Computer| where TotalCalls < 500The reset query does exactly the opposite thing of the error query. For each computer, the query will get the last counters for inbound call and outbound call and sum those two values. It will return one log if the sum value is less than 500; it will return nothing otherwise.
Create an alert: "CPU usage > 90 or RTCMEDIARELAY stopped in Servers" alert
To create this alert, the query is:
search *| where Computer contains "MediationServer" | where (Type == "Perf" or Type == "Event") | where ((ObjectName == "Processor" and CounterName == "% Processor Time") or EventLog == "Lync Server") | where (CounterValue > 90 or EventID == 22003)
The query will get all processor usage counter and service stop event from all computers and return one log if either processor usage exceeds 90% or service is ever stopped.
Analyze the alerts in your Log Analytics repository
To analyze the alerts in your repository, use the Alert Management solution. For more information, see Alert Management solution in Operations Management Suite (OMS)
Recommended minimal monitoring set
To identify issues with event logs and performance counters:
Event logs. For any issue, there should be an events pair, with one set of events to indicate something is wrong, while the other indicates that everything is well. For any given time period, it is the last event recorded that will indicate whether something is amiss for that time period.
Performance Counters. There should be a threshold for the monitored counters.
The following table lists the services that Microsoft recommends monitoring by listing the stop and start event IDs:
| Service Name |
Target Server Role |
Stop Event ID |
Start Event ID |
|---|---|---|---|
| RTCMEDSRV |
Mediation Server |
25003 |
25002 |
| RTCSRV |
Edge Server |
12289 |
12288 |
| RTCMRAUTH |
Edge Server |
19003 |
19002 |
| RTCMEDIARELAY |
Edge Server |
22003 |
22002 |
The following table lists the network issues that Microsoft recommends monitoring:
| Monitor Name |
Target Server Role |
Success Event ID expression |
Error Event ID expression |
Failure example |
|---|---|---|---|---|
| Mediation Server to gateway connectivity failure |
Mediation Server |
25062 | 25002 |
|
| Mediation Server to gateway call completion failure |
Mediation Server |
25064 | 25002 |
|
| Critical network problems |
Edge Server |
14353 | 12288 |
The following lists the call capacity counters that should be monitored. These numbers should be less that 500 for Cloud Connector standard edition; less than 50 for Cloud Connector minimum edition.
LS:MediationServer - Inbound Calls(_Total)- Current
LS:MediationServer - Outbound Calls(_Total)- Current
LS:MediationServer - Inbound Calls(_Total)- Active media bypass calls
LS:MediationServer - Outbound Calls(_Total)- Active media bypass calls
See also
For more information about working with OMS, see the following: