Analyze in Excel
Applies to:  SQL Server 2019 and later Analysis Services
Azure Analysis Services
Fabric/Power BI Premium
SQL Server 2019 and later Analysis Services
Azure Analysis Services
Fabric/Power BI Premium
In this lesson, you use the Analyze in Excel feature to open Microsoft Excel, automatically create a connection to the model workspace, and automatically add a PivotTable to the worksheet. The Analyze in Excel feature is meant to provide a quick and easy way to test the efficacy of your model design prior to deploying your model. You do not perform any data analysis in this lesson. The purpose of this lesson is to familiarize you, the model author, with the tools you can use to test your model design.
To complete this lesson, Excel must be installed on the same computer as Visual Studio.
Estimated time to complete this lesson: 5 minutes
Prerequisites
This article is part of a tabular modeling tutorial, which should be completed in order. Before performing the tasks in this lesson, you should have completed the previous lesson: Lesson 11: Create roles.
Browse using the Default and Internet Sales perspectives
In these first tasks, you browse your model by using both the default perspective, which includes all model objects, and also by using the Internet Sales perspective you created earlier. The Internet Sales perspective excludes the Customer table object.
To browse by using the Default perspective
Click Extensions > Model > Analyze in Excel.
In the Analyze in Excel dialog box, click OK.
Excel opens with a new workbook. A data source connection is created using the current user account and the Default perspective is used to define viewable fields. A PivotTable is automatically added to the worksheet.
In Excel, in the PivotTable Field List, notice the DimDate and FactInternetSales measure groups appear. The DimCustomer, DimDate, DimGeography, DimProduct, DimProductCategory, DimProductSubcategory, and FactInternetSales tables with their respective columns also appear.
Close Excel without saving the workbook.
To browse by using the Internet Sales perspective
Click Extensions > Model > Analyze in Excel.
In the Analyze in Excel dialog box, leave Current Windows User selected, then in the Perspective drop-down listbox, select Internet Sales, and then click OK.

In Excel, in PivotTable Fields, notice the DimCustomer table is excluded from the field list.
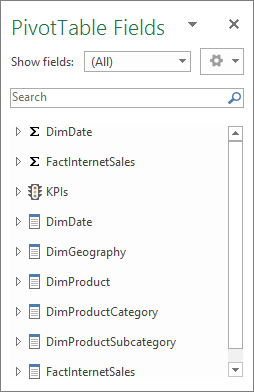
Close Excel without saving the workbook.
Browse by using roles
Roles are an important part of any tabular model. Without at least one role to which users are added as members, users cannot access and analyze data using your model. The Analyze in Excel feature provides a way for you to test the roles you have defined.
To browse by using the Sales Manager user role
Click Extensions > Model > Analyze in Excel.
In Specify the user name or role to use to connect to the model, select Role, and then in the drop-down listbox, select Sales Manager, and then click OK.
Excel opens with a new workbook. A PivotTable is automatically created. The Pivot Table Field List includes all the data fields available in your new model.
Close Excel without saving the workbook.
Next step
Go to the next lesson: Lesson 13: Deploy
Feedback
Coming soon: Throughout 2024 we will be phasing out GitHub Issues as the feedback mechanism for content and replacing it with a new feedback system. For more information see: https://aka.ms/ContentUserFeedback.
Submit and view feedback for