Create and run a notebook with Kqlmagic
Kqlmagic is a command that extends the capabilities of the Python kernel in Azure Data Studio notebooks. You can combine Python and Kusto query language (KQL) to query and visualize data using rich Plotly library integrated with render commands. Kqlmagic brings you the benefit of notebooks, data analysis, and rich Python capabilities all in the same location. Supported data sources with Kqlmagic include Azure Data Explorer, Application Insights, and Azure Monitor logs.
This article shows you how to create and run a notebook in Azure Data Studio using the Kqlmagic extension for an Azure Data Explorer cluster, an Application Insights log, and Azure Monitor logs.
Prerequisites
Install and set up Kqlmagic in a notebook
The steps in this section all run within an Azure Data Studio notebook.
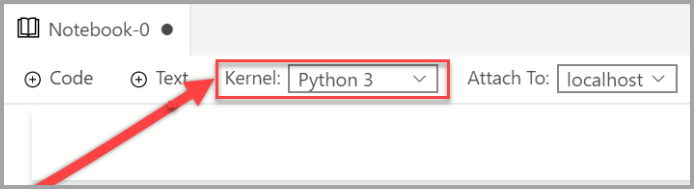
Create a new notebook and change the Kernel to Python 3.

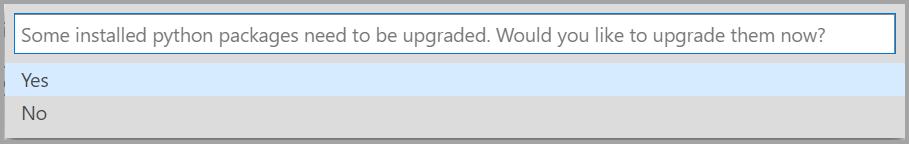
You may be prompted to upgrade your Python packages when your packages need updating.
Install Kqlmagic:
import sys
!{sys.executable} -m pip install Kqlmagic --no-cache-dir --upgrade
Verify it's installed:
import sys
!{sys.executable} -m pip list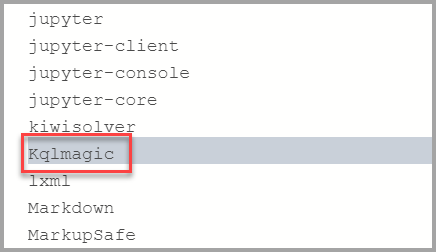
Load Kqlmagic:
%reload_ext KqlmagicNote
If this step fails, then close the file and reopen it.
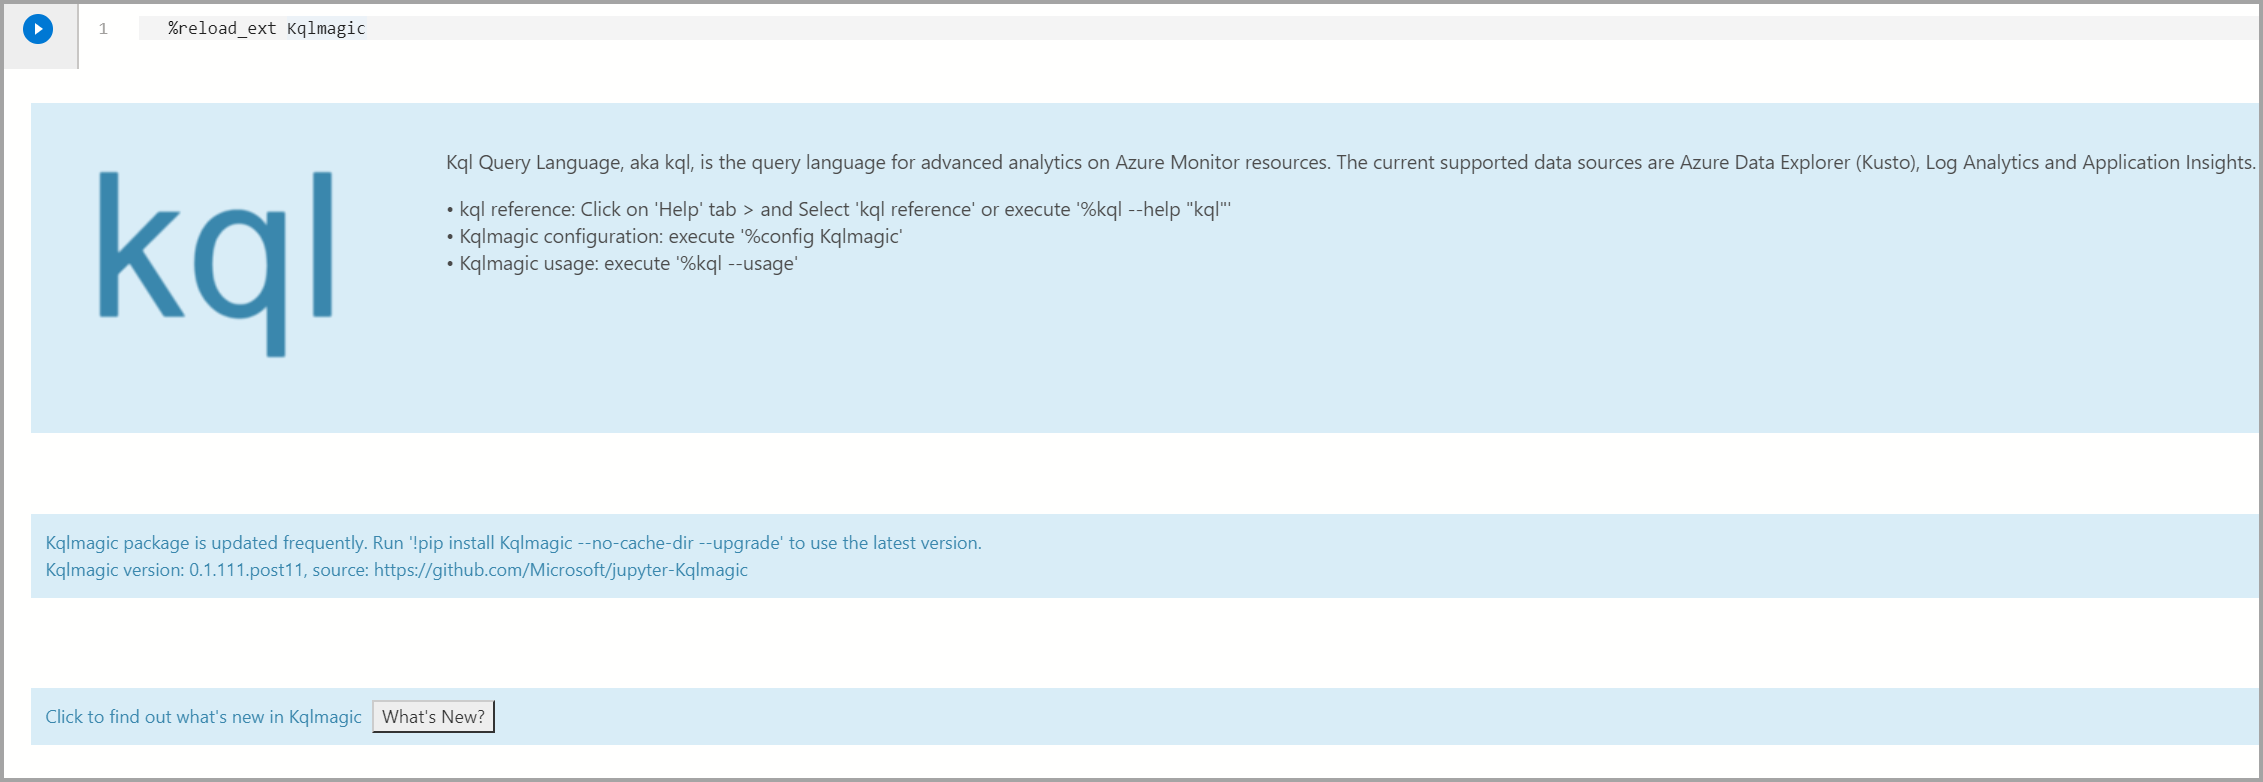
You can test if Kqlmagic is loaded properly by browsing the help documentation or by checking for the version.
%kql --help "help"Note
If
Samples@helpis asking for a password, then you can leave it blank and press Enter.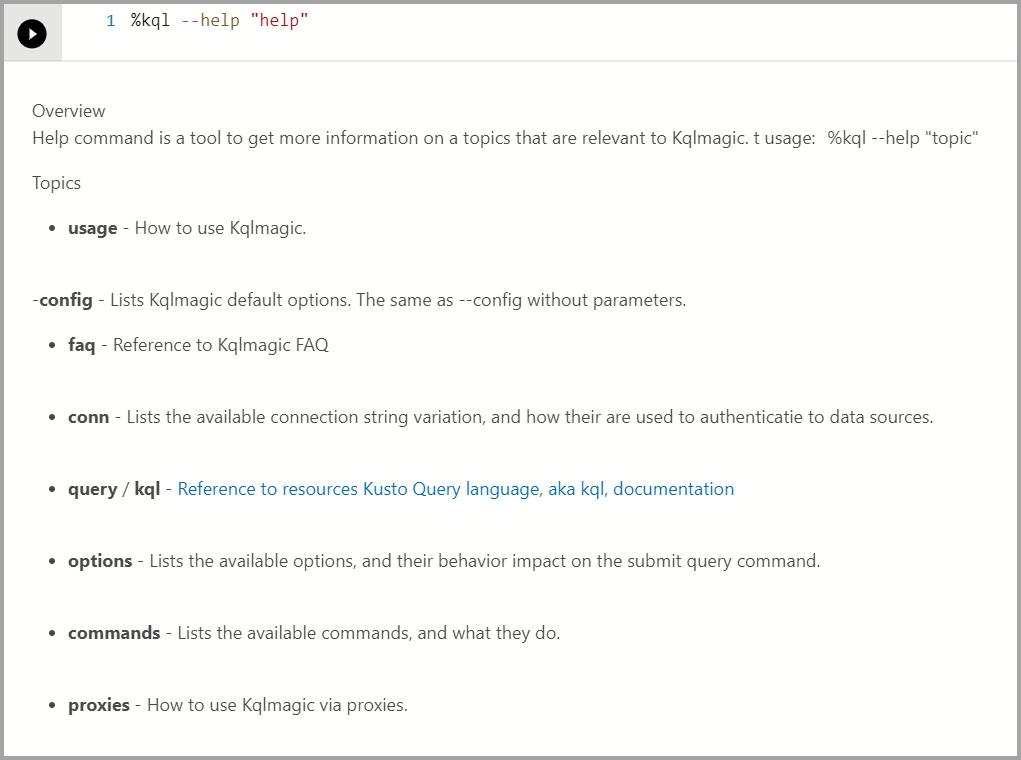
To see which version of Kqlmagic is installed, run the command below.
%kql --version
Kqlmagic with an Azure Data Explorer cluster
This section explains how to run data analysis using Kqlmagic with an Azure Data Explorer cluster.
Load and authenticate Kqlmagic for Azure Data Explorer
Note
Every time you create a new notebook in Azure Data Studio you must load the Kqlmagic extension.
Verify the Kernel is set to Python3.
Load Kqlmagic:
%reload_ext Kqlmagic
Connect to the cluster and authenticate:
%kql azureDataExplorer://code;cluster='help';database='Samples'Note
If you are using your own ADX cluster, you must include the region in the connection string as follows:
%kql azuredataexplorer://code;cluster='mycluster.westus';database='mykustodb'You use device sign-in to authenticate. Copy the code from the output and select authenticate which opens a browser where you need to paste the code. Once you authenticate successfully, you can come back to Azure Data Studio to continue with the rest of the script.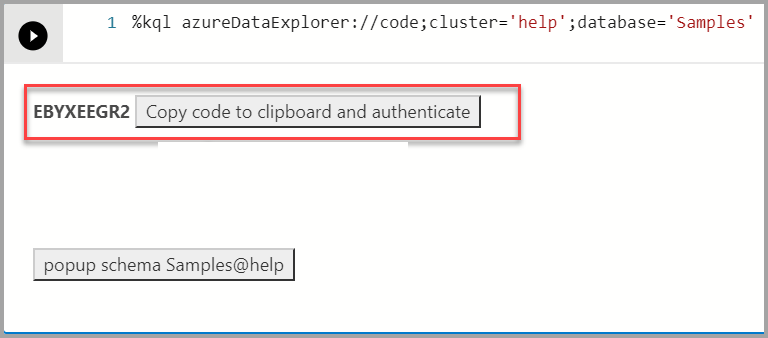
Query and visualize for Azure Data Explorer
Query data using the render operator and visualize data using the plotly library. This query and visualization supplies an integrated experience that uses native KQL.
Analyze top 10 storm events by state and frequency:
%kql StormEvents | summarize count() by State | sort by count_ | limit 10If you're familiar with the Kusto Query Language (KQL), you can type the query after
%kql.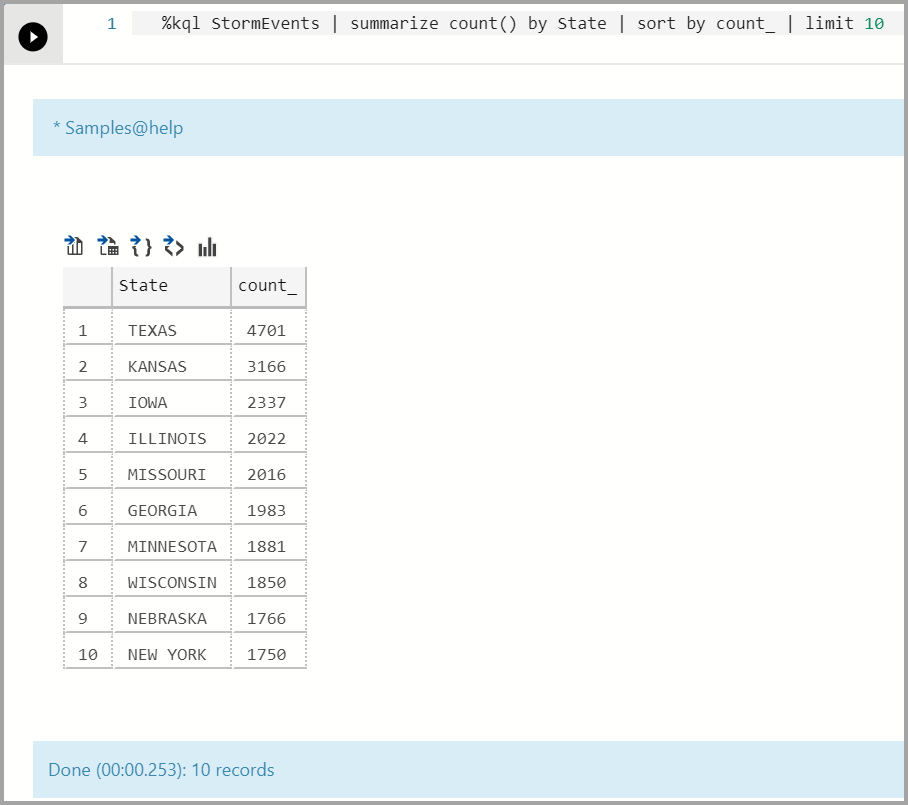
Visualize a timeline chart:
%kql StormEvents \
| summarize event_count=count() by bin(StartTime, 1d) \
| render timechart title= 'Daily Storm Events'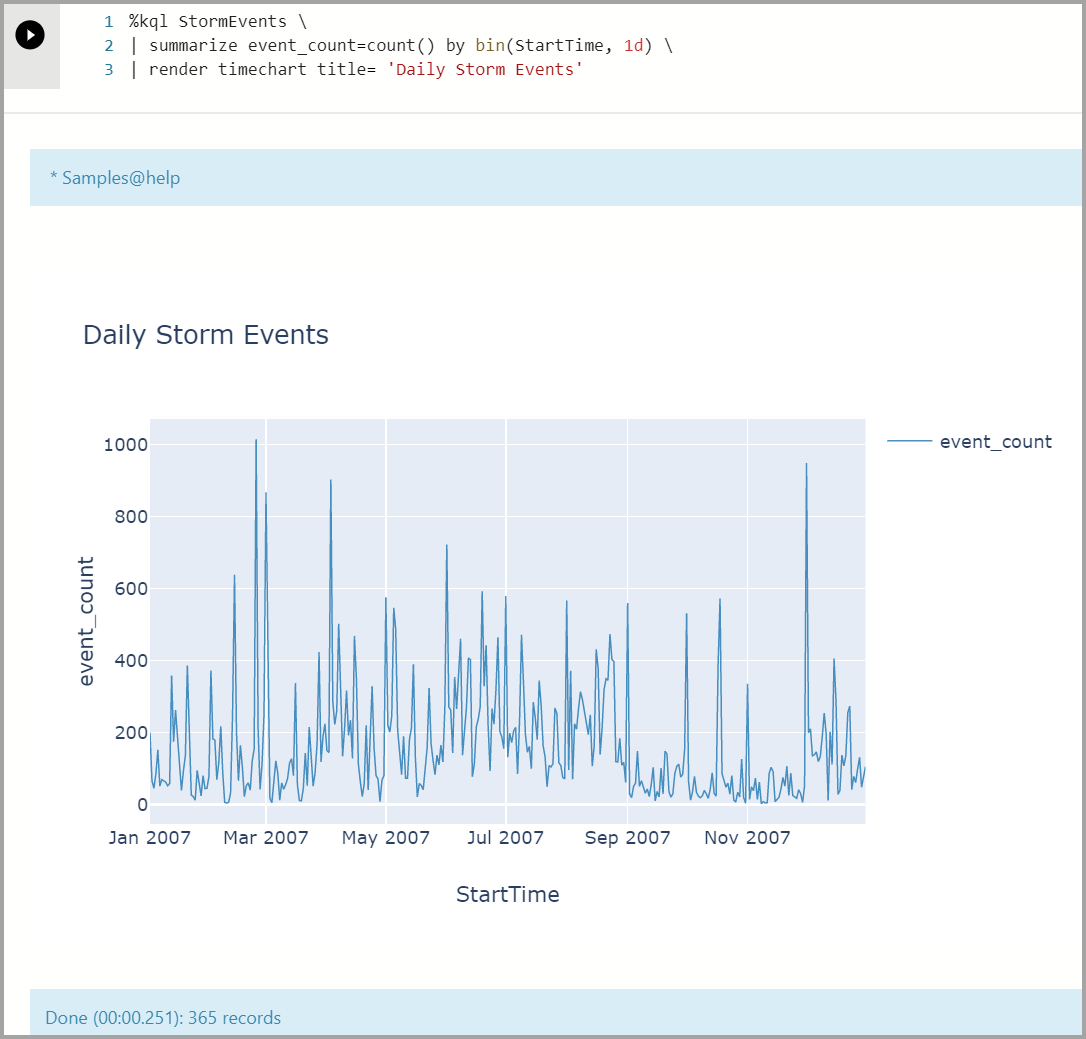
Multiline Query sample using
%%kql.%%kql StormEvents | summarize count() by State | sort by count_ | limit 10 | render columnchart title='Top 10 States by Storm Event count'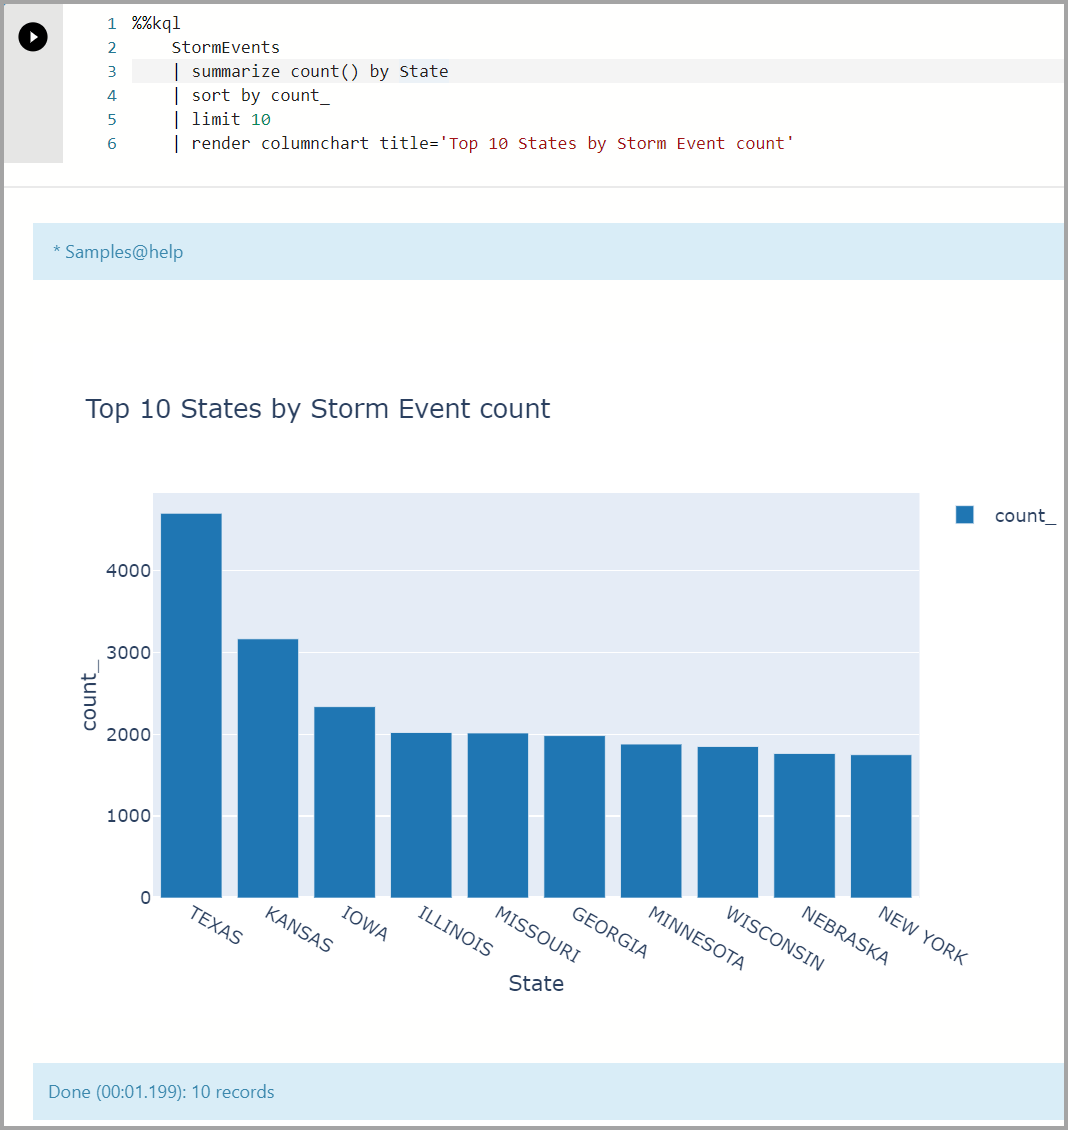
Kqlmagic with Application Insights
Load and authenticate Kqlmagic for Application Insights
Verify the Kernel is set to Python3.
Load Kqlmagic:
%reload_ext Kqlmagic
Note
Every time you create a new notebook in Azure Data Studio you must load the Kqlmagic extension.
Connect and authenticate.
First, you must generate an API key for your Application Insights resource. Then, use the Application ID and API key to connect to Application Insights from the notebook:
%kql appinsights://appid='DEMO_APP';appkey='DEMO_KEY'
Query and visualize for Application Insights
Query data using the render operator and visualize data using the plotly library. This query and visualization supplies an integrated experience that uses native KQL.
Show Page Views:
%%kql
pageViews
| limit 10
Note
Use your mouse to drag on an area of the chart to zoom in to the specific date(s).
Show Page views in a timeline chart:
%%kql
pageViews
| summarize event_count=count() by name, bin(timestamp, 1d)
| render timechart title= 'Daily Page Views'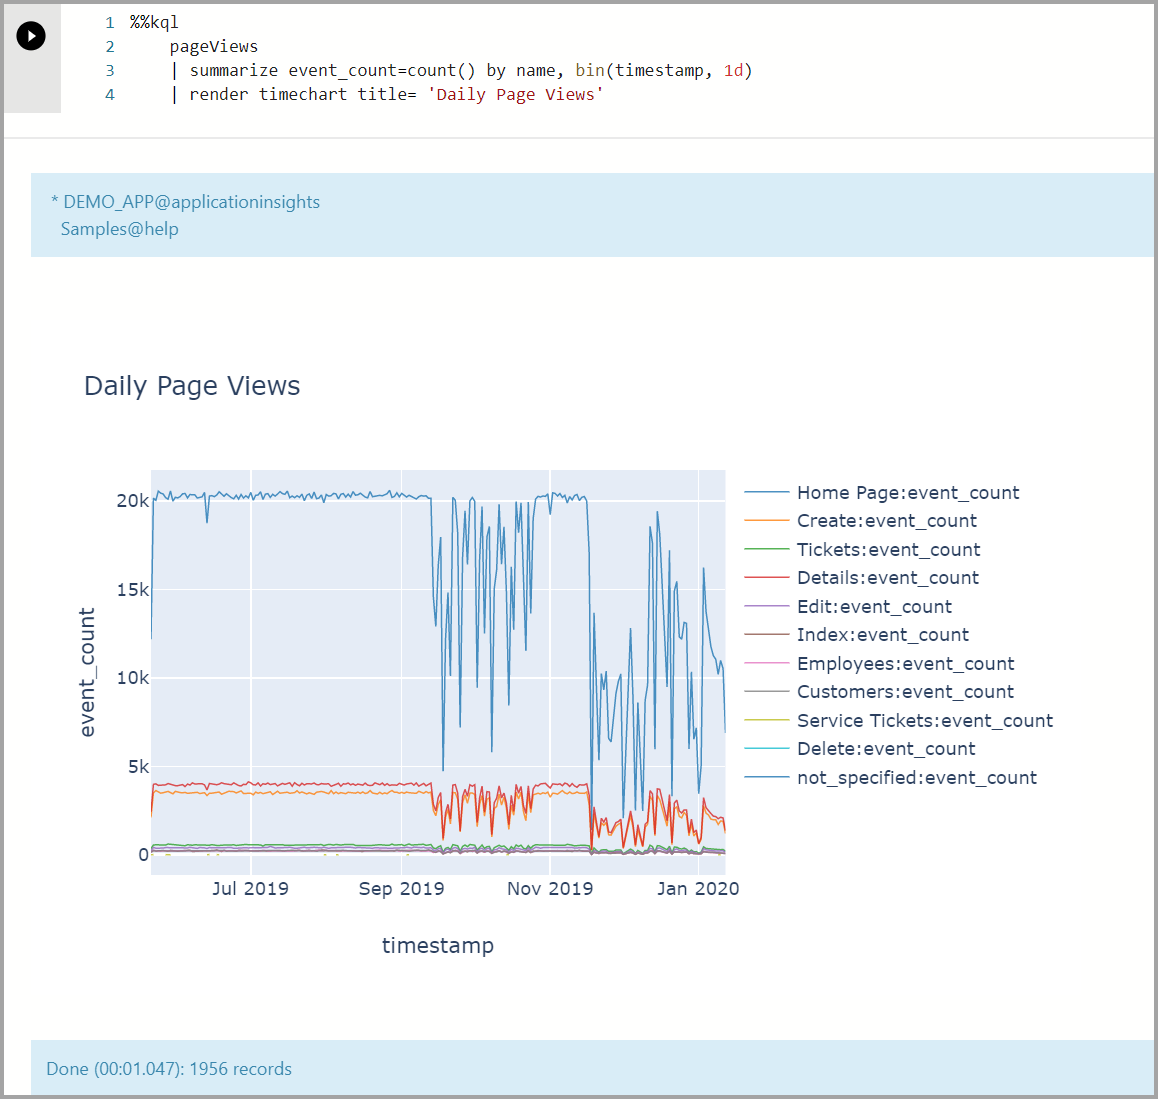
Kqlmagic with Azure Monitor logs
Load and authenticate Kqlmagic for Azure Monitor logs
Verify the Kernel is set to Python3.
Load Kqlmagic:
%reload_ext Kqlmagic
Note
Every time you create a new notebook in Azure Data Studio you must load the Kqlmagic extension.
Connect and authenticate:
%kql loganalytics://workspace='DEMO_WORKSPACE';appkey='DEMO_KEY';alias='myworkspace'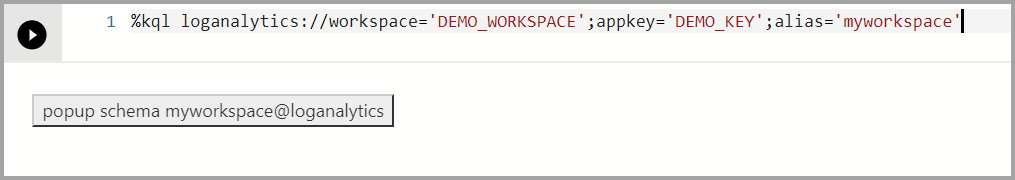
Query and visualize for Azure Monitor Logs
Query data using the render operator and visualize data using the plotly library. This query and visualization supplies an integrated experience that uses native KQL.
View a timeline chart:
%%kql
KubeNodeInventory
| summarize event_count=count() by Status, bin(TimeGenerated, 1d)
| render timechart title= 'Daily Kubernetes Nodes'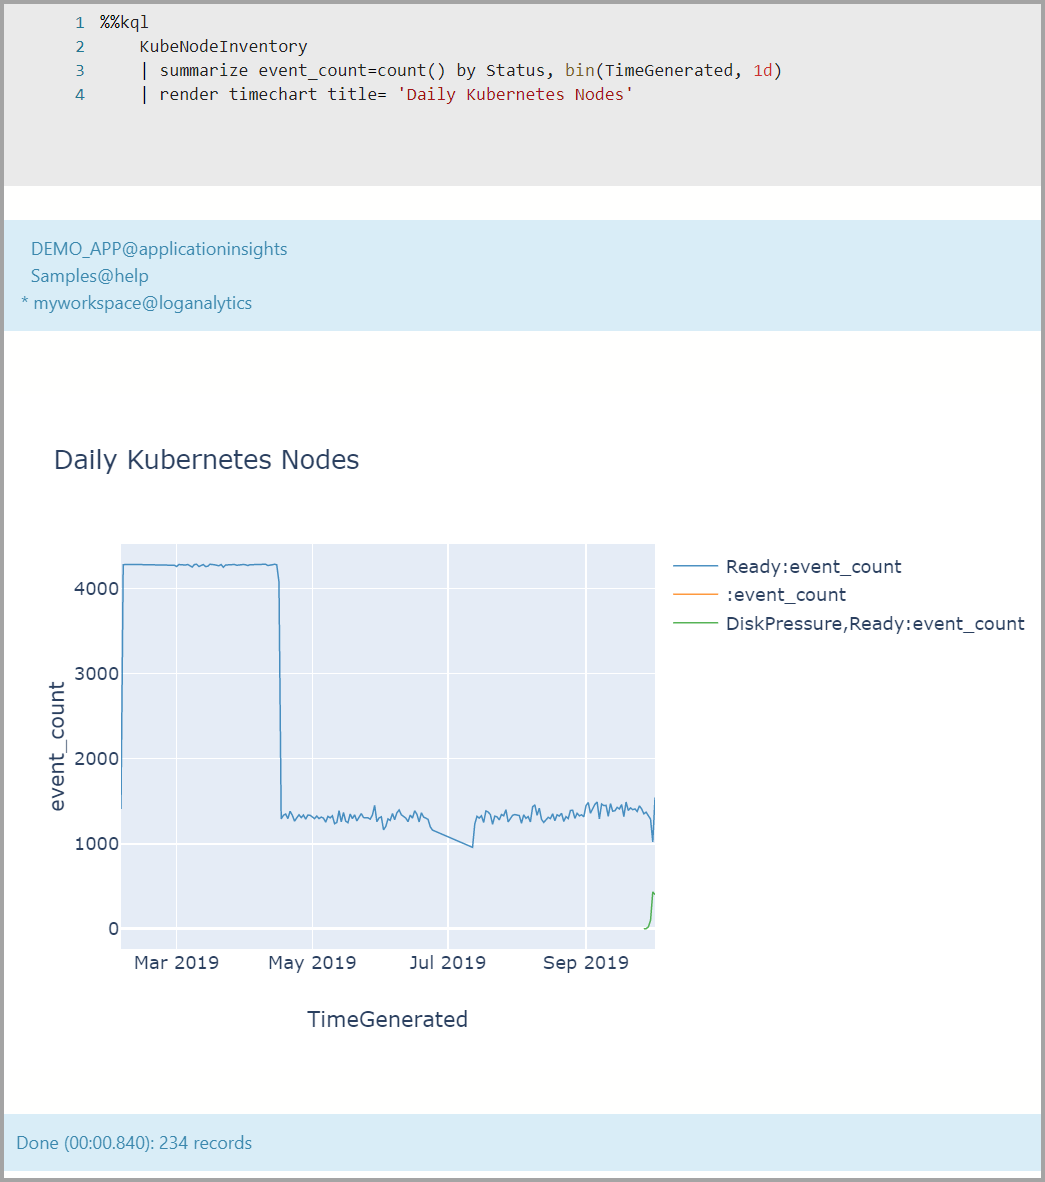
Next steps
Learn more about notebooks and Kqlmagic:
- Kusto (KQL) extension for Azure Data Studio (Preview)
- Create and run a Kusto (KQL) notebook (Preview)
- Use a Jupyter Notebook and Kqlmagic extension to analyze data in Azure Data Explorer
- Extension (Magic) to Jupyter Notebook and Jupyter lab that enable notebook experience working with Kusto Application Insights, and LogAnalytics data.
- Kqlmagic
- How to use notebooks in Azure Data Studio
Feedback
Coming soon: Throughout 2024 we will be phasing out GitHub Issues as the feedback mechanism for content and replacing it with a new feedback system. For more information see: https://aka.ms/ContentUserFeedback.
Submit and view feedback for