Tutorial: Add the five slowest queries sample widget to the database dashboard
This tutorial demonstrates the process of adding one of the built-in Azure Data Studio sample widgets to the database dashboard to quickly view a database's five slowest queries. You also learn how to view the details of the slow queries and query plans using Azure Data Studio features. During this tutorial, you learn how to:
- Enable Query Store on a database
- Add a pre-built insight widget to the database dashboard
- View details about the database's slowest queries
- View query execution plans for the slow queries
Azure Data Studio includes several insight widgets out-of-the-box. This tutorial shows how to add the query-data-store-db-insight widget, but the steps are basically the same for adding any widget.
Prerequisites
This tutorial requires the SQL Server or Azure SQL Database TutorialDB. To create the TutorialDB database, complete one of the following quickstarts:
Turn on Query Store for your database
The widget in this example requires Query Store to be enabled.
Right-click the TutorialDB database (in the SERVERS sidebar) and select New Query.
Paste the following Transact-SQL (T-SQL) statement in the query editor, and click Run:
ALTER DATABASE TutorialDB SET QUERY_STORE = ON
Add the slow queries widget to your database dashboard
To add the slow queries widget to your dashboard, edit the dashboard.database.widgets setting in your User Settings file.
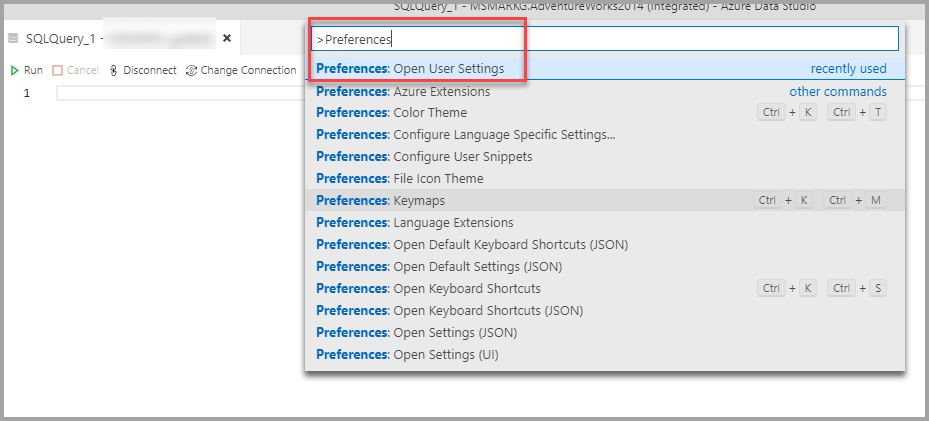
Open User Settings by pressing Ctrl+Shift+P to open the Command Palette.
Type settings in the search box and select Preferences: Open User Settings.
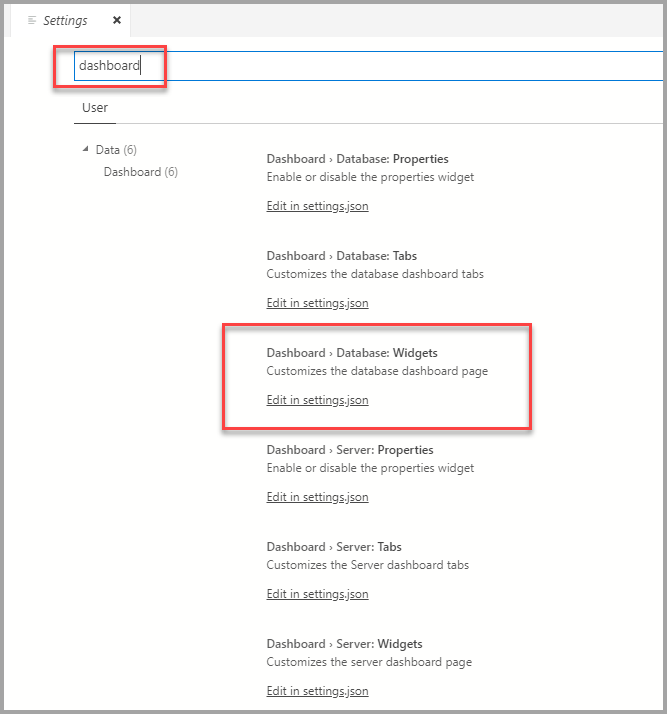
Type dashboard in the settings search box and locate dashboard.database.widgets, and then click edit in settings.json.
In settings.json, add the following code below:
"dashboard.database.widgets": [
    {
        "name": "slow queries widget",
        "gridItemConfig": {
            "sizex": 2,
            "sizey": 1
        },
        "widget": {
            "query-data-store-db-insight": null
        }
    },
    {
        "name": "Tasks",
        "gridItemConfig": {
            "sizex": 1,
            "sizey": 1
        },
        "widget": {
            "tasks-widget": {}
        }
    },
    {
        "gridItemConfig": {
            "sizex": 1,
            "sizey": 2
        },
        "widget": {
            "explorer-widget": {}
        }
    }
]
Press Ctrl+S to save the modified User Settings.
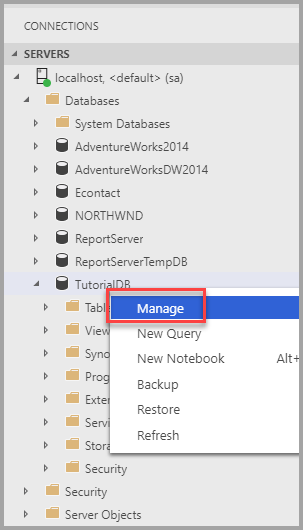
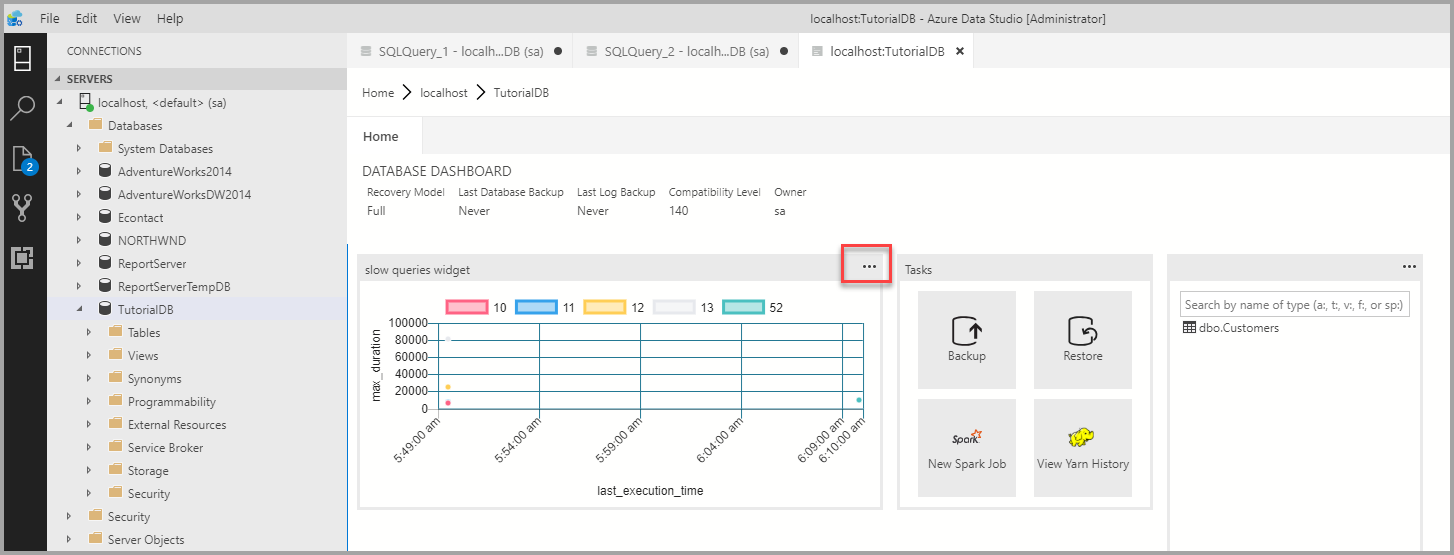
Open the Database dashboard by navigating to TutorialDB in the SERVERS sidebar, right-click, and select Manage.
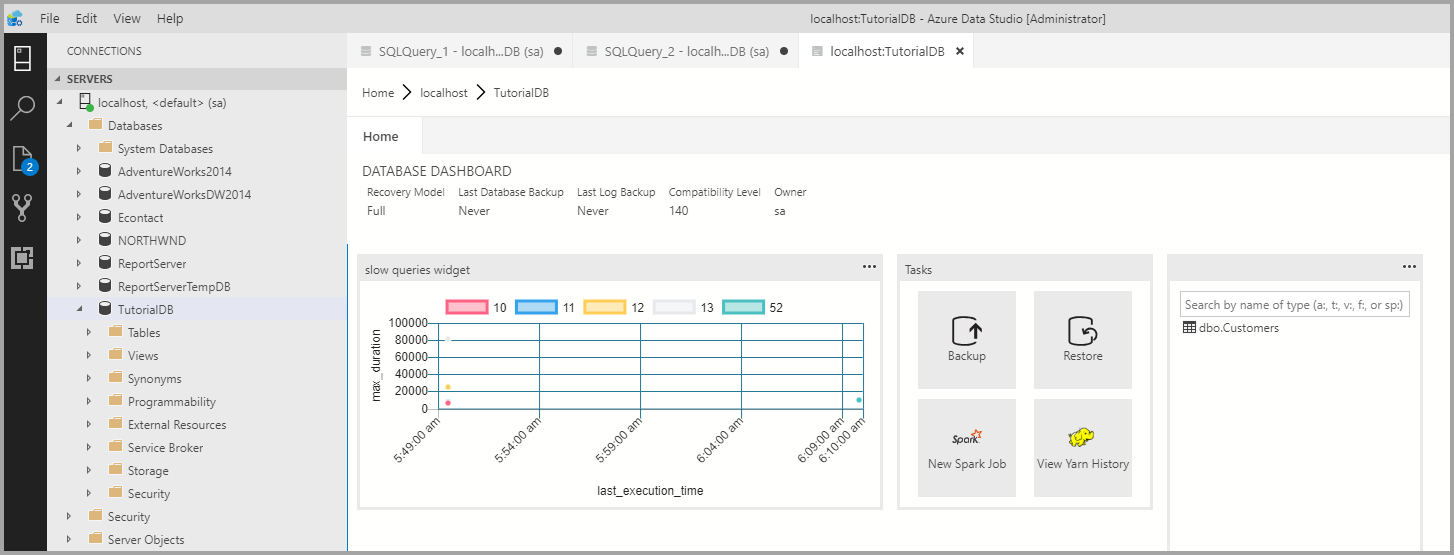
The insight widget appears on the dashboard:
View insight details for more information
To view additional information for an insight widget, click the ellipses (...) in the upper right, and select Show Details.
To show more details for an item, select any item in Chart Data list.
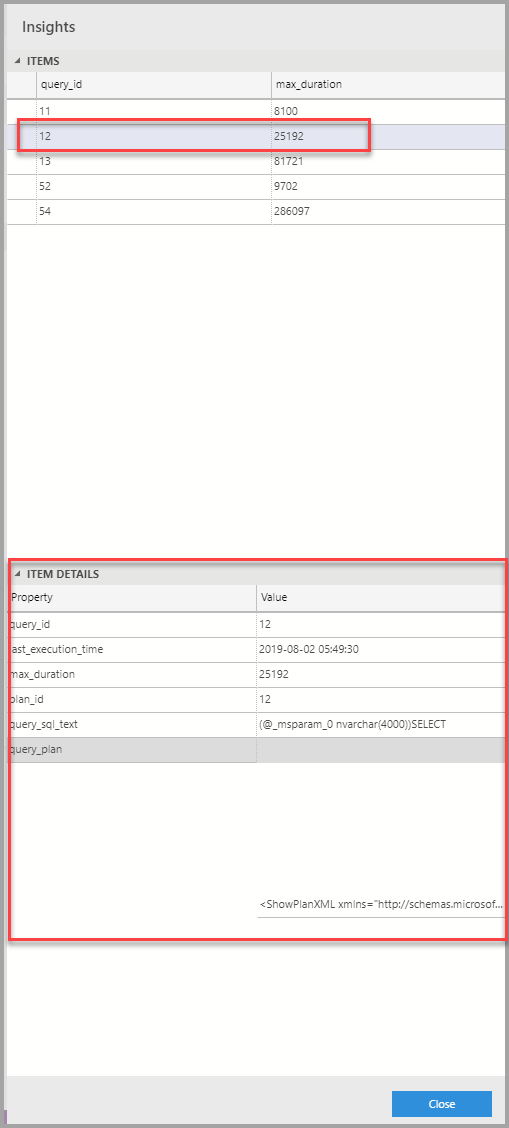
Close the Insights pane.
View the query plan
Right-click on the TutorialDB database and select Manage
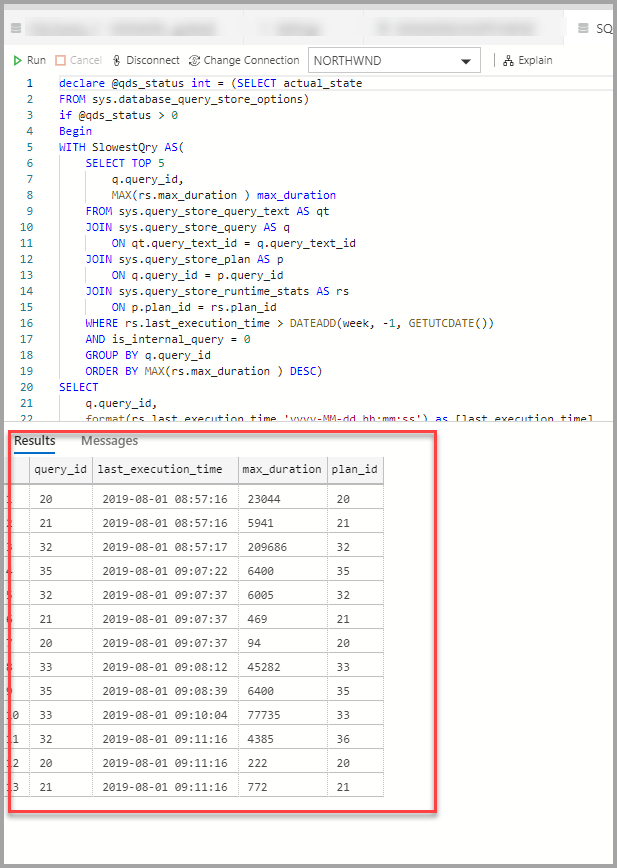
From the slow query widget To view additional information for an insight widget, click the ellipses (...) in the upper right, and select Run Query.
Now you should see a new query window with the results.
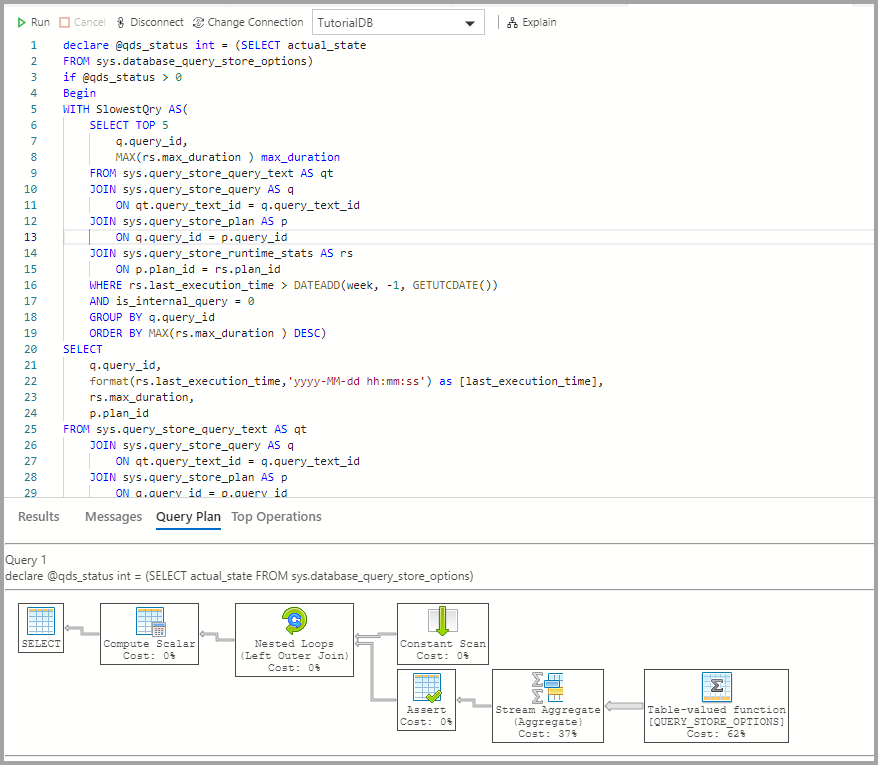
Click Explain.
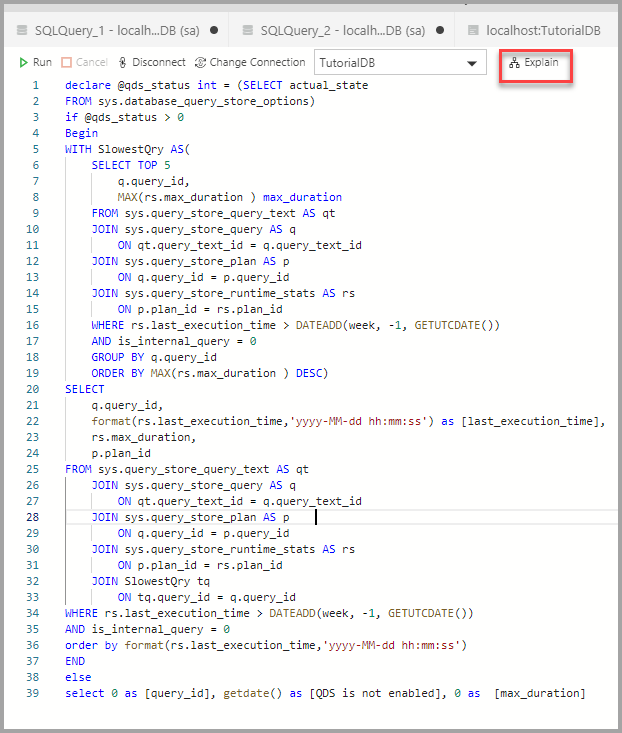
View the query's execution plan:
Next steps
In this tutorial, you learned how to:
- Enable Query Store on a database
- Add an insight widget to the database dashboard
- View details about the database's slowest queries
- View query execution plans for the slow queries
To learn how to enable the table space usage sample insight, complete the next tutorial:
Feedback
Coming soon: Throughout 2024 we will be phasing out GitHub Issues as the feedback mechanism for content and replacing it with a new feedback system. For more information see: https://aka.ms/ContentUserFeedback.
Submit and view feedback for