Tutorial: Enable the table space usage sample insight widget using Azure Data Studio
This tutorial demonstrates how to enable an insight widget on the database dashboard, providing an at-a-glance view about the space usage for all tables in a database. During this tutorial, you learn how to:
- Quickly turn on an insight widget using a built-in insight widget example
- View the details of table space usage
- Filter data and view label detail on an insight chart
Prerequisites
This tutorial requires the SQL Server or Azure SQL Database TutorialDB. To create the TutorialDB database, complete one of the following quickstarts:
- Connect and query SQL Server using Azure Data Studio
- Connect and query Azure SQL Database using Azure Data Studio
Turn on a management insight on Azure Data Studio's database dashboard
Azure Data Studio has a built-in sample widget to monitor the space used by tables in a database.
Open User Settings by pressing Ctrl+Shift+P to open the Command Palette.
Type settings in the search box and select Preferences: Open User Settings.
Type dashboard in Settings Search input box and locate dashboard.database.widgets.
To customize the dashboard.database.widgets settings, you need to edit the dashboard.database.widgets entry in the USER SETTINGS section.
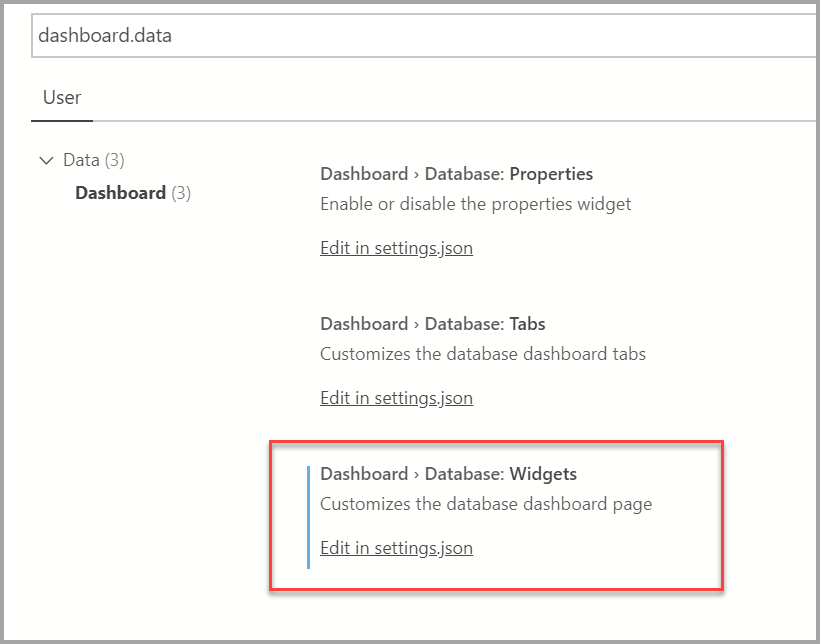
If there is no dashboard.database.widgets in the USER SETTINGS section, hover over the dashboard.database.widgets text in the DEFAULT SETTINGS column and click the gear icon that appears to the left of the text and click Copy Setting as JSON. If the pop-up says Replace in Settings, don't click it! Go to the USER SETTINGS column to the right and locate the dashboard.database.widgets section and advance to the next step.
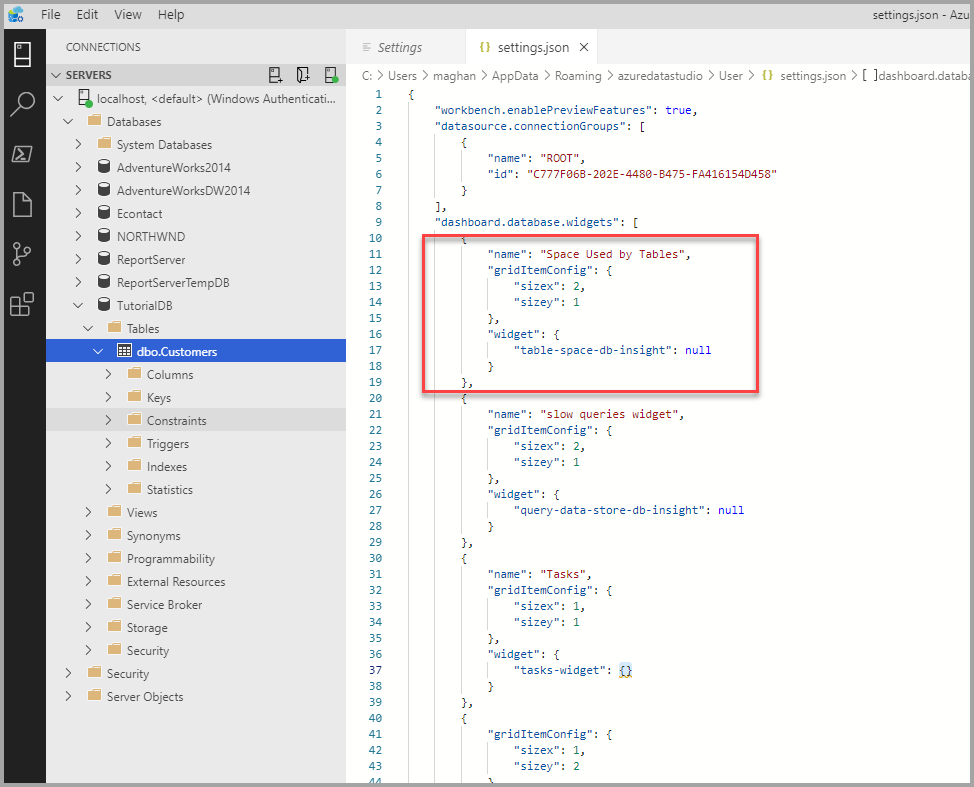
In the dashboard.database.widgets section, add the following lines:
     {
         "name": "Space Used by Tables",
         "gridItemConfig": {
             "sizex": 2,
             "sizey": 1
         },
         "widget": {
             "table-space-db-insight": null
         }
     },
The dashboard.database.widgets section should look similar to the following image:
Press Ctrl+S to save the settings.
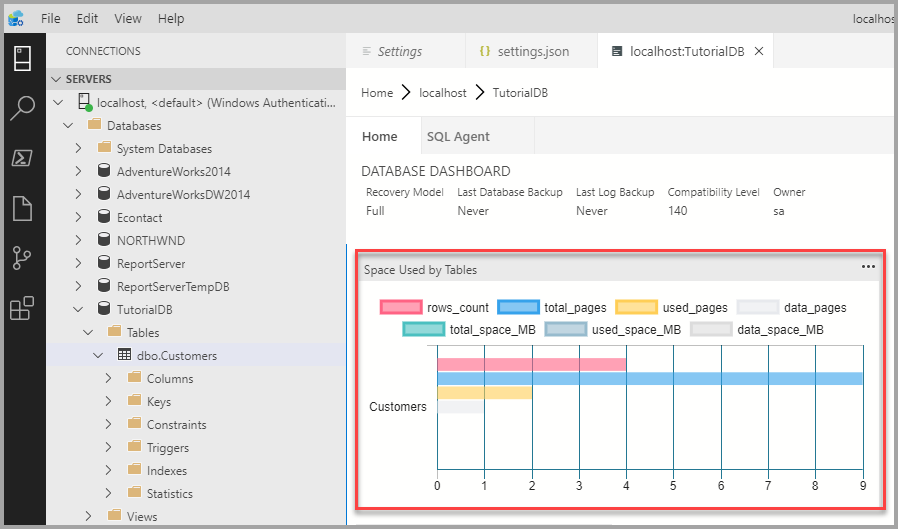
Open database dashboard by right-clicking TutorialDB and click Manage.
View the table space insight widget as shown in the following image:
Working with the insight chart
Azure Data Studio's insight chart provides filtering and mouse-hover details. To try out the following steps:
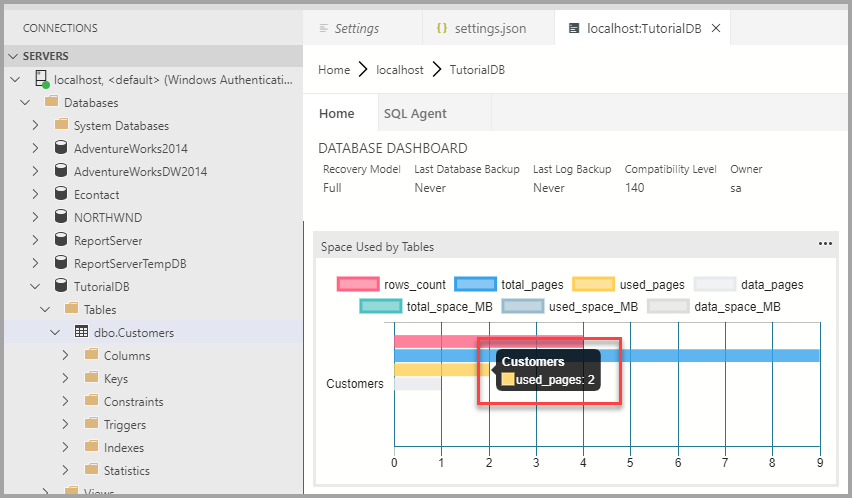
Click and toggle the row_count legend on the chart. Azure Data Studio shows and hides data series as you toggle a legend on or off.
Hover the mouse pointer over the chart. Azure Data Studio shows more information about the data series label and its value as shown in the following screenshot.
Next steps
In this tutorial, you learned how to:
- Quickly turn on an insight widget using a built-in insight widget sample.
- View the details of table space usage.
- Filter data and view label detail on an insight chart
To learn how to build a custom insight widget, complete the next tutorial:
Feedback
Coming soon: Throughout 2024 we will be phasing out GitHub Issues as the feedback mechanism for content and replacing it with a new feedback system. For more information see: https://aka.ms/ContentUserFeedback.
Submit and view feedback for