Add a custom map to a Reporting Services mobile report
Note
SQL Server Mobile Report Publisher is deprecated for all releases of SQL Server Reporting Services after SQL Server Reporting Services 2019. It is discontinued starting in SQL Server Reporting Services 2022 and Power BI Report Server.
Custom maps require two files:
- An .SHP file for shape geometries
- A .DBF file for metadata
For more information about custom maps, see Custom maps in Reporting Services mobile reports.
Store the two files in the same folder. The file names of the two must match, for example, canada.shp and canada.dbf. The first column of the metadata in the DBF file is used to match with the key value of the corresponding shape's name, or key. This value is to be used when populating the map with data.
Load a custom map
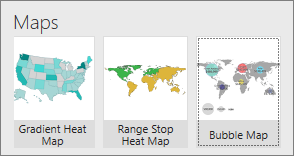
On the Layout tab, select a map type: Gradient Heat Map, Range Stop Heat Map, or Bubble Map, drag it to the design surface, and make it the size you want.
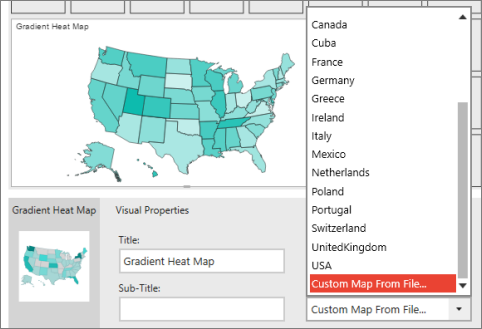
In Layout view, select the Visual Properties panel, choose Map, and then select Custom Map From File.
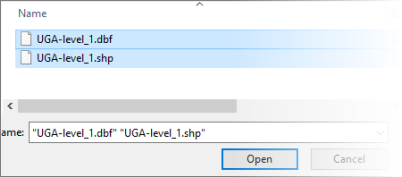
In the Open dialog, browse to the location of the SHP and DBF files and select both of them.
Connect data to a custom map
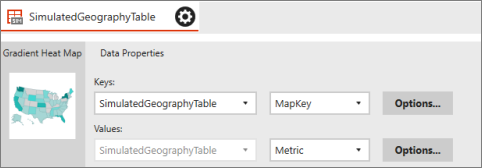
When you first add the custom map to your report, Mobile Report Publisher populates it with simulated geography data.
Displaying real data in your custom map is the same as displaying data in the built-in maps. Follow the steps in Maps in Reporting Services mobile reports to display your data.
Related content
Feedback
Coming soon: Throughout 2024 we will be phasing out GitHub Issues as the feedback mechanism for content and replacing it with a new feedback system. For more information see: https://aka.ms/ContentUserFeedback.
Submit and view feedback for