Create a Reporting Services mobile report
Note
SQL Server Mobile Report Publisher is deprecated for all releases of SQL Server Reporting Services after SQL Server Reporting Services 2019. It is discontinued starting in SQL Server Reporting Services 2022 and Power BI Report Server.
With SQL Server Mobile Report Publisher, you can quickly create SQL Server Reporting Services mobile reports that scale well to any screen size. They scale on to any screen on a design surface with adjustable grid rows and columns, and flexible mobile report elements.
The first time you create a mobile report, you can install SQL Server Mobile Report Publisher, on your local machine from the Reporting Services web portal. Or you can install it from the Microsoft Download Center. After the first time, you can start it either from the web portal or locally.
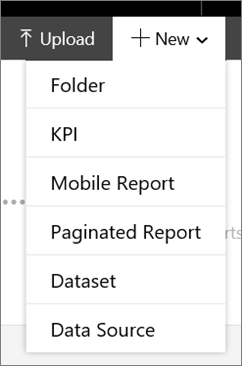
In the top bar of the Reporting Services web portal, select New, and then choose Mobile Report.
On the Layout tab in Mobile Report Publisher, select a navigator, gauge, chart, map, or datagrid and drag it to the design grid.
Grab the lower-right corner of the element and drag it to the size you want.

This grid is the Master design grid, where you create the elements you want in your report. Later, you can lay out the report for a tablet or phone.
In Visual Properties under the design grid, notice the various properties you can set.
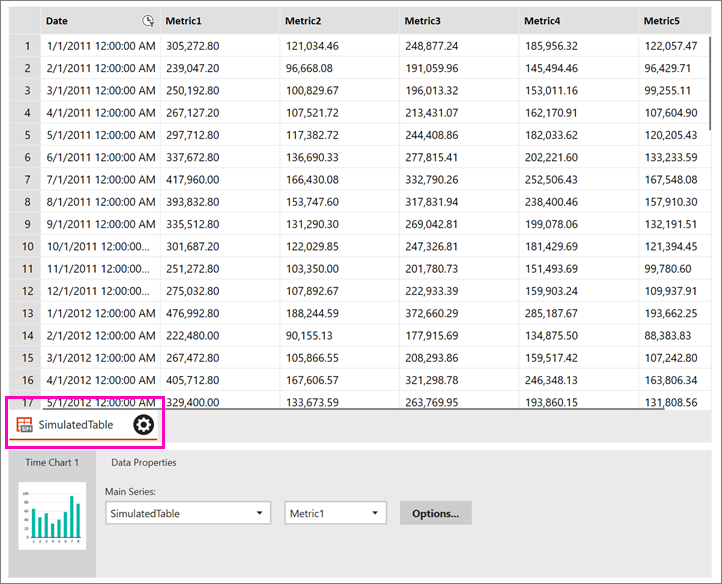
Select the Data tab in the upper-left corner, and you see the chart already simulated data associated with it.
Select Add Data in the upper-right corner.
Select Local Excel or Report Server.
Tip
If you're adding data from Excel, make sure:
- You prepare the Excel data to work in your mobile report.
- You close the file first.
Select the worksheets you want, and select Import.
You can add more than one worksheet from a workbook at a time.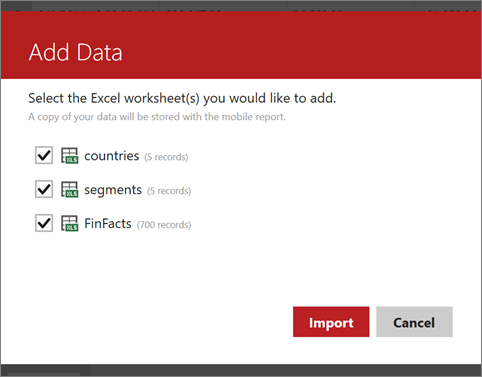
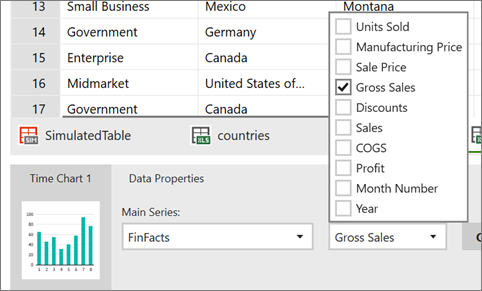
Still on the Data tab, in the Data Properties box select the table and field you want in the chart.
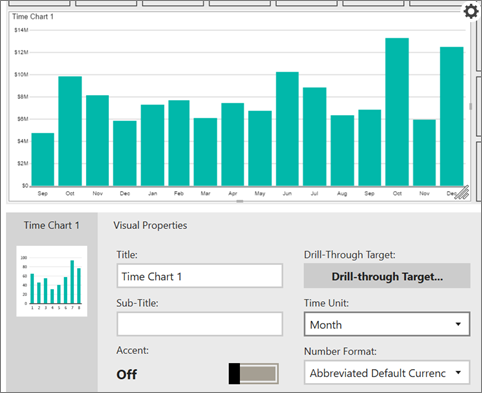
Back on the Layout tab, in the Visual Properties box you can set properties like Title, Time Unit, and Number Format.
Select Preview in the upper left to see how your report is shaping up.
Time to save your report. Select the Save icon in the upper left, and either Save Locally or Save to Server.
To save it to a server, you need access to a SQL Server Reporting Services report server.
Related content
Feedback
Coming soon: Throughout 2024 we will be phasing out GitHub Issues as the feedback mechanism for content and replacing it with a new feedback system. For more information see: https://aka.ms/ContentUserFeedback.
Submit and view feedback for