Overview of the Orchestration console
Important
This version of Orchestrator has reached the end of support. We recommend you to upgrade to Orchestrator 2022.
The Orchestrator console is a single webpage made up of multiple panes and workspaces. This article describes those panes and workspaces and includes procedures for accessing the console and managing runbooks. It provides details to use the latest Web console based on HTML5 and using SilverLight (deprecated). Ensure you migrate to the latest Web console using the steps mentioned in this article.
Note
Extract the v10.19.350.0 release package from DLC.
Navigation pane
The navigation pane on the left shows the Runbook and Folders tree, like the one shown on the Runbook Designer. Unlike the console in earlier versions, you can't select the Folders, but can select the Runbooks and view their jobs and execute them.
The navigation pane is always visible on all screens to allow quick navigation to other runbooks and folders, while remaining on the same screen.
To the right of the navigation pane, you can see the chosen screen. The Dashboard screen is shown by default.
Note
Currently, auto-refresh isn't supported for any of the screens. Reload the page manually.
Dashboard
The Dashboard shows Active jobs on the top, followed by a table of all Completed jobs (history). The Completed jobs (history) pane is collapsed by default, allowing focus on the active jobs.

Each row in both the panels corresponds to a unique job. A job may have one or more runbook instances. Each row shows:
- Job ID: Link to the Runbook
- Timestamps: The number of successful and failed instances is shown in one of the columns for all rows.
- Action buttons: Stop job or View Job details.
You can select and expand each of the job rows and view the instances of the job.
Runbooks
When you select a runbook on the navigation tree or select a runbook link, the app navigates to the Runbook screen. The top panel lists out runbook metadata (editing status, timestamps, and so on). The Run button allows you to queue the runbook for execution on the desired subset of runbook servers. The Run button is disabled for runbooks that aren't in Published state.

Below this panel is a tabbed view:
- View: For the Runbook graphical image.
- Jobs: For the list of active and completed jobs of the runbook (see below).
- Instances: For the list of active and completed instances of the runbook across all its Jobs (see below).
You can select the rows in the Jobs view just like the ones on the Dashboard screen. Jobs that are running can be stopped using the buttons on the right of the running row.


You can select the rows in the Jobs view just like the ones on the Dashboard screen. Jobs that are running can be stopped using the buttons on the right of the running row.
While this screen is active, you can choose a different runbook on the Navigation tree. This won't change the selected tab. You can look at Jobs of different runbooks by selecting the Jobs tab and navigating to the desired runbooks in the Navigation tree.
Jobs
When you select a job (using the (i) button), the app navigates to this screen. The top panel shows the job’s metadata (timestamps, parameters).
A table that shows the Instances of this job follows the panel.

Most jobs have a single Instance. If the runbook has a Monitor/Event trigger activity, then each trigger starts a unique job instance. The following screenshot shows a Job with more than one Instance.

Note
A Job can have at most one running Instance at any time. But since a Runbook can have many concurrently running Jobs, a Runbook can have more than one running Instance.
The status of the job is shown visually with the icons:
| Icon | Status |
|---|---|
| Three dots | Job is queued |
| Hourglass | Job is running |
| Circle with slash | Job was canceled |
| Tick | Job completed successfully |
| Red exclamation | Job completed but failed |
| Warning | Job completed with warning(s) |
Instances
When you select an Instance (using the (i) button), the app navigates to this screen. The top panel shows the Instance's metadata (Job ID, timestamps, parameters, server that executes this instance).

The top panel also has three navigation buttons:
- Previous: View the Instance that ran before this one.
- Next: View the Instance that ran after this one.
- Latest: View the most current instance.


Note
The job ID is the same, and since the second instance is still running, the job is also still running.
Below the panel, you see the runbook diagram. You can select each runbook activity to view activity outputs. An icon dedicated for each activity denotes the status of that activity. When you select any activity, a pane on the right lists the activity’s outputs.
Since an activity may be executed more than once within an instance (because of looping), each execution of the Activity has a unique Sequence number. The overlay lets you choose the Sequence # using the dropdown on the top.

Note
To ensure fast load time, only the first 10 activity outputs are loaded for the activity. The Load more button shows how many times this activity was executed, and you can select it to load more outputs.
The Instance and Activity status follow the same format as Job Status.
Execute runbooks
Navigate to the Runbook screen of the desired Runbook and select Run. An overlay form opens to the right where you're asked to:
- Set values to all input parameters (required).
- Choose the set of Runbook servers on which this Job can be scheduled.

Only one of these servers will execute this Job. To execute a Runbook on many servers, you'll have to run those many Jobs and explicitly set the servers one by one.
Note
Enter the parameters in the form, else the form won't be considered.
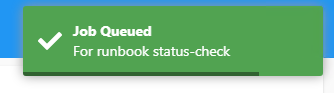
When the form is submitted, a disappearing popup is shown on the top right to notify whether the job was successfully queued or not.
Stop running Jobs
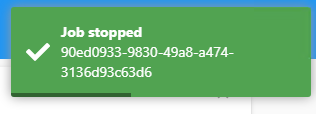
The Stop button is shown on the Dashboard and the Job screen. Disappearing popup on the top right notifies whether the Job is stopped or not.
FAQs
The Console doesn't load; error “Uh oh! Trouble connecting to WebApi [status 0]” appears.
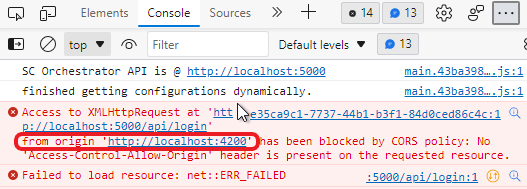
Check the browser’s developer console (Console tab), look for CORS errors (blocked by CORS policy).
If there are no CORS errors, check the Event Viewer logs (Application) on the Web API computer.

To fix CORS errors, you must ensure that the API's web.config file must have a suitable CORS configuration. The browser error shows the origin value it is expecting in the Web API's web.config. Although domain names are case-insensitive, IIS CORS uses case-sensitive comparison test. Ensure that the origin value is in lowercase in the IIS CORS config.
Tip
A typical Web API IIS CORS config:
<add allowCredentials="true" maxAge="7200" origin="http://{domain}[:{port}]">
  <allowMethods>
    <add method="GET"/>
    <add method="PUT"/>
    <add method="POST"/>
    <add method="PATCH"/>
    <add method="DELETE"/>
  </allowMethods>
  <allowHeaders allowAllRequestedHeaders="true"/>
</add>
For details on how to configure CORS in web.config, see this article on CORS Module Configuration.
How do I update the Web API URL?
The Console loads {install_dir}\assets\configuration.json to find the API URL. You can edit it using a plain text editor. Ensure that there's no trailing / (forward slash) at the end of the URL.
Migrate to HTML5 Web components
The HTML5 Web components were released in Dec 2021 through a blog post announcement. The release featured a .NET Core 5 REST API and a redesigned HTML5 Console (without Silverlight).
We recommend you migrate to the .NET Core 6 Web Components (v10.19.350.0) which will be supported as per the System Center 2019 support policy.
Following are the improvements made to the Web components:
- Upgrade to latest LTSC .NET Core 6. .NET 5 has reached end of support .
Job startform parameters in .NET 5 Web Console were mandatory.- Horizontal scrolling added to navigation tree, fixes rendering of deeply nested contents.
- API endpoints have been hardened and issues with respect to user permissions not being honored are fixed.
- Timestamps seen on the Console now match the system's time zone.
- Runbooks at root level (that is, without any parent Folder) are now visible.
- Swagger (also known as OpenAPI) spec describing the API is published along with the app.
- Packaged in a Microsoft Installer (.msi) along with an installer UI to simplify the installation/uninstallation.
Prerequisites for installation
The included Setup.exe will test and prompt for the following missing prerequisites:
- .NET 6 Hosting bundle
- IIS modules: CORS and URL Rewrite.
Tip
You can install the v10.19.350.0 release side-by-side with the .NET 5 and SilverLight Web features.
- Migrate from .NET 5 Web components to .NET 6 (v10.19.350.0)
- Migrate from SilverLight Web Features to .NET 6 (v10.19.350.0)
Run the following PowerShell command to extract the v10.19.350.0 release package from DLC and launch Setup.exe:
Setup.exe /components:webapi,webconsole
Review the API and Console installer documentation and follow the steps shown by Setup.exe.
The installer will automatically create new IIS sites with fresh web.config. You may have made changes to the web.config (such as adding domains to CORS allowed origins, database settings, other IIS site elements). Compare the previous and new web.config and update the new web.config as required.
The API spec (Swagger/OpenAPI) is included in .json format and can be visualized using a swagger previewer of your choice such as Swagger editor.
Follow the FAQ to troubleshoot common issues. Once you are comfortable with the v10.19.350.0 release, you can remove the .NET 5 apps and the respective IIS sites.
FAQ
After navigating to the HTML5 console using the browser, I see Uh oh! Trouble connecting to the API message.
Inspect the browser's console logs (press Shift+Ctrl+I on Microsoft Edge) and see if there is a CORS error. A CORS error implies that the Web Console URL has not been added to the API's allowed origins list.
If the requests failed with error code 401, it implies that there's an authentication failure.
- Ensure that the identity with which the browser is running has read rights on Orchestrator assets. These permissions can be granted using the Runbook Designer. You can change the browser process identity by opening the browser using Run As option.
- Ensure that Windows Authentication is enabled in IIS features and that the method is enabled with the IIS site.
I observe some 500 error responses
You may use any REST client to issue requests to the API. If the API cannot connect to the database, or the required .NET runtime is not installed, errors with code 500 are emitted. The error details are visible in the ETW Event Logs (use Event Viewer) which may reveal the root cause.
Check if the API works by running the following PowerShell command:
For PowerShell 5.1 version
Invoke-RestMethod http://localhost:<api_port>/api/login -UseDefaultcredentials
For PowerShell 7.x version
Invoke-RestMethod http://localhost:<api_port>/api/login -UseDefaultcredentials -AllowUnencryptedAuthentication
The installer did not create any HTTPS (TLS) endpoints, I need them.
Setting up TLS is beyond the scope of our installers; you will have to follow IIS documentation. Once it is set up, ensure that the Web console https domain is also added to the CORS allowed origin list.
The Orchestrator console is a Single Page App that helps you monitor and execute your Orchestrator deployment. This article details the supported features in the Orchestrator 2022 console.

Navigation pane
The Navigation pane on the left shows the Runbook and Folders tree, like the one shown on the Runbook Designer. Unlike the console in earlier versions, you can't select the Folders, but you select the Runbooks and view their jobs and execute them.
The Navigation pane is always visible on all the screens to allow quick navigation to other runbooks and folders while remaining on the same screen.
To the right of the navigation pane, you can see the chosen screen. The Dashboard screen is shown by default.
Note
Currently, auto-refresh isn't supported for any of the screens. Reload the page manually.
Dashboard
The Dashboard shows Active jobs on the top followed by a table of all the Completed jobs (history). The Completed jobs (history) pane is collapsed by default, allowing focus on the active jobs.
Each row in both the panels corresponds to a unique job. A job may have one or more runbook instances. Each row shows:
- Job ID: Link to the Runbook
- Timestamps: The number of successful and failed instances is shown in one of the columns for all rows.
- Action buttons: Stop job or View Job details
You can select and expand each of the job rows and view the instances of the job.
Runbooks
When you select a runbook on the navigation tree or select a runbook link, the app navigates to the Runbook screen. The top panel lists out runbook metadata (editing status, timestamps, and so on). The Run button available on the screen allows you to queue the runbook for execution on the desired subset of runbook servers. The Run button is disabled for runbooks that aren't in Published state.
Below this panel is a tabbed view:
- View: For the Runbook graphical image.
- Jobs: For the list of active and completed jobs of the runbook (see below).
- Instances: For the list of active and completed instances of the runbook across all its Jobs (see below).
You can select the rows in the Jobs view just like the ones on the Dashboard screen. Jobs that are running can be stopped using the buttons on the right of the running row.
While this screen is active, you can choose a different runbook on the Navigation tree. This won't change the selected tab. You can quickly look at Jobs of different runbooks by selecting the jobs tab and navigating to the desired runbooks in the Navigation tree.
Jobs
When you select a job (using the (i) button), the app navigates to this screen. The top panel shows the job’s metadata (timestamps, parameters).
A table that shows the Instances of this job follows the panel.
Most jobs have a single Instance. If the runbook has a Monitor/Event trigger activity, then each trigger starts a unique job instance. The screenshot below shows a Job with more than one Instance.
Note
A Job can have at most one running Instance at any time. But since a Runbook can have many concurrently running Jobs, a Runbook can have more than one running Instance.
The status of the job is shown visually with the icons:
- Three dots: Job is queued
- Hourglass: Job is running
- Circle with slash: Job was canceled
- Tick: Job completed successfully
- Red exclamation: Job completed but failed
- Warning: Job completed with warning(s)
Instances
When you select an Instance (using the (i) button), the app navigates to this screen. The top panel shows the Instance's metadata (Job ID, timestamps, parameters, server that executes this instance).
The top panel also has three navigation buttons:
- Previous: View Instance that ran before this one.
- Next: View Instance that ran after this one.
- Latest: View most current instance
Note
The job ID is the same, and since the second instance is still running, the job is also still running.
Below the panel, you see the runbook diagram. You can select each runbook activity to view activity outputs. An icon dedicated for each activity denotes the status of that activity. When you select any activity, an overlay is shown on the right that lists the activity’s outputs.
Since an activity may be executed more than once within an instance (because of looping), each execution of the Activity has a unique Sequence number. The overlay lets you choose the Sequence # using the dropdown on the top.
Note
To ensure fast load time, only the first 10 activity outputs are loaded for the activity. The Load more button shows how many times this activity was executed, and you can select it to load more outputs.
The Instance and Activity status follow the same format as Job Status.
Execute runbooks
Navigate to the Runbook screen of the desired Runbook and select Run. An overlay form opens to the right where you're asked to:
- Set values to all input parameters (required)
- Choose the set of Runbook servers on which this Job can be scheduled.
Only one of these servers will actually execute this Job. To execute a Runbook on many servers, you'll have to run those many number of Jobs and explicitly set the servers one by one.
Note
Enter the parameters in the form, else the form won't be considered.
When the form is submitted, a disappearing popup is shown on the top right to notify whether the job was successfully queued or not.
Stop running Jobs
The Stop button is shown on the Dashboard and the Job screen. You will find a disappearing pop-up on the top-right of the page to confirm if a job is still running or if it has stopped.
FAQs
The Console doesn't load; error “Uh oh! Trouble connecting to WebApi [status 0]” appears
Check the browser’s developer console (Console tab), look for CORS errors (blocked by CORS policy).
If there are no CORS errors, check the Event Viewer logs (Application) on the Web API computer.
To fix CORS errors, you must ensure that the API’s web.config file must have a suitable CORS configuration. The browser error shows the origin value it is expecting in the Web API's web.config. Although domain names are case-insensitive, IIS CORS uses case-sensitive comparison test. Ensure that the origin value is in lowercase in the IIS CORS config.
Tip
A typical Web API IIS CORS config:
<add allowCredentials="true" maxAge="7200" origin="http://{domain}[:{port}]">
  <allowMethods>
    <add method="GET"/>
    <add method="PUT"/>
    <add method="POST"/>
    <add method="PATCH"/>
    <add method="DELETE"/>
  </allowMethods>
  <allowHeaders allowAllRequestedHeaders="true"/>
</add>
For details on how to configure CORS in web.config, see this article on CORS Module Configuration.
How do I update the Web API URL?
The Console loads {install_dir}\assets\configuration.json to find the API URL. You can edit it using a plain text editor. Ensure that there's no trailing / at the end of the URL.
The Orchestration console is a single webpage made up of multiple panes and workspaces. This article describes those panes and workspaces and includes procedures for accessing the console and managing runbooks.
Navigation pane
The navigation pane is the left pane in the Orchestration console where you can select the workspace that you want to use. Depending on the workspace you select, you can view specific data and use specific options. The following workspaces are available in the navigation pane.
Runbooks workspace
The Runbooks workspace lets you start and stop runbooks. You can also view information such as the jobs and instances created for each runbook and their definition.
Summary
The Summary tab is displayed for any folder or runbook selected in the Runbooks workspace. This tab displays summary information for the jobs and instances of the selected runbook or for all the runbooks in the selected folder. The statistics that are displayed are updated every 10 minutes, so the activity performed within that time might not be reflected in the numbers until they're updated.
Each column in the Summary displays the number of jobs and instances that finished with a particular status (Succeeded, Warning, or Failed) within the last hour, the last day, and the last week. For instances, the number of instances that are currently in progress are also displayed. For jobs, the number of jobs that have been created and that are currently queued are also displayed.
Runbooks
The Runbooks tab is displayed when you select a folder in the Runbooks workspace. It lists the runbooks contained in the selected folder and specifies the status of any running jobs and instances from each. To select one of these runbooks and control their actions, select an option in the Actions pane. If you have a large number of runbooks, you can refine the list by specifying a filter.
Jobs
The Jobs tab is displayed when you select a folder or runbook in the Runbooks workspace. This tab lists the jobs created for a given runbook and the completion status. For a folder, it lists the jobs created for all runbooks in the folder and their completion status. A job is a request for a runbook server to run a runbook and is created every time a runbook receives a request to run. If a runbook starts with a monitor, it creates a job that runs continuously until the runbook is stopped. In this case, the status of the job shows an hourglass that indicates it's currently running.
Instances
The Instances tab is displayed if you select a folder or runbook in the Runbooks workspace. For a runbook, this tab lists the instances that have been created for the runbook and their completion status. For a folder, it lists the instances that have been created for all runbooks in the folder and their completion status. An instance is a running copy of a runbook and is created each time that runbook runs. If a runbook starts with a monitor, it creates an instance that continues to run until the monitor condition is met. In this case, the status for the instance shows an hourglass. When the monitor condition is met, the instance continues with the subsequent activities and then shows a completion status. The runbook then creates a new instance that also runs until the monitor condition is met.
Runbook Servers workspace
The Runbook Servers workspace lets you view the status of current and completed jobs and instances for each runbook server.
Jobs
The Jobs tab lists the jobs that have been run on the runbook server and their completion status. A job is a request for a runbook server to run a runbook and is created every time a runbook receives a request to run. If a runbook starts with a monitor, it creates a job that runs continuously until the runbook is stopped. In this case, the status of the job shows an hourglass, which means that it's currently running.
Instances
The Instances tab lists the instances that have been created on the runbook server and their completion status. An instance is a running copy of a runbook and is created each time that runbook runs. If a runbook starts with a monitor, it creates an instance that continues to run until the monitor condition is met. In this case, the status for the instance shows an hourglass. When the monitor condition is met, the instance continues with the subsequent activities, and then shows a completion status. The runbook then creates a new instance that also runs until the monitor condition is met.
Events workspace
The Events workspace lets you view log events. By default, log events include all events for the management server and all runbook servers. To limit the events, select Filter and provide criteria to limit the events displayed. If an event is specific to a runbook server, it includes the name of the server in the Source box. In this case, you can select the event, and then select View Runbook Server in the Actions pane. Selecting View Runbook Server opens the Jobs tab in the Runbook Servers workspace for that runbook server.
Start the Orchestration console in a browser
Open your browser.
In the address bar, enter
http://computer name/:port numberwhere computer name is the name of the server where the web service is installed and port is the port number selected during configuration of the web service. By default, the port is 82.
Start the Orchestration console in the Runbook Designer
Select the Orchestration Console button on the toolbar.
Note
If the URL hasn't been set for the Orchestration console, you'll receive an error message. Use the following procedure to set the URL.
Set the Orchestration console URL in the Runbook Designer
Select Options, and then select Orchestration Console.
In the URL box, enter
http://computer name:port numberwhere computer name is the name of the server where the web service is installed and port is the port number selected during configuration of the web service. By default, the port is 82.Select Finish.
Start and stop runbooks
In addition to viewing the current status of a runbook, you can also start and stop a runbook from the Orchestration console. When you start a runbook, a job is created and waits for an available runbook server to process the runbook. If the first action in a runbook is a monitor, the job runs continuously, potentially producing multiple instances of a runbook, until the runbook or job is stopped. When a runbook server is available, the job provides an instance of the runbook to the runbook server to process. A running runbook has at least one job and one or more instances associated with it.
When you stop a runbook, the runbook, all the jobs, and the all instances associated with the runbook are stopped.
Select the required tab for steps to start, stop, or view the status of a runbook:
Follow these steps to start a runbook:
Select Runbooks to open the Runbooks workspace.
If the runbook is located in a folder, select the folder in the Runbooks pane.
Select the Runbooks tab in the results pane.
Select the runbook, and then in the Actions pane, select Start Runbook.
If the runbook requires parameters, they're listed in the Runbook Parameters pane. Select the Value column for each runbook and enter a value for the runbook to use.
If you want to run the runbook on a server other than its default, select a server in the Available Runbook Server(s) pane, and then select the right arrow to add the server to the Selected Runbook Server(s) pane.
Note
If you add multiple servers to the Selected Runbook Server(s) pane, the runbook runs only on the first server if it's available. The other servers are backup servers where the runbook runs only if the primary server isn't available.
Select Start.
Stop jobs
A job is a request for a runbook to run. A job is created only when you request a runbook to run. If the first action in a runbook is a monitor, the job runs continuously until the runbook or job is stopped. An hourglass indicates the status of a running job. An instance is a running copy of a runbook.
You can't start a job; you can only start a runbook.
When you view an instance, you can choose to stop the associated job. Stopping the job stops the instance, the job, any other associated instances, and the runbook.
Next steps
To learn more about deploying runbooks, see Deploy runbooks.
Feedback
Coming soon: Throughout 2024 we will be phasing out GitHub Issues as the feedback mechanism for content and replacing it with a new feedback system. For more information see: https://aka.ms/ContentUserFeedback.
Submit and view feedback for