How to create a dashboard with the Topology widget in the Web console
Important
This version of Operations Manager has reached the end of support. We recommend you to upgrade to Operations Manager 2022.
In System Center Operations Manager version 1801 and higher, the Web console provides a monitoring interface for a management group that can be opened on any computer using any browser that has connectivity to the Web console server. The following steps describe how to create dashboard in the new HTML5 Web console with the Topology widget.
Add widget to dashboard
Open a web browser on any computer and enter
http://<web host>/OperationsManager, where web host is the name of the computer hosting the web console.From the left pane in the Web console, select + New dashboard.
On the Create New Dashboard page, provide a name and description for the dashboard you want to create.
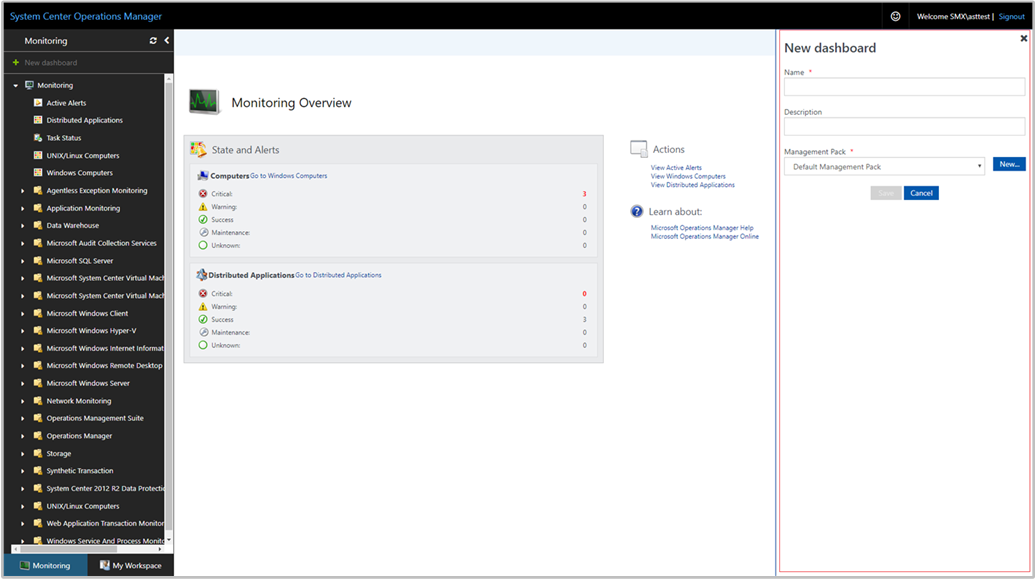
You can save the dashboard in an existing unsealed management pack by selecting the management pack from the Management Pack dropdown list or you can save the dashboard by creating a new management pack by selecting New next to the Management Pack dropdown list and provide a name, description, and optionally a version number.

When you've completed specifying where to save the new dashboard to, select OK.
Select Save after providing a name and description for the new dashboard.
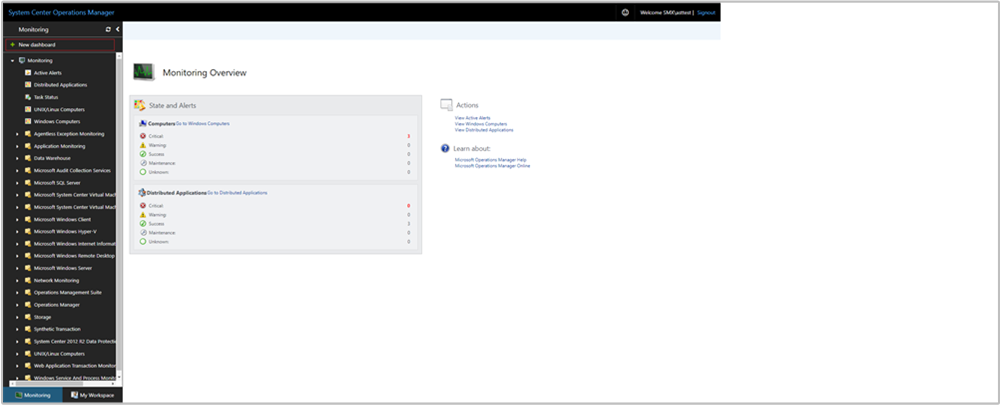
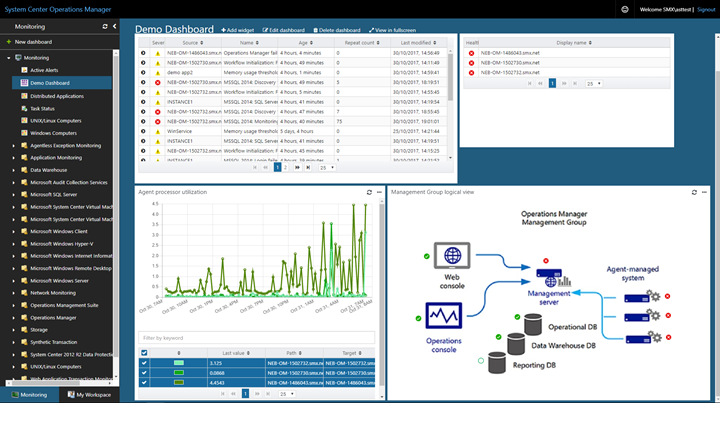
On the blank empty dashboard, you see the dashboard name, Add Widget, Edit Dashboard, Delete dashboard, and View in fullscreen options on the top of the page.

Select Topology Widget from the Select Widget dropdown list.
In the Topology widget pane, select scope for the widget by selecting either Groups or Class.
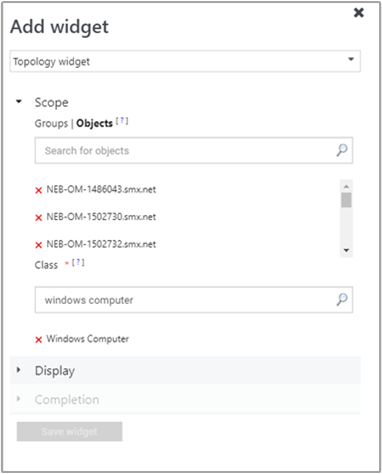
For either option selected, you can search by keyword in the list. As you begin typing, the list filters based on your input. You can select an individual group or class or multiple from the returned results.
Select Display to choose an image for the topology widget to display in the authoring pane. If you already added a custom image by performing these steps earlier, then select an image shown in the pane.
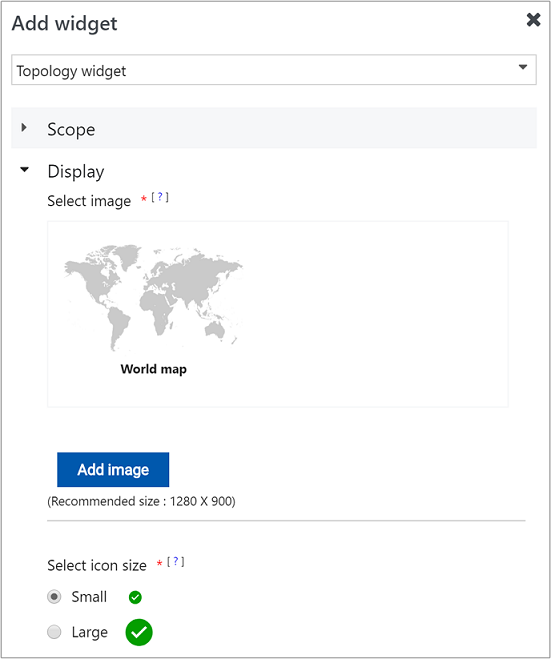
Otherwise, select Add image and navigate to where the file is located.
After selecting the file, select Open and the image will be uploaded and presented in the pane.
To change the size of the state icon, select either Small or Large.
Complete the configuration by providing a Name, Description, and Widget refresh interval (default interval is 5 minutes) for the widget. Select Save Widget to save your new dashboard.


Open a web browser on any computer and enter
http://<web host>/OperationsManager, where web host is the name of the computer hosting the web console.From the left pane in the Web console, select + New dashboard.
On the Create New Dashboard page, provide a name and description for the dashboard you want to create.
You can save the dashboard in an existing unsealed management pack by selecting the management pack from the Management Pack dropdown list or you can save the dashboard by creating a new management pack by selecting New next to the Management Pack dropdown list and provide a name, description, and optionally a version number.
When you've completed specifying where to save the new dashboard to, select OK.
Select Save after providing a name and description for the new dashboard.
On the blank empty dashboard, you see the dashboard name, Add Widget, Edit Dashboard, Delete dashboard, and View in fullscreen options on the top of the page.
Select Topology Widget from the Select Widget dropdown list.
In the Topology widget pane, select scope for the widget by selecting either Groups or Class.
For either option selected, you can search by keyword in the list. As you begin typing, the list filters based on your input. You can select an individual group or class or multiple from the returned results.
Select Display to choose an image for the topology widget to display in the authoring pane. Select Select Image, and on the Select Image pane if you already added a custom image earlier, then select an image from the list. Otherwise, select Add custom image and navigate to where the file is located.
After selecting the file, select Open and the image will be uploaded and presented in the Select Image pane. Select Done to complete.
Complete the configuration by providing a Name, Description and Widget refresh interval (default interval is 5 minutes) for the widget. Select Save Widget to save your new dashboard.
When created for the first time, the health state icons for the selected objects are displayed at the left-top section of the topology widget. These icons have to be placed manually in the appropriate position on the image by performing the following steps:
Select on the ellipsis … next to the X on the right-most side of the widget crown, which is displayed when you hover over the widget.
Select Edit icons layout action to reposition the health state icons for the selected objects on the selected image. While editing the icon layout, the health state icons will also display the object name of the specific object.
Once the selected object icons have been repositioned appropriately, select Go under Save icons layout to save reconfigured positioning of the icons.
Now your topology dashboard visualizes the health of objects positioned on the selected image.
Actions on Topology widget
For a topology diagram that includes monitored object health state in the widget, you can reposition the icons of the selected objects on the selected image.
Hover your mouse over the widget and select on the ellipsis ... on the top right corner of the widget. This will display actions available for the widget.
Select the Edit state indicator layout action.
In the Edit state indicator layout mode, the health state icons will also display the object name of the specific object.
After moving the object icons to their new position on the image, select Save to save the updated layout.
Next steps
To learn how to create a dashboard in the new web console with the Custom widget, see How create a dashboard with the Custom widget in the Web console
Feedback
Coming soon: Throughout 2024 we will be phasing out GitHub Issues as the feedback mechanism for content and replacing it with a new feedback system. For more information see: https://aka.ms/ContentUserFeedback.
Submit and view feedback for