How to use PerfInsights to diagnose high CPU or disk usage issues
Original product version: Azure
Original KB number: 4021853
This article describes how to use PerfInsights to diagnose high CPU or disk usage issues in Microsoft Azure.
Use PerfInsights to collect log data
Follow the general PerfInsights User's Guide to start PerfInsights, and then follow these steps:
Enter the Microsoft Support request number.
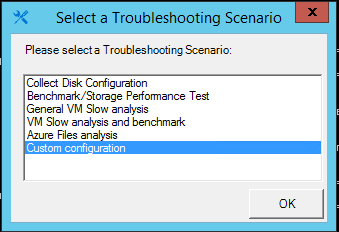
In the Select a Troubleshooting Scenario dialog box, select Custom configuration.
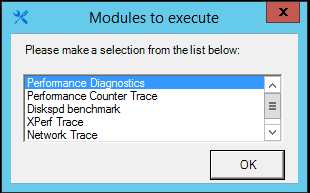
In the Modules to Execute dialog box, select Performance Diagnostics.
Click OK to continue.
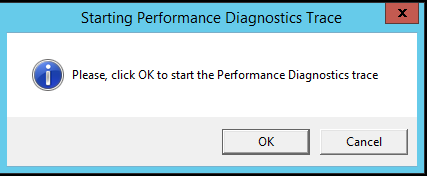
Wait for PerfInsights to collect system information. After that job is complete, the Starting Performance Diagnostics Trace window appears. Click OK to continue if the issue persists.
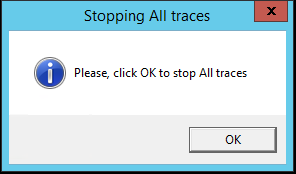
The Stopping All traces windows appears. We recommend that you wait several minutes to let the tool capture enough data for diagnostics. Then, click OK to stop the diagnostics. The final diagnostics result will be included in the CollectedData_<DateTime>.zip file.
Analyze the diagnostics report for performance issues
Follow the general PerfInsights User's Guide to open the PerfInsights Report html file.
If any high CPU or disk usage data was captured during the Performance Diagnostics job, warning messages appear on the Findings tab. The messages contain links to the Top CPU Consumer and Top Disk Consumer tabs.

You can use the Top CPU Consumers tab to identify the periods in which high CPU usage occurred and the top processes show the most CPU consumption. This tab includes the following information:
StartTime and EndTime. The start time and end time of the analysis period are shown as UTC time. Additionally, there are some notes about how the data was collected and evaluated.
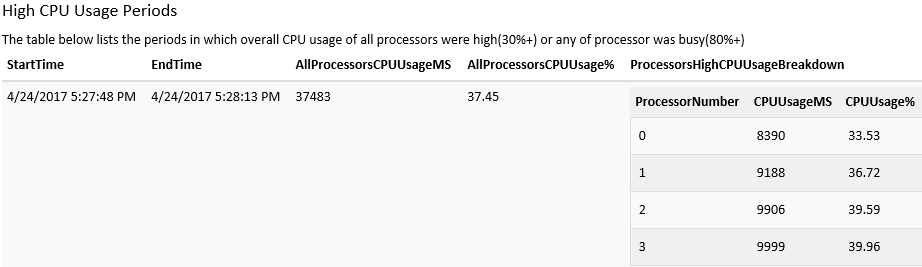
High CPU Usage Periods. This table lists all high CPU usage that occurred between the start and end times. For example, the following table shows one period of high CPU usage at 30%+. The nested table in the ProcessorsHighCPUUsageBreakdown column shows the usage of each logical processor.
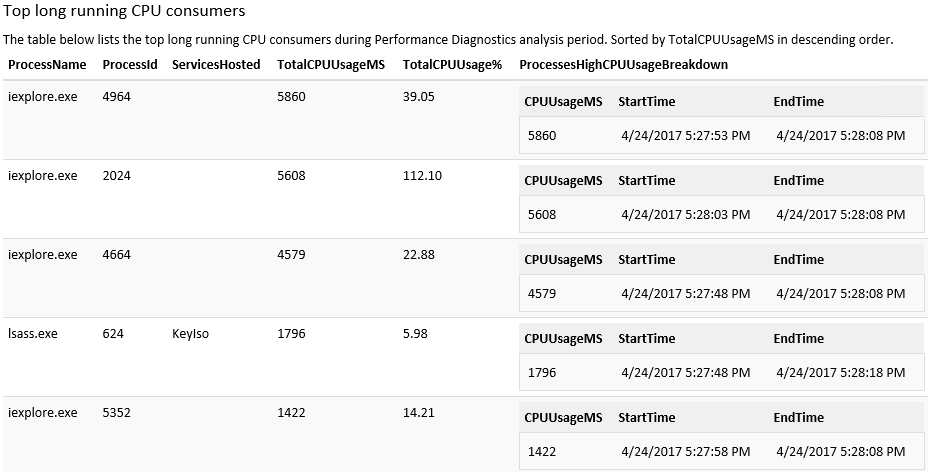
Top long-running CPU consumers. This table shows which processes were using CPU. For example, iexplore.exe (4964) contributed 39.05% CPU usage to the period of high CPU usage period. If the top consumers are your own services or programs, you must use a more powerful profiler tool to do deep analysis. If the top consumers are owned by third parties, you might want to disable or uninstall that service or program, or contact the manufacturer for customer support.
Top spike CPU consumers. This table shows the processes that had high spike usage but did not consume CPU for a long time.
You can use the Top Disk Consumers tab to identify the periods in which high physical disk usage occurred and the top processes that show the most disk consumption. This tab includes the following information:
StartTime and EndTime. The start time and end time of the analysis period are shown as UTC time. Additionally, there are some notes about how the data was collected and evaluated.
High Disk Usage Periods. This table lists all high disk usage that occurred between the start and end times. For example, the disk usage of PhysicalDisk3 was high during the period between StartTime and EndTime. The nested table in the DisksHighUsageBreakdown column shows the usage of each physical disk.

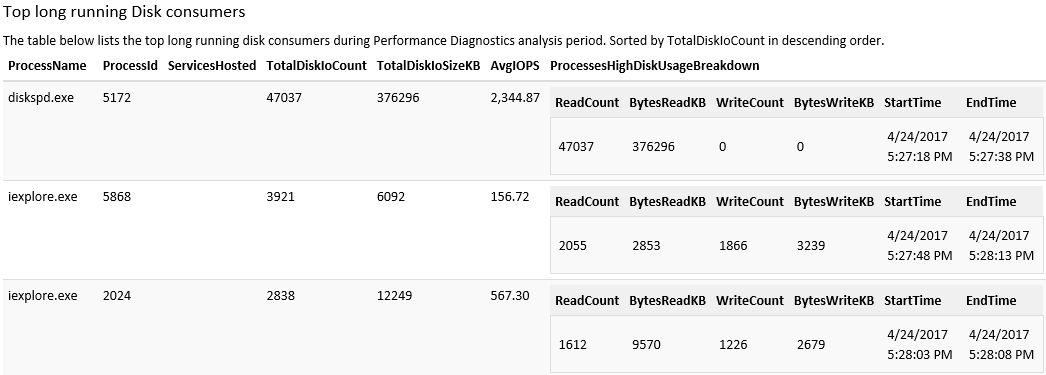
Top long-running CPU consumers. This table shows which processes were accessing the disk. For example, diskspd.exe(5172) issued 47,037 disk IOs, and its average IOPS was 2,344. If the top consumers are your own services or programs, you must investigate why they issued the large number of disk IOs. If the top consumers are owned by third parties, you might want to disable or uninstall those services or programs, or contact the manufacturer for customer support.
Top spike CPU consumers. This table shows the processes that had high spike usage but did not consume CPU for a long time.
Contact us for help
If you have questions or need help, create a support request, or ask Azure community support. You can also submit product feedback to Azure feedback community.
Feedback
Coming soon: Throughout 2024 we will be phasing out GitHub Issues as the feedback mechanism for content and replacing it with a new feedback system. For more information see: https://aka.ms/ContentUserFeedback.
Submit and view feedback for