Debugging unit tests
One of the most significant benefits to unit testing inside Visual Studio is the ability to debug your code during a test, and to debug the tests themselves. Unit tests are code, after all, and that code is prone to its own bugs.
The unexpected test failure in the previous topic, Improving the unit tests: an introduction to test-driven development is not the result of buggy unit code, but actually a buggy unit test. Let’s use the debugger to find out why.
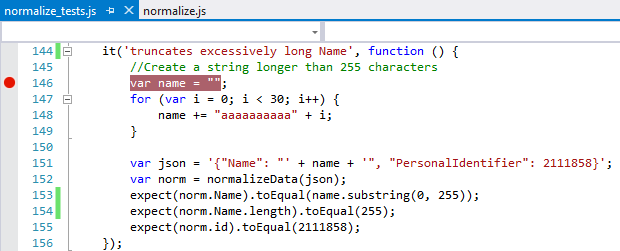
First, note that when you have any of your JavaScript files open in the Visual Studio editor, you can set breakpoints on any line of code, such as the beginning of the truncation test:
However, when you run tests through Test Explorer, those breakpoints are ignored because a test runner like Chutzpah is spawning separate PhantomJS processes to load and execute all the JavaScript, which bypasses the Visual Studio IDE entirely.
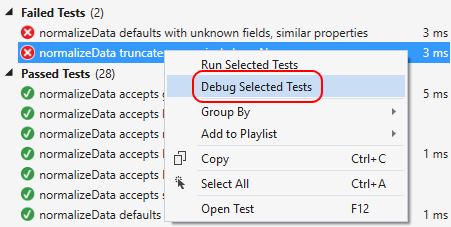
Fortunately, you can tell Visual Studio to hook itself into the execution process through the Test > Debug menu, where you’ll find options for Selected Tests and All Tests. You can also right-click a failed test and select Debug Selected Tests:
With any of these commands, Visual Studio instructs the test runner to execute the code in the browser, which will appear during a debugging session along with a Diagnostics Tool window. Visual Studio attaches its debugger to that browser so that your breakpoints will pause execution, wherever those breakpoints are set. At that point you’ll enjoy all of Visual Studio’s debugging features. Reports from the test framework will also appear in the browser.
After hitting the first breakpoint in the truncation test, we can right-click on thevar norm line, select Run to cursor, and then step over or through the call to normalizeData. Coming back from that and hovering over the name variable, we can see that it contains exactly what we’d expect, including a truncated name property:
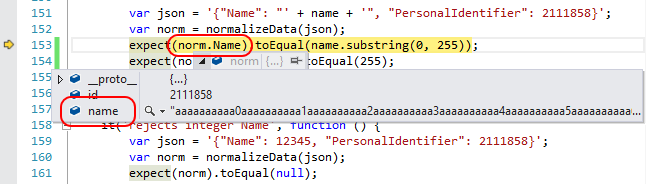
Ah, now we see the problem! Our unit test dereferences norm.Name instead of norm.name (lowercase n on name), which is why the failure report said that the Actual value given to the expect assertion was undefined. It’s a simple mistake, but one that could be confusing if we didn’t carefully examine the failure report and check the code in the debugger.
Stopping the debugger, changing the two instances of norm.Name to norm.name, saving normalize_tests.js, and rerunning the test, we find that it now passes.
Note
although the Run All command for tests automatically saves changed files, rerunning a selected test does not. If you forget to save a file before running a selected test, you could be quite confused as to why it’s still failing!
Runtime variances
Having fixed the bugs in the truncation test, only one failed test remains: “defaults with unknown fields, similar properties.” What’s confusing here is that the test itself is almost identical to the test before it:
it('defaults with unknown fields, differing by case', function () {
    var json = '{"name": "Maria", "personalIdentifier": 2111858}';
    var norm = normalizeData(json);
    expect(norm.name).toEqual("default"); //Default
    expect(norm.id).toEqual(0); //Default
});

it('defaults with unknown fields, similar properties', function () {
    var json = '{"nm": "Maria", "pid": 02111858}';
    var norm = normalizeData(json);
    expect(norm.name).toEqual("default"); //Default
    expect(norm.id).toEqual(0); //Default
});
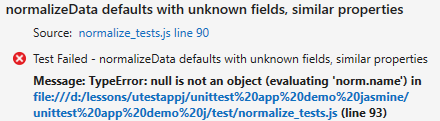
Something strange is happening, so we go into the debugger with this test. But lo and behold—the test passes! And at the same time, the browser window that opens up during debugging shows a new failure:
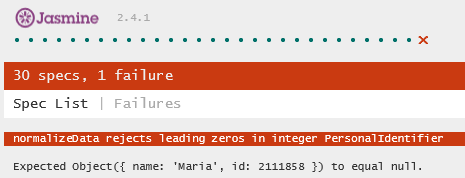
What, exactly, is going on? Why this new failure? And why does the one failure report outside the debugger mention a null?
The answer is that just like the runtime used for unit testing will likely be different than the one used by the mobile platform to run the final app, you might also be using a different runtime during debugging. In this case, running unit tests outside the debugger uses PhantomJS, whereas the browser (Internet Explorer in this case) is used when debugging.
Turns out the two runtimes differ in their implementation of JSON.parse where a leading zero on an integer value is concerned. These two tests are the ones that use such leading zeros:
var json = '{"nm": "Maria", "pid": 02111858}';

var json = '{"Name": "Maria", "PersonalIdentifier": 002111858}';
Internet Explorer’s implementation of JSON.parse is OK with these, and treats the value as an integer. The implementation in PhantomJS, on the other hand, throws an exception, which is why normalizeData returned null.
What we've also revealed here is an inconsistency between the two tests themselves. In the first case, we expected an object with default values to come back. In the second we expected the JSON to be rejected entirely. The normalizeData method can't work both ways, so we have to make them consistent.
In this case, if we can confirm that the JSON we get as input will never have such leading zeros at all, we can remove the second tests as unnecessary, and then correct the first as below, in which case it passes in both environments:
var json = '{"nm": "Maria", "pid": 2111858}';
If you run into curious situations like this, then congratulations! You’ve likely discovered a small variation between runtimes! In such rare cases you’ll need to take a good look at any subtle issues in your code, of course, and a good strategy is to write a couple more nearly identical test with more slight variations on input values. This will help you spot the exact cause of the divergent behaviors.