View call hierarchy
By viewing the call hierarchy for your code, you can navigate all calls to, and sometimes from, a selected method, property, or constructor. This enables you to better understand how code flows, and to evaluate the effects of changes to code. You can examine several levels of code to view complex chains of method calls and additional entry points to the code. This enables you to explore all possible execution paths.
In Visual Studio, you can view a call hierarchy at design time. This means you don't have to set a breakpoint and start the debugger to view the run-time call stack.
Use the Call Hierarchy window
To display the Call Hierarchy window, right-click in the code editor on the name of a method, property, or constructor call, and then select View Call Hierarchy.
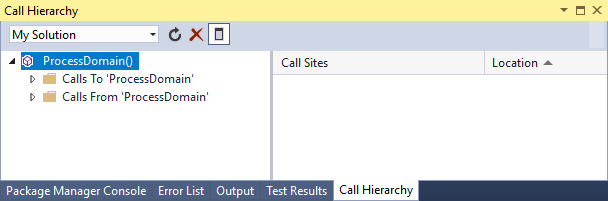
The member name appears in a tree view pane in the Call Hierarchy window. If you expand the member node, Calls To member name, and for C++, Calls From member name, subnodes appear.
For C++ code, you can see explicit calls both to and from a member:
Note
In C++ code, member functions may be called implicitly, such as a constructor or a type conversion method; these implicit calls are not necessarily included in the list.
For C# and Visual Basic code, you can see calls to a member, but not calls from:
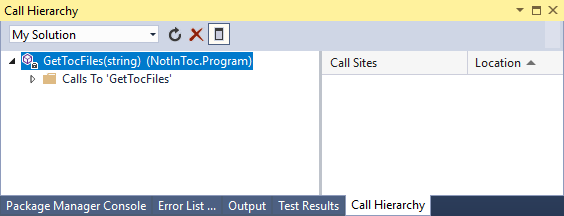
If you expand the Calls To node, all members that call the selected member are displayed.
For C++, f you expand the Calls From node, all members that are (explicitly) called by the selected member are displayed.
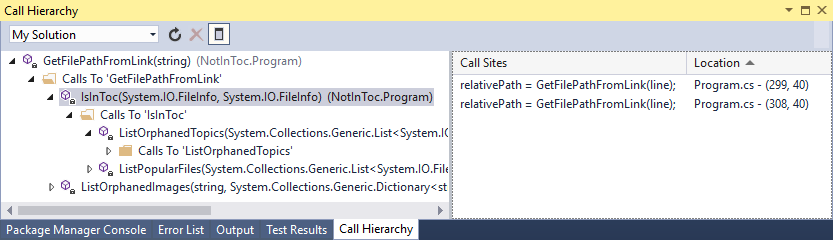
You can then expand each calling member to see its Calls To, and for C++, Calls From nodes. This enables you to navigate into the stack of callers, as shown in the following image:
For members that are defined as either virtual or abstract, an Overrides method name node appears. For interface members, an Implements method name node appears. These expandable nodes appear at the same level as the Calls To and Calls From nodes.
The Search Scope box on the toolbar contains choices for My Solution, Current Project, and Current Document.
When you select a child member in the Call Hierarchy tree view pane:
The Call Hierarchy details pane displays all lines of code in which that child member is called from the parent member.
The Code Definition window, if open, displays the code for the selected member (C++ only). For more information about this window, see View the structure of code.
Note
The Call Hierarchy feature does not find method group references, which includes places where a method is added as an event handler or is assigned to a delegate. To find all references to a method, you can use the Find All References command.
Shortcut menu items
The following table describes several shortcut menu options that are available when you right-click a node in the tree view pane.
| Context Menu Item | Description |
|---|---|
| Add As New Root | Adds the selected node to the tree view pane as a new root node. This enables you to focus your attention on a specific subtree. |
| Remove Root | Removes the selected root node from the tree view pane. This option is available only from a root node. You can also use the Remove Root toolbar button to remove the selected root node. |
| Go To Definition | Runs the Go To Definition command on the selected node. This navigates to the original definition for a member call or variable definition. To run the Go To Definition command, you can also double-click the selected node or press F12 on the selected node. |
| Find All References | Runs the Find All References command on the selected node. This finds all the lines of code in your project that reference a class or member. You can also use SHIFT+F12 to run the Find All References command on the selected node. |
| Copy | Copies the contents of the selected node (but not its subnodes). |
| Refresh | Collapses the selected node so that re-expanding it displays current information. |
Feedback
Coming soon: Throughout 2024 we will be phasing out GitHub Issues as the feedback mechanism for content and replacing it with a new feedback system. For more information see: https://aka.ms/ContentUserFeedback.
Submit and view feedback for