Profile Python code
Applies to: ![]() Visual Studio
Visual Studio ![]() Visual Studio for Mac
Visual Studio for Mac
Note
This article applies to Visual Studio 2017. If you're looking for the latest Visual Studio documentation, see Visual Studio documentation. We recommend upgrading to the latest version of Visual Studio. Download it here
You can profile a Python application when using CPython-based interpreters. (See Features matrix - profiling for the availability of this feature for different versions of Visual Studio.)
Profiling for CPython-based interpreters
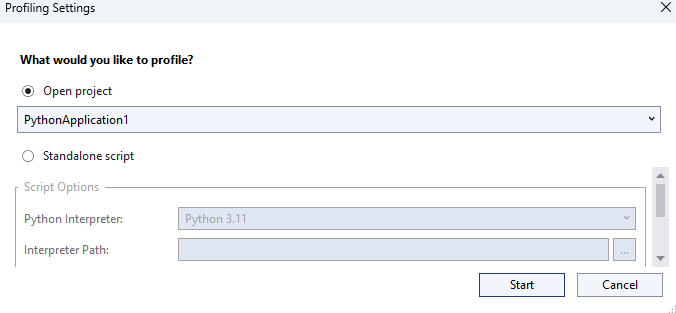
Profiling is started through the Debug > Launch Python Profiling menu command, which opens a configuration dialog:
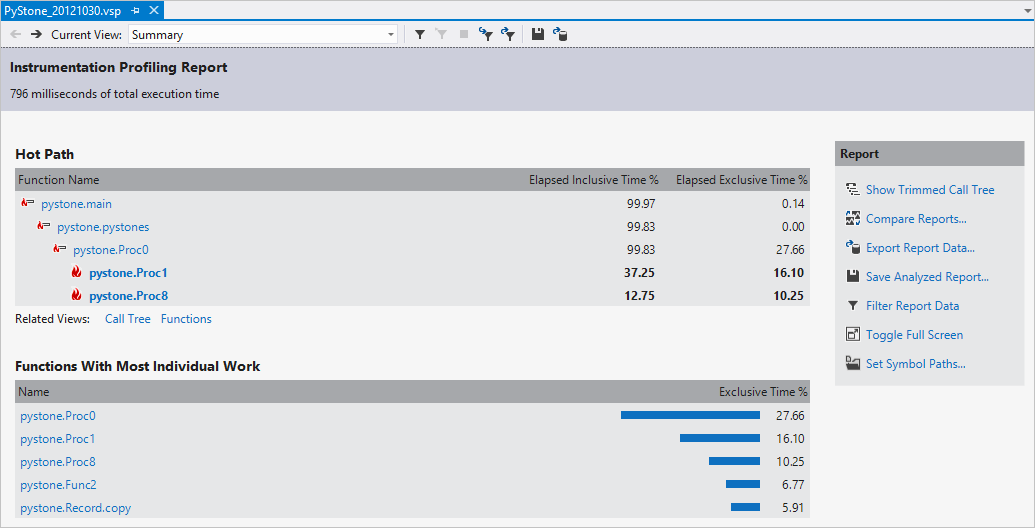
When you select OK, the profiler runs and opens a performance report through which you can explore how time is spent in the application:
Note
When you profile a Python application Visual Studio collects data for the lifetime of the process. At present, it is not possible to pause profiling. We do want to hear your feedback on future capabilities. Use the Product feedback button at the bottom of this page.
Profiling for IronPython
Because IronPython is not a CPython-based interpreter, the profiling feature above does not work.
Instead, use the Visual Studio .NET profiler by launching ipy.exe directly as the target application, using the appropriate arguments to launch your startup script. Include -X:Debug on the command line to ensure that all of your Python code can be debugged and profiled. This argument generates a performance report including time spent both in the IronPython runtime and your code. Your code is identified using mangled names.
Alternately, IronPython has some of its own built-in profiling but there's currently no good visualizer for it. See An IronPython Profiler (MSDN blogs) for what's available.