Step 4: Run code in the debugger
Applies to: ![]() Visual Studio
Visual Studio ![]() Visual Studio for Mac
Visual Studio for Mac
Note
This article applies to Visual Studio 2017. If you're looking for the latest Visual Studio documentation, see Visual Studio documentation. We recommend upgrading to the latest version of Visual Studio. Download it here
Previous step: Use the Interactive REPL window
Visual Studio provides capabilities to manage projects, a rich editing experience, the Interactive window, and full-featured debugging for Python code. In the debugger, you can run your code step by step, including every iteration of a loop. You can also pause the program whenever certain conditions are true. At any point when the program is paused in the debugger, you can examine the entire program state and change the value of variables. Such actions are essential for tracking down program bugs, and also provide helpful aids for following the exact program flow.
Replace the code in the PythonApplication1.py file with the following code. This variation of the code expands
make_dot_stringso that you can examine its discrete steps in the debugger. It also places theforloop into amainfunction and runs it explicitly by calling that function:from math import cos, radians # Create a string with spaces proportional to a cosine of x in degrees def make_dot_string(x): rad = radians(x) # cos works with radians numspaces = int(20 * cos(rad) + 20) # scale to 0-40 spaces st = ' ' * numspaces + 'o' # place 'o' after the spaces return st def main(): for i in range(0, 1800, 12): s = make_dot_string(i) print(s) main()Check that the code works properly by pressing F5 or selecting the Debug > Start Debugging menu command. This command runs the code in the debugger. As of yet, nothing has been done to pause the program while it's running, it will just print a wave pattern for a few iterations. Press any key to close the output window.
Tip
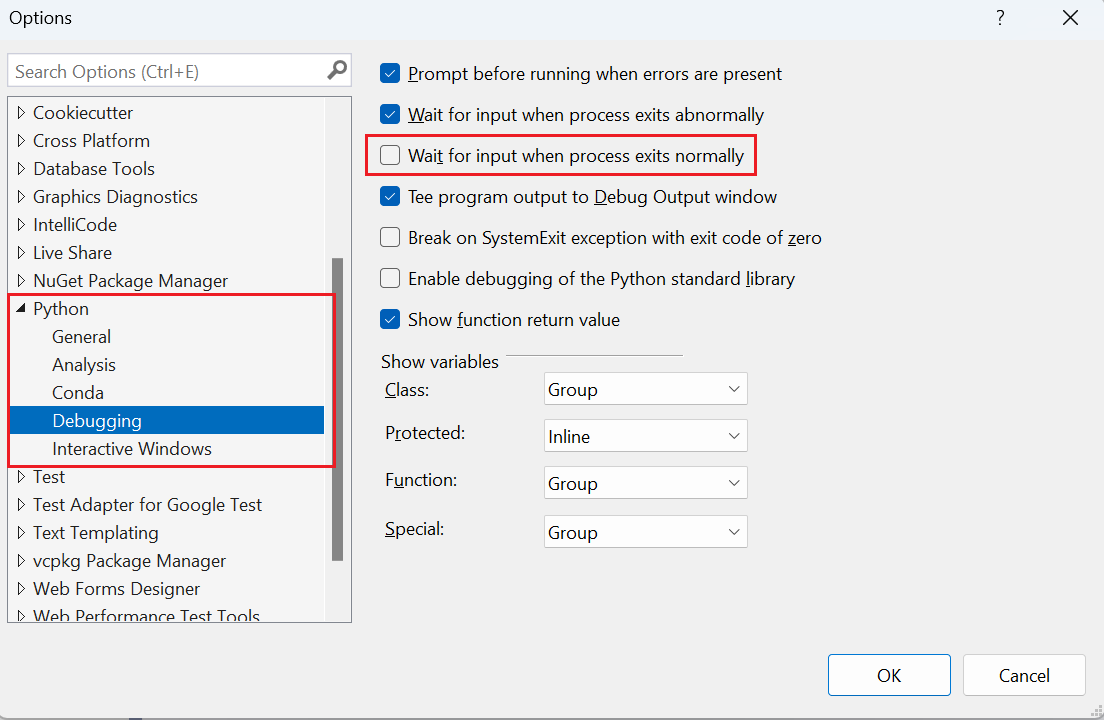
To close the output window automatically when the program completes, select the Tools > Options menu command, expand the Python node, select Debugging, and then clear the option Wait for input when process exits normally:
For more information about debugging and how to set script and interpreter arguments, see Debug your Python code.
Set a breakpoint on the
forstatement by clicking once in the gray margin by that line, or by placing the caret in that line and using the Debug > Toggle Breakpoint command (F9). A red dot appears in the gray margin to indicate the breakpoint (as noted by the arrow below):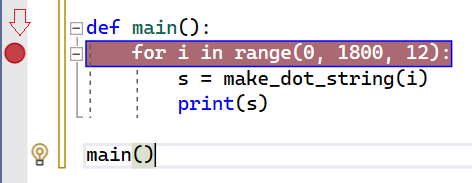
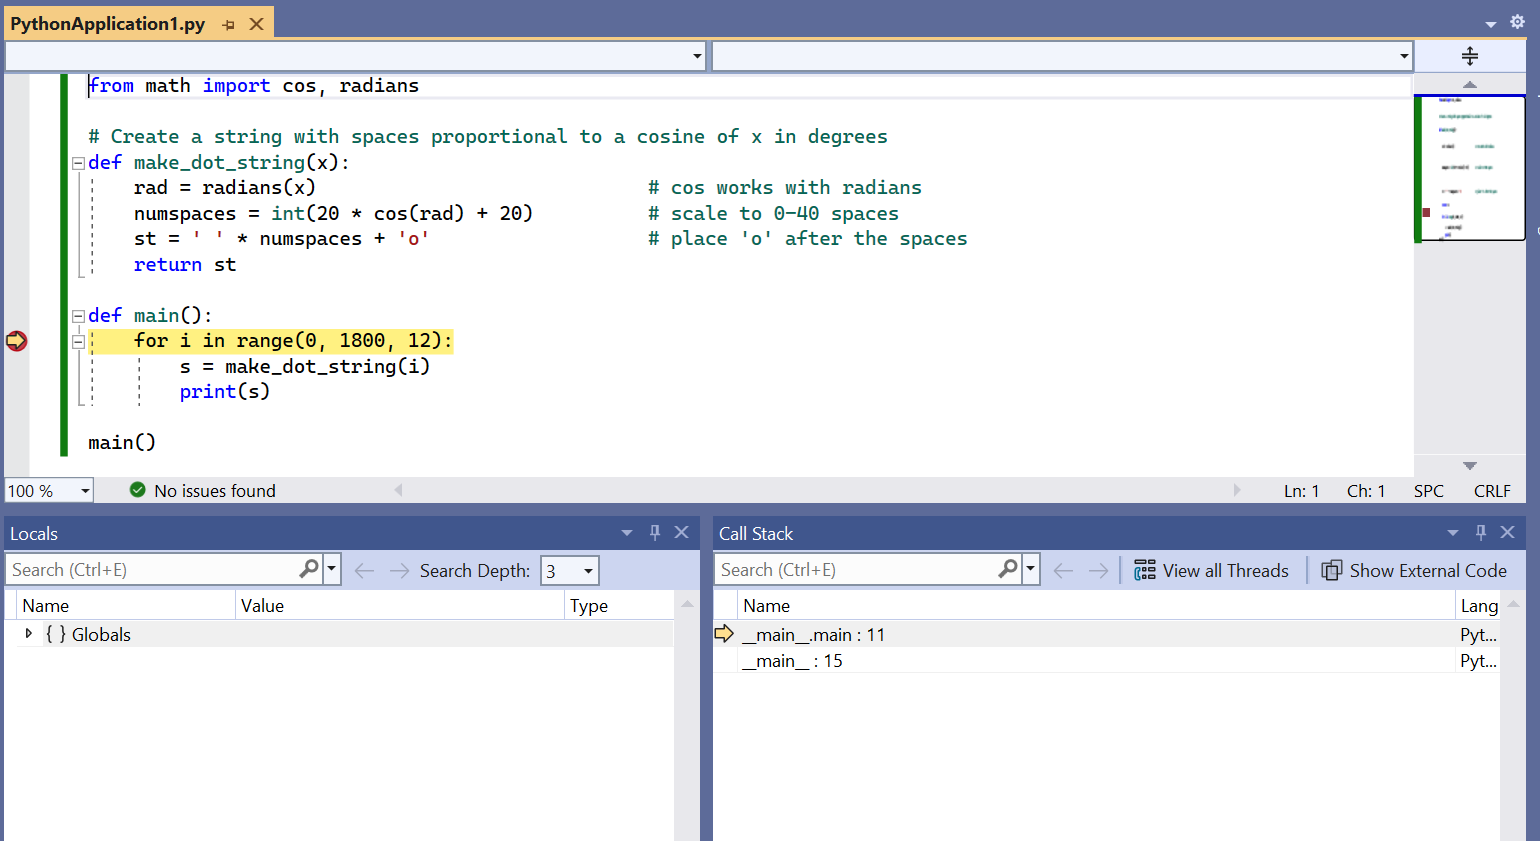
Start the debugger again (F5) and see that running the code stops on the line with that breakpoint. Here you can inspect the call stack and examine variables. Variables that are in-scope appear in the Autos window when they're defined; you can also switch to the Locals view at the bottom of that window to show all variables that Visual Studio finds in the current scope (including functions), even before they're defined:
Observe the debugging toolbar (shown below) along the top of the Visual Studio window. This toolbar provides quick access to the most common debugging commands (which can also be found on the Debug menu):

The buttons from left to right as follows:
Button Command Continue (F5) Runs the program until the next breakpoint or until program completion. Break All (Ctrl+Alt+Break) Pauses a long-running program. Stop Debugging (Shift+F5) Stops the program wherever it is, and exits the debugger. Restart (Ctrl+Shift+F5) Stops the program wherever it is, and restarts it from the beginning in the debugger. Show Next Statement (Alt+Num *) Switches to the next line of code to run. This is helpful when you navigate around within your code during a debugging session and want to quickly return to the point where the debugger is paused. Step Into (F11) Runs the next line of code, entering into called functions. Step Over (F10) Runs the next line of code without entering into called functions. Step Out (Shift+F11) Runs the remainder of the current function and pauses in the calling code. Step over the
forstatement using Step Over. Stepping means that the debugger runs the current line of code, including any function calls, and then immediately pauses again. Notice in the code, how the variableiis now defined in the Locals and Autos windows.Step over the next line of code, which calls
make_dot_stringand pauses. Step Over here specifically means that the debugger runs the whole ofmake_dot_stringand pauses when it returns. The debugger doesn't stop inside that function unless a separate breakpoint exists there.Continue stepping over the code a few more times and observe how the values in the Locals or Autos window change.
In the Locals or Autos window, double-click in the Value column for either the
iorsvariables to edit the value. Press Enter or select any area outside that value to apply any changes.Continue stepping through the code using Step Into. Step Into means that the debugger enters inside any function call for which it has debugging information, such as
make_dot_string. Once insidemake_dot_stringyou can examine its local variables and step through its code specifically.Continue stepping with Step Into and notice that when you reach the end of the
make_dot_string, the next step returns to theforloop with the new return value in thesvariable. As you step again to theprintstatement, notice that Step Into onprintdoesn't enter into that function. This is becauseprintisn't written in Python but is rather native code inside the Python runtime.Continue using Step Into until you're again partway into
make_dot_string. Then use Step Out and notice that you return to theforloop. With Step Out, the debugger runs the remainder of the function and then automatically pauses in the calling code. This is helpful when you've stepped through some portion of a lengthy function that you wish to debug. It will step through the rest and don't set an explicit breakpoint in the calling code.To continue running the program until the next breakpoint is reached, use Continue (F5). Because you have a breakpoint in the
forloop, you break on the next iteration.Stepping through hundreds of iterations of a loop can be tedious, so Visual Studio lets you add a condition to a breakpoint. The debugger then pauses the program at the breakpoint only when the condition is met. For example, you can use a condition with the breakpoint on the
forstatement so that it pauses only when the value ofiexceeds 1600. To set the condition, right-click the red breakpoint dot and select Conditions (Alt+F9 > C). In the Breakpoint Settings popup that appears, enteri > 1600as the expression and select Close. Press F5 to continue and observe that the program runs many iterations before the next break.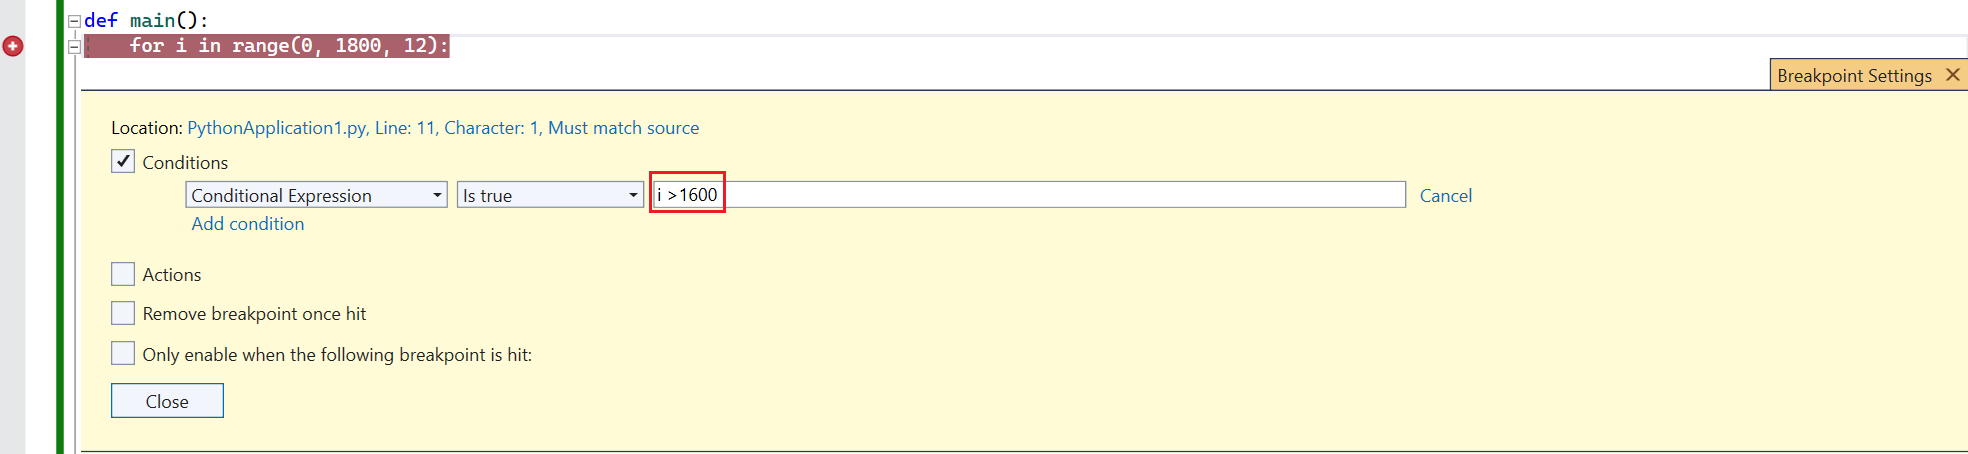
To run the program to completion, disable the breakpoint by right-clicking the dot in the margin and selecting Disable breakpoint (Ctrl+F9). Then select Continue (or press F5) to run the program. When the program ends, Visual Studio stops its debugging session and returns to its editing mode. You can also delete the breakpoint by selecting its dot or by right-clicking the dot and selecting Delete breakpoint. It also deletes any condition you've previously set.
Tip
In some situations, such as a failure to launch the Python interpreter itself, the output window may appear only briefly and then close automatically without giving you a chance to see any errors messages. If this happens, right-click the project in Solution Explorer, select Properties, select the Debug tab, then add -i to the Interpreter Arguments field. This argument causes the interpreter to go into interactive mode after a program completes, thereby keeping the window open until you enter Ctrl+Z > Enter to exit.
Next step
Go deeper
- Debugging
- Debugging in Visual Studio provides full documentation of Visual Studio's debugging features.