How to: Manually create a load test performance report using Microsoft Word
Applies to: ![]() Visual Studio
Visual Studio ![]() Visual Studio for Mac
Visual Studio for Mac
Note
This article applies to Visual Studio 2017. If you're looking for the latest Visual Studio documentation, see Visual Studio documentation. We recommend upgrading to the latest version of Visual Studio. Download it here
You can manually create Microsoft Word load test reports by copying and pasting data from the Load Test Results summary view and graphs view. The data that is presented in the summary view and graphs view is applied in HTML format when it is copied.
Note
Web performance and load test functionality is deprecated. Visual Studio 2019 is the last version where web performance and load testing will be fully available. For more information, see the Cloud-based load testing service end of life blog post. To reduce the impact on users some minimum support is still available in Visual Studio 2022 Preview 3 or later. Users should also note web performance and load test functionality only supports Internet Explorer which is not available on Windows 11 and some versions of Windows 10. Read more on Internet Explorer Lifecycle policy.
Tip
You can copy plain text from the tables view and screenshots from the details view to Microsoft Word, but it is not applied in HTML format and will require additional formatting and editing.
Tip
You can also generate organized Microsoft Excel reports automatically. For more information, see How to: Create load test performance reports using Using Microsoft Excel.
Copy summary view data
In the Load Test Results, if the summary view is not currently displayed, click Summary in the toolbar.
In the summary view, right-click and select Select All.
In the summary view, right-click and select Copy. This renders the summary view data as HTML format to the clipboard.
In Microsoft Word, paste the summary view data in the desired location.
You can now modify, format, and delete aspects of the copied content to meet your reporting needs.
Copy graph view data
In the Load Test Results, if the graphs view is not currently displayed, choose Graphs in the toolbar.
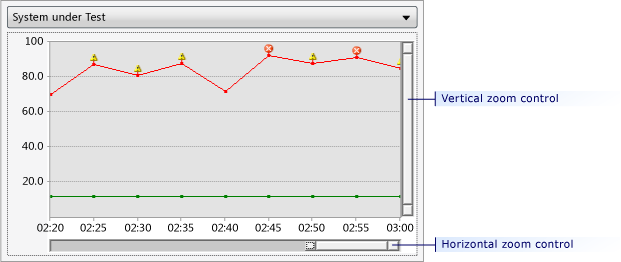
(Optional) Zoom in on the specific graph that you want to copy to your Microsoft Word document, as shown in the following illustration. For more information, see How to: Zoom in on a region of the graph.
On the graph that you want to copy to your Microsoft Word document, right-click and select Copy.
In Microsoft Word, paste the graph and associated table data in the desired location.
Warning
You cannot copy the graph from a remote desktop and paste it to another machine, because only the table information that is associated with the graph will be copied and not the graph image. The graph image is stored in the temporary directory on the machine from which it was copied, and the second machine cannot dereference that directory.