Load test results summary overview
Applies to: ![]() Visual Studio
Visual Studio ![]() Visual Studio for Mac
Visual Studio for Mac
Note
This article applies to Visual Studio 2017. If you're looking for the latest Visual Studio documentation, see Visual Studio documentation. We recommend upgrading to the latest version of Visual Studio. Download it here
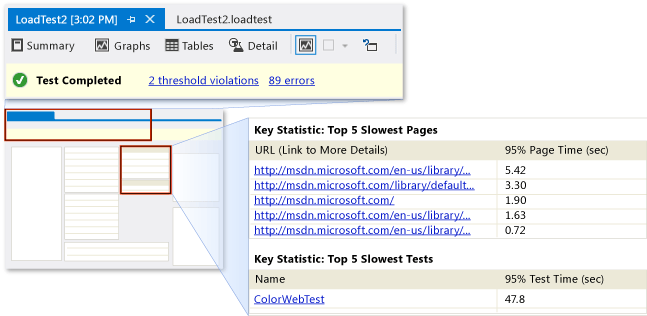
After you run a load test, you can view the load test summary to understand the results quickly. The load test summary provides the key results in a compact and easy to read format. You can also print the load test summary. This makes it convenient to use when you communicate results to stakeholders. The load test summary is also the default view when you open a load test result from a previously run load test. For more information, see How to: Access load test results for analysis.
Note
Web performance and load test functionality is deprecated. Visual Studio 2019 is the last version where web performance and load testing will be fully available. For more information, see the Cloud-based load testing service end of life blog post. To reduce the impact on users some minimum support is still available in Visual Studio 2022 Preview 3 or later. Users should also note web performance and load test functionality only supports Internet Explorer which is not available on Windows 11 and some versions of Windows 10. Read more on Internet Explorer Lifecycle policy.
The load test summary
The load test summary is divided into sections. The initial sections appear at the top of the summary, and are always visible. When you view the load test summary, the following items are first:
Test Run Information
Overall Results
Key Statistic: Top 5 Slowest Pages
Key Statistic: Top 5 Slowest Tests
Key Statistic: Top 5 Slowest SQL Operations
Note
The SQL Operations section is displayed only if SQL tracing is enabled in the load test.
The closing sections appear at the end of the summary, and can be collapsed to save space. The following items appear at the end of the load test summary:
Test Results
Page Results
Transaction Results
System Under Test Resources
Controller and Agent Resources
Errors
Test run information
The test run information section contains general information about the run including the name of the test, the start and end times, and the controller that ran the test. This section also contains the optional description of the run that you add when you run the load test.
Overall results
The overall results section contains summary results of the test including the number of requests per second, the total number of failed requests, the average response time, and the average page time.
Key statistic: Top 5 slowest pages
The slowest pages section contains the top 5 slowest pages in the load test. The URL and the average page load time are displayed for each page. The pages are listed in descending order. You can choose the URL of a page to open the Pages table and inspect more details for that page. For more information, see How to: View web page response.
The percentile value for 95% Page Time (sec) report that 95% of the pages completed in less than this time in seconds.
Key statistic: Top 5 slowest tests
The slowest tests section contains the top 5 slowest tests in the load test. The name of the test and the average test time are displayed for each test. The tests are listed in descending order. You can choose the name of a test to open the Tests table and inspect more details for that test. For more information, see Analyze load test results and errors in the Tables view.
The percentile value for 95% Test Time (sec) report that 95% of the tests completed in less than this time in seconds.
Key statistic: Top 5 slowest SQL operations
If SQL tracing is enabled in the load test, the slowest queries section contains the top 5 slowest queries in the load test. The name of the operation and the duration are displayed for each test. The duration is displayed in microseconds (SQL Server 2005) or milliseconds (SQL Server 2000 and earlier). The tests are listed in descending order by duration. You can choose the name of an operation to open the SQL Trace table and inspect more details for that operation. For more information, see The SQL Trace data table.
Test results
The test results section contains a list of all the tests and scenarios in the load test. The name of the test, the scenario, the number of times it ran, the number of times it failed, and the average test time are displayed. You can choose the name of a test to open the Tests table and inspect more details for that test. For more information, see Analyze load test results and errors in the Tables view.
Note
You can collapse and expand this section by choosing the arrow to the left of the section title.
Page results
The page results section contains a list of all the web pages in the load test. The URL, the scenario, the name of the test, the average page time, and the count are displayed. You can choose the URL of a page to open the Pages table and inspect more details for that page. For more information, see How to: View web page response.
Note
You can collapse and expand this section by choosing the arrow to the left of the section title.
Transaction results
The transaction results section contains a list of all the transactions in the load test. The name of the transaction, the scenario, the test, the response time, the elapsed time, and the count are displayed. You can choose the name of a transaction to open the Transactions table and inspect more details for that transaction. For more information, see Analyze load test results and errors in the Tables view.
Note
You can collapse and expand this section by choosing the arrow to the left of the section title.
The percentile values report the following transaction information:
90% of the total transactions were completed in less than <time> seconds.
95% of the total transactions were completed in less than <time> seconds.
System under test resources
The system under test resources section contains a list of computers that are the set of target computers for which load is being generated. This includes any computer from which you collect counter sets other than Agent or Controller. The computer name, % processor time, and available memory are displayed. You can choose a computer name to open the System under Test graph and see the resource usage over time. For more information, see Analyze load test results in the Graphs view.
Note
You can collapse and expand this section by choosing the arrow to the left of the section title.
Controller and agent resources
The controller and agent resources section contains a list of the computers that are used to run the test. The computer name, % processor time, and available memory are displayed. You can choose a computer name to open the Controller and Agents graph and see the resource usage over time. For more information, see Analyze load test results in the Graphs view.
Note
You can collapse and expand this section by choosing the arrow to the left of the section title.
Errors
The errors section contains a list of all the errors that occurred during the load test. The type and subtype of the error, the count, and the last message are displayed. You can choose an error to open the Errors table and inspect more details for that error. For more information, see Analyze load test results and errors in the Tables view.
Note
You can collapse and expand this section by choosing the arrow to the left of the section title.
Print a summary
You can print the load test summary by choosing Print on the shortcut menu on the summary. You can preview the print first by choosing Print Preview on the shortcut menu on the summary. You can also print directly from the preview screen.