Peer comparison queries
Important
This article is for the legacy Workplace Analytics app and does not reflect functionality available on the updated Viva Insights platform. Access current documentation for Viva Insights advanced insights here: advanced insights documentation.
The peer comparison query in Microsoft Viva Insights can help you analyze the workplace collaboration behavior in your organization. You use this type of query to compare the collaboration behavior of one or more peer groups with a select number of individuals.
You use a peer comparison query to identify people who compare in particular ways against other people. As you build the query, you identify the individuals of interest, the groups to compare them with, the comparison metrics, and a period of time for which to query data. Note that while you are querying about individuals, they are not identified in the output; results show only PersonIds.
Although peer comparison queries focus on people, they produce different information than person queries. Use a person query to understand the relationship between a person’s organizational attributes, such as their team, level, or location, and how they use their time, or when you want to know how one aspect of their on-the-job time allocation might influence other aspects of their time allocation. Use a peer comparison query to compare the person's collaboration behavior with that behavior in the person's peer groups.
Create a Peer comparison query
Role: Analyst
To create a peer comparison query
Open Viva Insights. (If that link doesn't work, try this link instead.) If prompted, sign in with your work account.
Select Analyze > Query designer.
In Query designer, select Get started under Query, and then select Peer comparison.
Name the query and, optionally, add a description for it.
For Group by, select an amount of time—day, week, or month—over which to aggregate and report on data.
For Time period, specify the time period whose data you want to query.
(Optional) Select Auto-refresh. (For more information, see Auto-refresh option for queries.)
If at least one of your metrics has to do with meetings, consider using Meeting exclusions to exclude meetings that fall outside relevant norms from the queries. You can select between the default meeting exclusion rules or create custom rules that match your company’s meeting conventions. See Meeting exclusions to learn more.
In the Select employees section, add filters to select the employees who are the subject of your query. For more information, see Select employees.
In the Select peer groups section, select the employees whom you want to compare with your subject population (the people you selected in the preceding step). For more information, see Select peer groups.
In the Select metrics section, select the aspect of employee behavior that you want to compare with peer groups. For more information, see Select metrics.
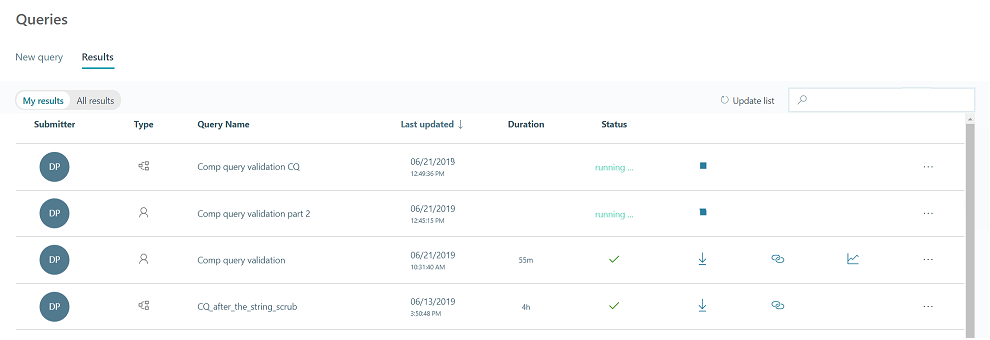
To run the query, select Run at the top right of the page. A message indicates that the query is running. In Query designer > Results, the query you started shows a status of "running":
Concepts
The following sections provide information that can help you as you create a peer comparison query.
Select employees
The purpose of a peer comparison query is to bring aspects of particular employees' workplace behavior into focus by comparing them with others in the organization, others in one of their peer groups. In the Select employees step, you select these people. (You will also select the other people, such as the ones you're comparing them with in the Select peer groups step.)
To select the people you’re querying about, filter them by their HR attributes, such as the following:
- Domain: Select all the people whose email addresses have a particular domain
- HourlyRate: Select all employees who earn a particular amount
- FunctionType: Select, for example, all engineers or all HR employees
- Organization: Select everyone in one or more organizations, such as Facilities and Finance
You can select organizations in other ways. For example, by geography—by designating the Chicago office—if geographic attributes were uploaded in the organizational data.
Even though the filtering that you perform in the Select employees step provides you with multiple people, you are not selecting a group. Rather, you are selecting a list of individuals. When the query runs, a peer group is constructed for each individual in the list, and then, a comparison is made for each individual in the list, and finally, results appear for each individual in the list.
The fact that you have selected multiple individuals has no bearing on how the query runs, other than to provide you with similar information about those individuals, reported on multiple rows in the output file, one row for each person for each aggregation period (day, week, or month) whose HR attributes matched your filter parameters.
Note
Because you have selected individuals, not groups, the minimum-group-size setting does not apply to the lists of employees that you select in this step. If this list contained only one employee, you'd still have a valid query that could return valid results.
Select peer groups
In the Select employees step, you select individuals of interest, those you’re querying about. In the Select peer groups step, you select the groups to compare with those individuals. These are groups of similar employees, calculated separately for each selected employee.
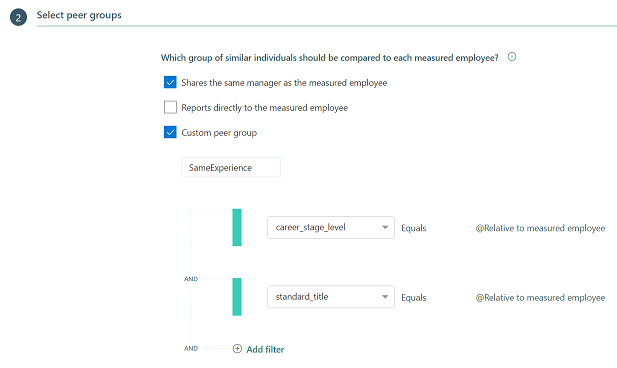
In this example, we’ve selected options to indicate groups to compare. The following sections describe those options:
Shares same manager as employee
In this example, we selected the employee’s direct peers in the management hierarchy, the people who share the same manager. For each individual of interest, how does their workplace behavior – in particular, the aspect of behavior described by the metric we’ve selected – compare with that aspect for the comparison group? The results of this comparison will appear in the query results file in one line for each aggregation period.
Reports directly to employee
The second checkbox option is “Reports directly to the selected employee.” This option (which we did not select in this example) compares workplace behavior of the individual of interest to the workplace behavior of the people who report to them.
Of what use is this comparison? For example, one important measure of manager effectiveness is the manager’s network size versus their employees’ network size. Good managers will increase the network size of their direct reports by connecting those people to other people in the organization. Select this option and specify a "network size" metric to compare the manager’s network size with that of their direct reports.
Custom comparison group
The Custom comparison group lets you define a group of your choosing in the organization by using organizational attributes. In this example, we selected groups of employees who are at the same career stage and have the same work title as the individuals of interest.
For example, one individual of interest was "Emil." Emil has just graduated from college and is a first-level engineer. In this example, the Custom comparison group also consists of people who’ve just graduated and are first-level engineers. The results of this comparison will appear in a second line for Emil in the query results file.
Selection of multiple options
Because we selected two groups in this example, two comparisons will be made when the query runs. This means that, for each individual of interest, two lines of results will appear in the query results file for each aggregation period—day, week, or month.
Note
Because in the Select peer groups step you select groups, not individuals, the minimum-group-size setting does apply. Any groups you select in this step must meet or exceed the minimum group size that is in effect for your organization.
Select metrics
In the Select metrics step, you start by selecting one or more metrics. For example, who has the larger "internal network size" (a metric), the employees or the comparison groups? In the following illustration, we’ve selected four metrics, which you see listed under Base metric:
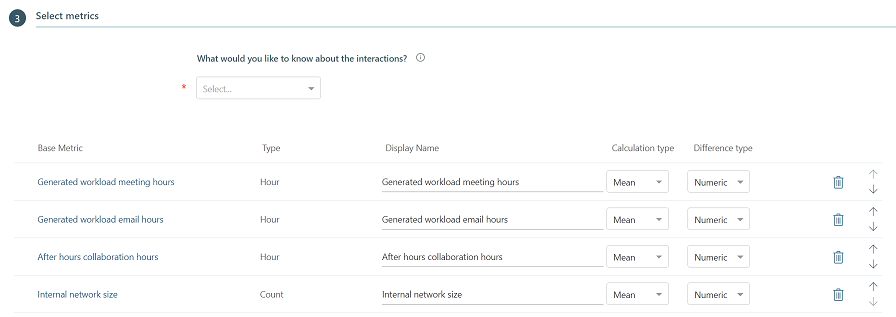
After you select a base metric, you can change its display name.
Select metrics options
In this section, you define how the metrics are used in the comparison:
- For Calculation type, select whether to compare the mean value, the median, or another statistical operator.
- For Difference type, select whether to express the result of this comparison in absolute numbers or in percentages.
You can vary the Calculation types and Difference types in the metrics that you’ve chosen.
For descriptions of available metrics, see Peer-comparison metrics.
View results
After the query finishes running, its row in Query designer > Results shows a check mark in the Status column. You can then download and open the results file. (Results files are in .csv format.)
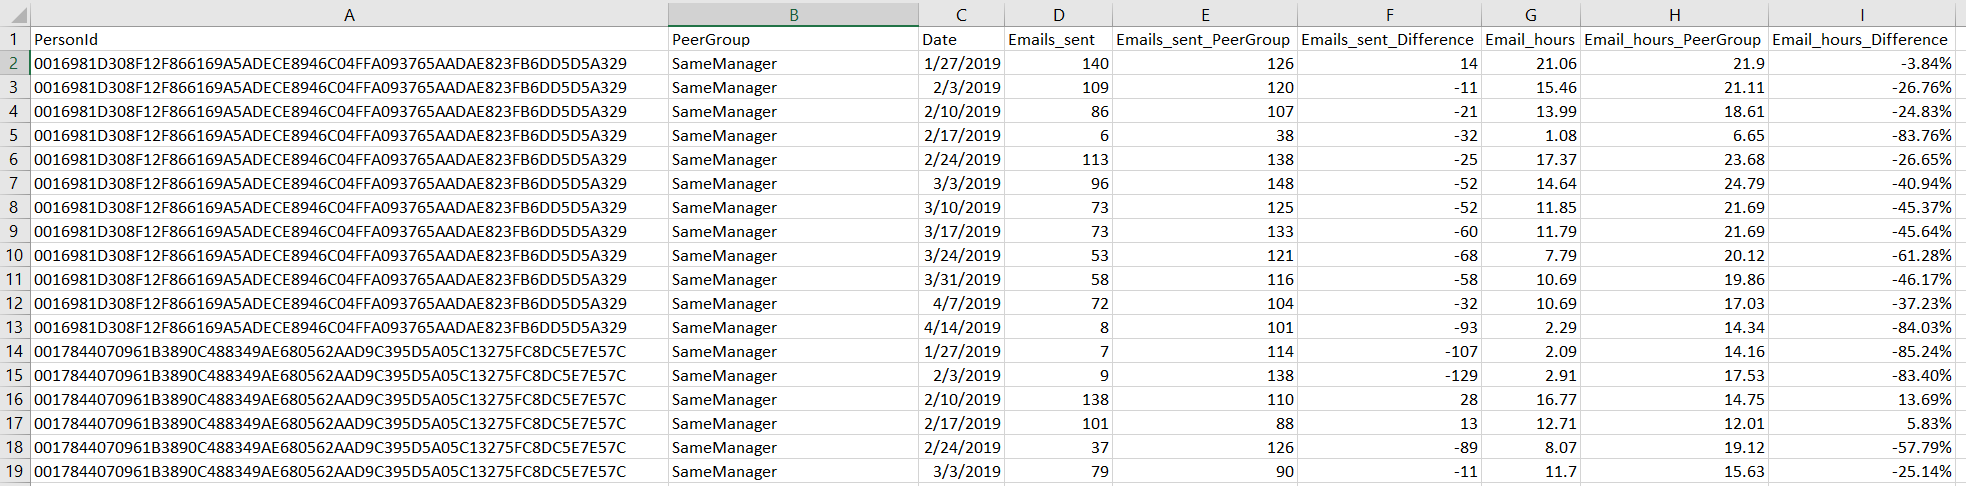
In this example results file, the first 12 lines of data (lines numbered 2 through 13) report comparison results for the first individual of interest, whose PersonId ends in "5A329."
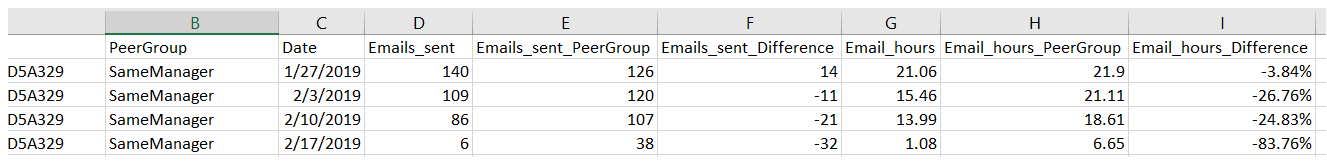
Here are a few things we know about this comparison (the results on these 12 lines):
- The PeerGroup value tells us that this person was compared with peers who share the same manager.
- The Date value states the first day of the aggregation period from which data was drawn.
- Each of these 12 lines represents one aggregation period—in this case, one week, because we selected "week" in the Group by control while defining the query.
The person sent 140 emails during the week that started in January 27, while their peer group sent 126, on average. The difference was 14. However, during the following week (which began on February 3), the person sent 109 and their group sent on average 120, so Emails_sent_Difference shows that they sent 11 fewer emails than their peer group. If you had chosen percentage for Difference type, the displayed result would have been "-9%" (nine percent fewer) emails than were sent by their peer group.
For more information, see View, download, and export query results.