Network person-to-person queries
Important
This article is for the legacy Workplace Analytics app and does not reflect functionality available on the updated Viva Insights platform. Access current documentation for Viva Insights advanced insights here: advanced insights documentation.
Successful employees and teams use their networks to get work done effectively. Measuring network attributes tells you what network resources employees can access. Network size is just one attribute of a collaborative network. Network connections have other qualities that tell us more about the type of working relationship and what benefit it might present to the employee and team.
You can use the Organizational network analysis (ONA) queries to qualify a network connection between two people as a strong tie, a diverse tie, or neither.
A generic network tie is defined liberally: two people who've shared at least two meaningful interactions in the last four weeks.
Some network connections represent significantly more close collaboration than the generic minimum of just two meaningful interactions. When a network connection represents significantly more close collaboration time, Viva Insights will classify it as either a strong tie or as a diverse tie.
The difference between strong ties and diverse ties is determined by how many other network connections the two individuals have in common.
If the two people have many network connections in common, it is considered a strong tie. Strong ties typically indicate shared membership in a workgroup or team. Groups of employees with many strong ties often represent highly cohesive units.
If the two people have few network connections in common, it is considered a diverse tie. Although the two people work closely with each other, they do not typically operate in the same circles. Groups of employees with many diverse ties often represent teams with high innovative potential, as they are exposed to lots of information outside of their shared context.
The following walks you through a query that will return strong and diverse tie scores. See the following section to Run a query to determine strong ties and diverse ties.)
Run a query to determine strong ties and diverse ties
You can use the tie metrics in Network person-to-person queries. In the following example procedure, you will query for strong and diverse tie scores.
Role - Analyst
In the advanced insights app, select Analyze > Query designer, and then select Get started under Query.
Select Network: Person-to-person.
Select and change Enter query name here to a name, and then, optionally, enter a description for the query.
For Group by, select a time-grouping option: Month or Aggregated. If you choose Monthly, the query results will contain one row with data for each month in the time period that you chose. If you choose Aggregated, the query results will contain one row for the entire time period that you chose.
Note
Currently, the only meeting-exclusion rule that can be used with a Network query is the Tenant default meeting exclusion rule. As you build your query, this rule is selected by default; it cannot be deselected.
If you want the query to run repeatedly, on a regular schedule, select Auto-refresh. (For more information, see Auto-refresh option for queries.)
Under Select network boundary conditions, define a filter to select the measured employees that you want to analyze in this query. For example, you can use the filters of this step to narrow the scope to a division or a group. If you skip this (optional) step, all measured employees will remain eligible for analysis.
More information about this option: If you run this query on the entire company, the results will be based on all collaborations across the company. If this is your goal, you can retain the default search range, which is unlimited. But your goal might be to understand connectivity for a specific group of people, based on collaboration happening exclusively within that group. In this case, limit the query to search only within a particular division or group.
Under Select collaboration types, specify the types of collaboration activities that you want to include in your analysis. Your choices are Emails and meetings, Teams instant messages, and Teams calls. (The Emails and meetings option is mandatory and cannot be deselected.)
More information about this option: As the nature of the workplace evolves, different ways to collaborate gain or lose popularity, doing so at different rates among different populations. Some people and organizations are more formal in nature – for example, a legal division or HR – and they might invariably use email. Also, they might tend to message multiple recipients at the same time, for which they might prefer email.
Other people who have a less traditional, more casual, or more personal outlook might prefer Teams IMs or calls. Analysts who study this communication can reach different inferences based on formal or informal communication. Depending on the types of change they want to make in the company, they might want to focus the analysis on one group of employees or the other.
Under Select metrics, select Strong and Diverse tie scores.
Under Select filters, select the groups of people for whom you want to see results. This section offers two optional filters, one for selecting "tie-origin" employees, and the other for selecting "tie-destination" employees.
Under Organizational data, select the attributes that you want to appear in the results along with the metrics data. You can use these attributes to further summarize the results to create analyses that compare and contrast the collaboration of different groups in the organization.
Select Run. The query takes a few minutes to complete.
In Query designer > Results, the query status initially shows as Submitted. After the query status changes to Succeeded, you can view it or download it (as a .csv file).
Note
You can view, copy, export, and visualize query results in different ways for different query types. The topic View, download, and export query results describes how to see and share results. For example, you can view query results, download and import query results, and use an OData feed in Power BI.
Network person-to-person query output
The query results show the quality of the relationship between two specific (but de-identified) people. Each row shows the information for a pair of people between whom a tie exists, or existed, over the time period of the query.
The following columns appear, from left to right, in the query results for Network person-to-person queries:
The first two columns identify the initiator of the tie

Query results example: Columns A and B
The column names for these attributes are organizational attribute names with the prefix TieOrigin_. These first two columns appear automatically:
- TieOrigin_PersonId - A de-identified ID number for the person represented in that data row. You do not select this column as you build a query; it appears automatically.
- TieOrigin_GroupId - A de-identified ID number of the group in the organization to which the person belongs. This column can help you discover Strong ties in a team to understand how cohesive it is and also discover Diverse ties in a team to understand whether there are opportunities for novel information to flow into the team. You do not select this column as you build a query; it appears automatically.
The next columns describe the initiator of the tie
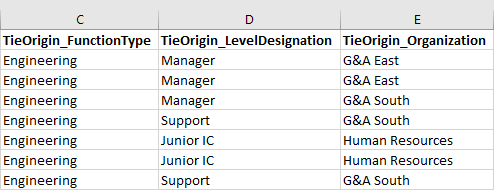
Query results example: Columns C through E
The column names for these attributes are organizational attribute names with the prefix TieOrigin_. These three columns represent attributes that you selected while building the query:
- TieOrigin_FunctionType. The job function that the employee performs.
- TieOrigin_LevelDesignation. The employee's level within the organization.
- TieOrigin_Organization. The internal organization that the employee belongs to.
The next two columns identify the other participant in the tie
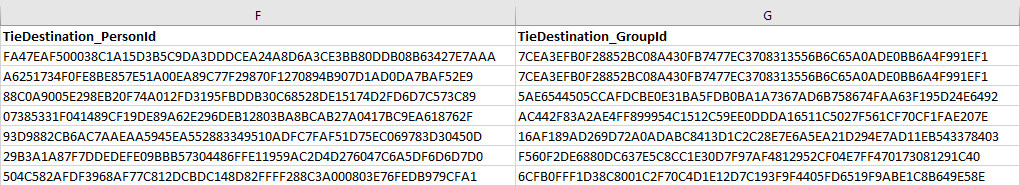
Query results example: Columns F and G
The column names for these attributes are organizational attribute names with the prefix TieDestination_. These first two columns for this person appear automatically:
- TieDestination_PersonId - A de-identified ID number for the person represented in that data row. You do not select this column as you build a query; it appears automatically.
- TieDestination_GroupId - A de-identified ID number of the group in the organization to which the person belongs. This column can help you discover Strong ties into another team to understand how well connected one is with that team and also discover Diverse ties in another team to understand opportunities for novel information to flow from that team. You do not select this column as you build a query; it appears automatically.
The next columns describe the other participant in the tie
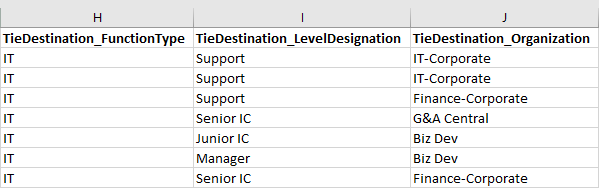
Query results example: Columns H through J
The column names for these attributes are organizational attribute names with the prefix TieDestination_. These three columns represent attributes that you selected while building the query:
- TieDestination_FunctionType. The job function that the employee performs.
- TieDestination_LevelDesignation. The employee's level within the organization.
- TieDestination_Organization. The internal organization that the employee belongs to.
The last columns give the results
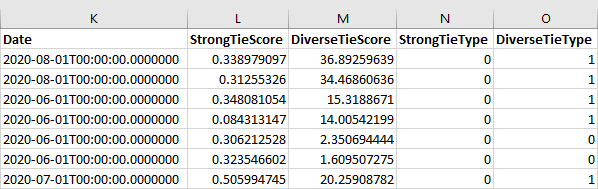
Query results example: Columns K through O
Date - The start date of the aggregated output (for example, for the week of June 3rd to June 10th, the start date would be the 3rd. For a month, it's the first day of the month that your data encompasses).
Metrics - The metrics that you included in the query. For more information, see Network metric descriptions.
The results for this query type always include the following metrics:
- StrongTieScore - Sort on this column to find employees with the highest scores. These high scores represent strong ties between the two individuals.
- DiverseTieScore - Sort on this column to find employees with the highest scores. These high scores represent diverse ties between the two individuals.
- StrongTieType - This column is present to help analysts quickly find the strongest ties. It contains values of 0, 1, or 2, based on the distribution of StrongTieScore. The values indicate the following:
- 1: This row clearly indicates a strong tie — 35th percentile and above, by strength.
- 2: This row indicates a tie that is significant but less strong: at or above the 30th percentile but below the 35th percentile.
- 0: This row indicates a tie that is not that strong: below the 30th percentile.
- DiverseTieType - This column is present to help analysts quickly find the most diverse ties. It contains values of 0, 1, or 2, based on the distribution of DiverseTieScore. The values indicate the following:
- 1: This row clearly indicates a diverse tie — 50th percentile and above, by diversity.
- 2: This row indicates a tie that is significant but less diverse: at or above the 45th percentile but below the 50th percentile.
- 0: This row indicates a tie that is not that diverse: below the 45th percentile.
Derived attributes
The following organizational attribute, GroupId, is used in this query type. Note that this attribute is not among the organization data that admins upload to the app. Rather, it is derived from the ManagerId attribute, which is in the organizational hierarchy data that admins upload.