Add charts to a dashboard
Azure DevOps Services | Azure DevOps Server 2022 - Azure DevOps Server 2019
This article describes how to add query-based charts and in-context reports to a dashboard from their functional page. For example, you can add the Team Velocity in-context Analytics report to a dashboard. Once you've added the report, go ahead and modify the corresponding widget configuration parameters.
You can add the charts described in this article to a dashboard from their corresponding functional page, like:
- Builds
- Releases
- Queries
Prerequisites
- You must have created the team dashboard to which you want to add a chart.
- Anyone with access to a project, including stakeholders, can view dashboards.
- To add, edit, or manage a team dashboard, you must have Basic access or greater and be a team admin, a project admin, or have dashboard permissions.
- You must have created the team dashboard to which you want to add a chart.
- To add, edit, or manage a team dashboard, you must have Basic access or greater and be a team admin, a project admin, or have dashboard permissions. In general, you need to be a member of the team to edit a team dashboard. Request your current team or project admin to add you as a team admin.
For more information, see Default permissions and access for charts and dashboards.
Add a work item query or chart
You can add work item queries and charts to a dashboard from the Queries page.
Tip
You can also add a work item query chart widget to a team dashboard.
Sign in to your organization (
https://dev.azure.com/{yourorganization}) and go to your project.Select Boards > Queries > Charts. Queries and charts must be associated with queries under the
Shared queriesfolder.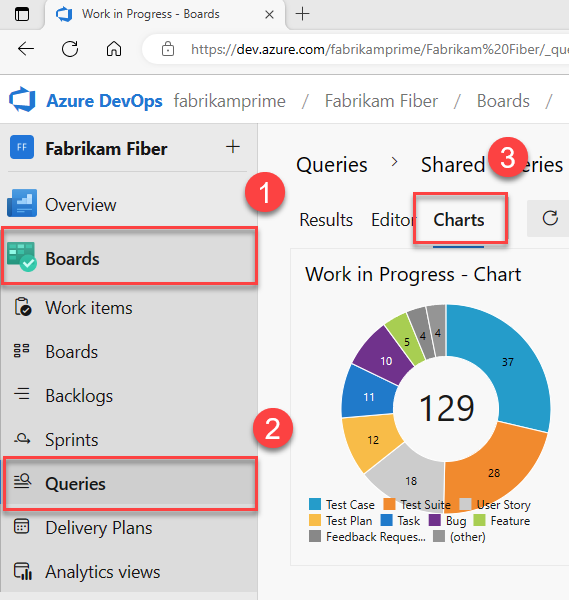
From the charts
 Actions menu, select Add to dashboard.
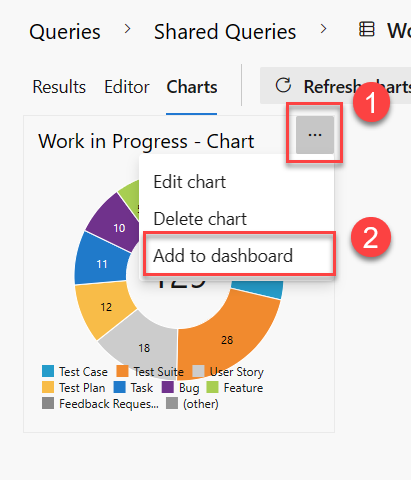
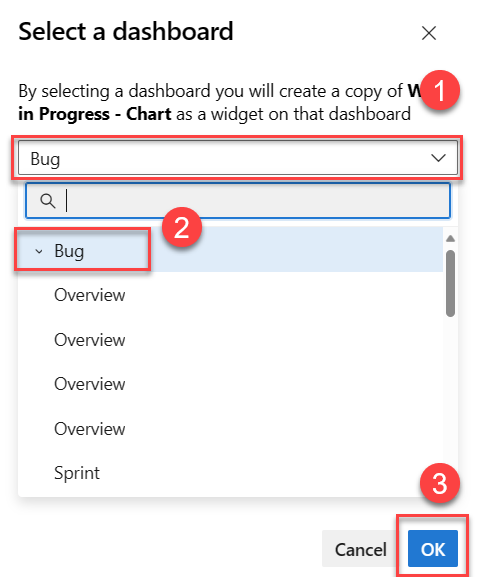
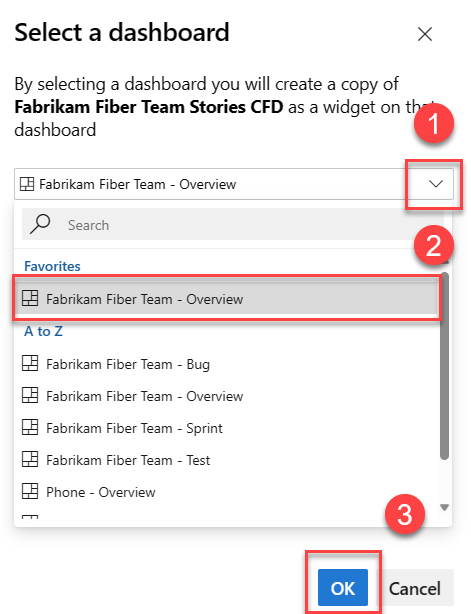
Select a dashboard from the dropdown menu, and then select OK.
You can only add charts associated with shared queries. Charts associated with queries under My Queries folder don't display the Add to dashboard option.
Add an in-context work tracking report
You can add each of the in-context Analytics reports to a dashboard.
Open the report, select the
actions icon, and select Copy to Dashboard.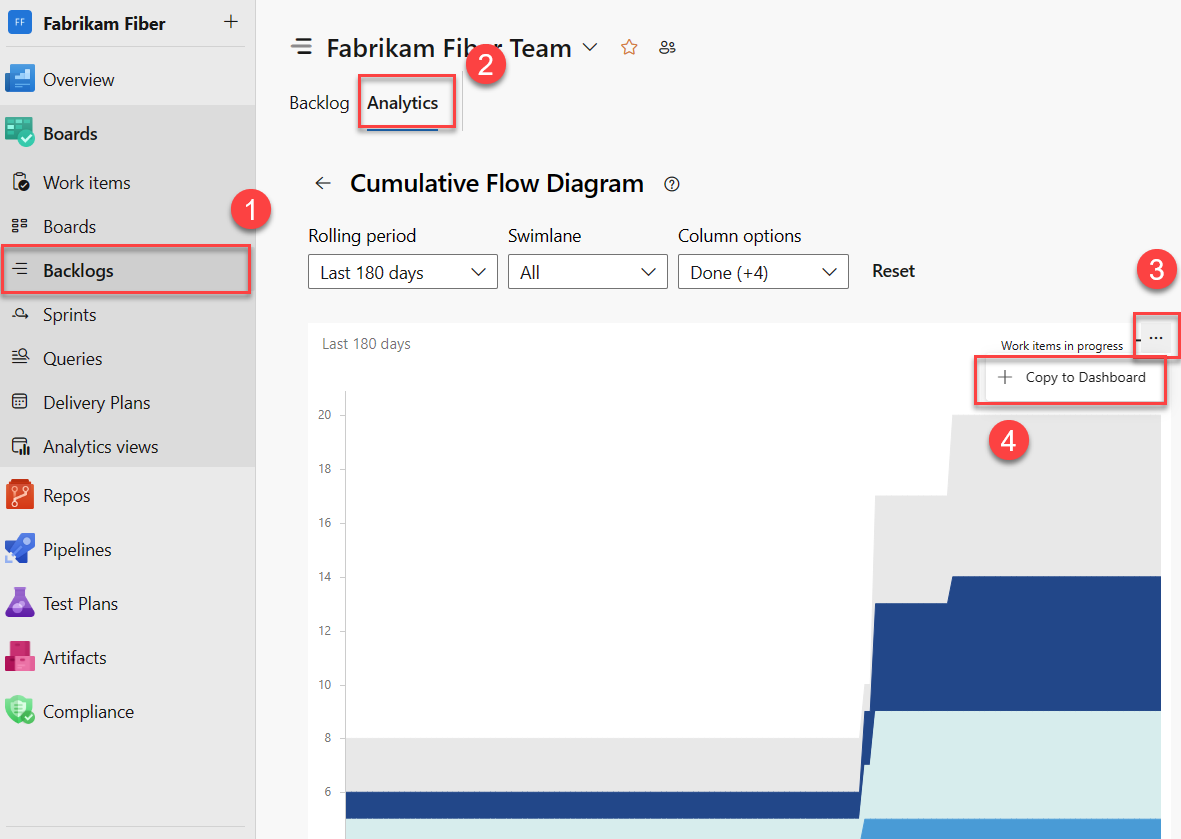
Select a dashboard from the dropdown menu, and then select OK.
(Optional) Open the dashboard and select
More actions for the widget to configure the size or change other chart properties.
There are many in-context reports that you can access from the web portal, but can't add to a dashboard. However, you may find a comparable widget listed in the widget catalog that tracks the same or similar data. If you find a widget that works, add it to the dashboard:
Add a build history chart
Each time you run a build, it logs information about the build, including:
- Run time
- Errors and warnings
- Status: Completed or Failed
Tip
You can also add this chart to a team dashboard from the widget catalog.
Sign in to your organization (
https://dev.azure.com/{yourorganization}) and go to your project.Select Pipelines > Pipelines to add a build history chart to a team dashboard. The Add to dashboard menu selection is disabled when you don't have permissions to add it to the dashboards of the selected team context.
The Build summary charts look similar to the following image.
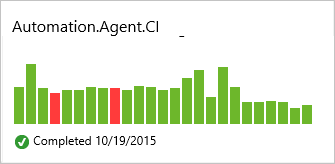
Hover over a bar to view build information and run time and select a bar to go to the build summary page.
Add a release summary chart
Each time a release gets deployed, it logs information about the release to each of its environments. You can add a release tile to your team dashboard to monitor release progress and gain quick access to each release.
Tip
You can also add this chart to a team dashboard from the widget catalog.
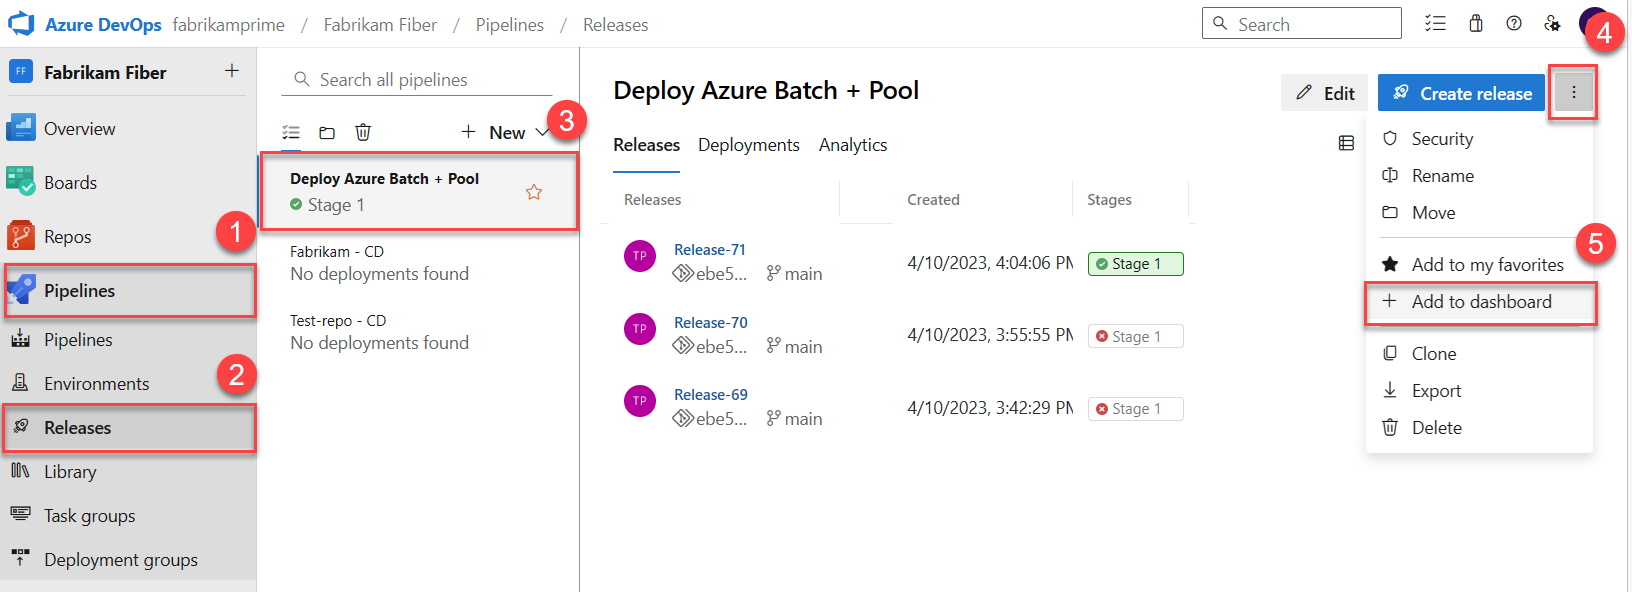
Sign in to your organization (
https://dev.azure.com/{yourorganization}) and go to your project.Select Pipelines > Releases to add a release definition chart to a team dashboard.
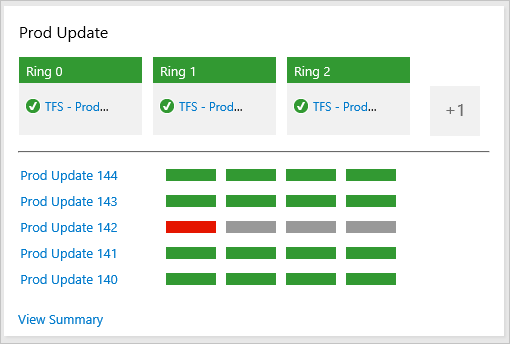
Release pipeline charts show the success (green), in progress (blue), cancellation (red), or nondeployment (grey) to an environment for the current and last four releases:
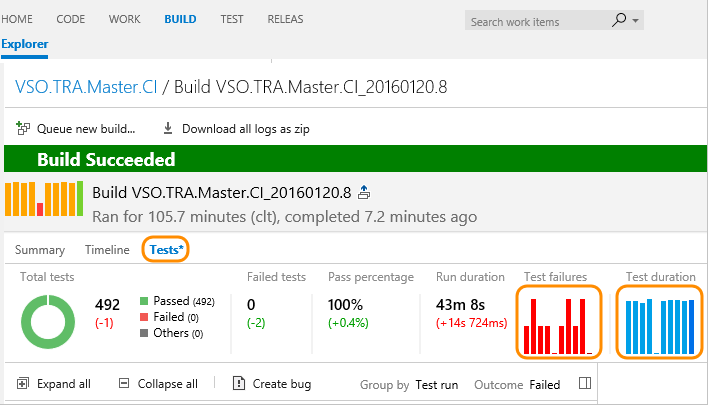
Add a test quality trend chart
You can add trends to the dashboard of the failures and duration of those tests that were run as part of a build.
Tip
You can also add a test result trend chart widget to a dashboard.
Sign in to your organization (
https://dev.azure.com/{yourorganization}) and go to your project.Open a build summary for a build pipeline to which you've added tests.
Open the Tests page.
Select the bar chart for either Test failures or Test duration.
Open the
Actions menu, select Add to dashboard, select the dashboard to add the chart to from the dropdown menu, and then OK.
For more information, see Review automated test results after a build.
Add a markdown repository file to a dashboard
To add a markdown file to a dashboard, you must complete the steps in Add Markdown to a dashboard, Add the Markdown widget.
As you update the Markdown file, changes automatically appear on the dashboard upon refresh.
Related articles
Feedback
Coming soon: Throughout 2024 we will be phasing out GitHub Issues as the feedback mechanism for content and replacing it with a new feedback system. For more information see: https://aka.ms/ContentUserFeedback.
Submit and view feedback for