How to view a USB ETW trace in Netmon
This article describes how to view an event trace file by using Netmon.
After you install Netmon and configure it for use with USB ETW files, as described in How to install Netmon and the USB ETW Parsers, you can use it to examine a trace file.
Opening an ETW file
To view a trace file in Netmon, on the Start screen, type "netmon" to open Netmon. Open the trace file by using one of the following methods:
- On the File menu, click Open, click Capture, and then select the .etl file.
- Click the Open Capture button and select the .etl file.
- Press CTRL+O and select the .etl file.
An event trace is made up of individual events, each of which indicates something that happened in the driver stack. Each event conforms to one of several types defined by the driver stack.
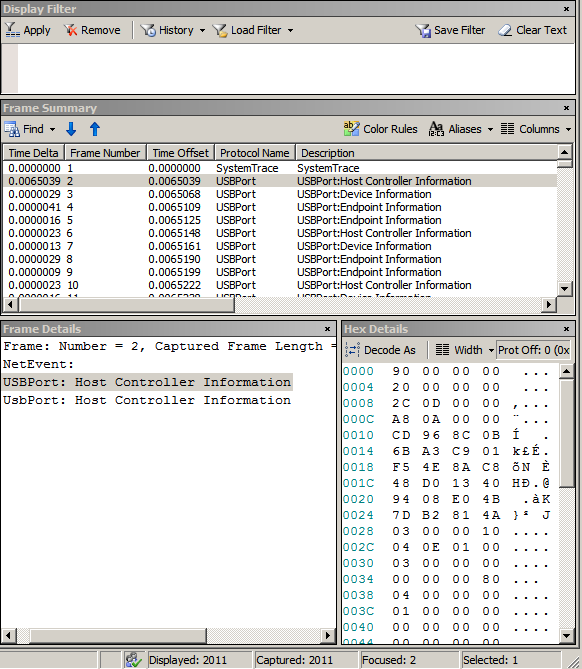
Observe that the events are listed in the Frame Summary pane. The preceding image shows evens from USB 2.0 driver stack. Note the following columns in this pane:
- Time Offset: The timestamp for the event, specified as an offset from the start time of the log.
- Protocol Name: The driver that logged the event. For USB events, the driver is USB Hub or USB Port.
- Description: A descriptive name for the event.
Select an event in the Frame Summary pane. Netmon displays the details for the event in the Frame Details and Hex Details panes. In the Frame Details pane, expand the items to examine the details of the event. For an example of using Netmon to examine a USB trace file, see Case Study: Troubleshooting an Unknown USB Device by Using ETW and Netmon.
New columns the USB ETW parser for USB 3.0 driver stack
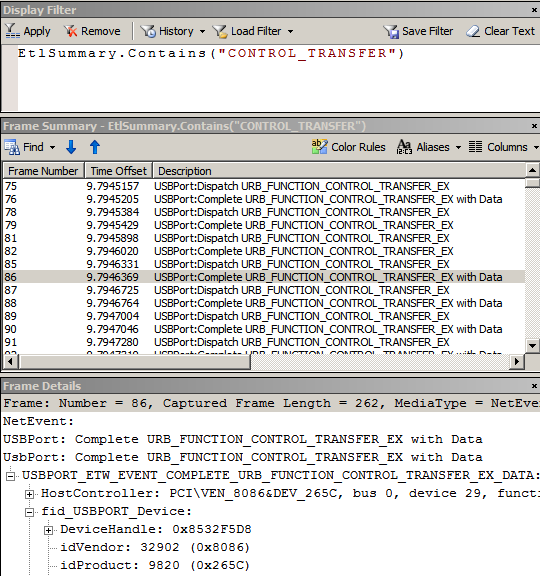
Important types of events from the USB 2.0 driver stack are also defined in the USB 3.0 driver stack. However, there are subtle differences between those types. For example, consider the USB control transfer completion event type (Description : USBPort:Complete URB_FUNCTION_CONTROL_TRANSFER_EX with Data):
For USB 2.0 driver stack event type, Frame Details pane shows idVendor (also known as USB VID) and idProduct (also known as USB PID). This image shows event trace for a USB 2.0 device connected to USB 2.0 host controller.
For USB 3.0 driver stack event type, Frame Details pane does not contain idVendor or idPid. That information is available by adding new columns to the Frame Summary pane as shown in this image.
Notice these new columns:
- USB Device Description
- USB Vid
- USB Pid
- USB Length
- USB Request Duration
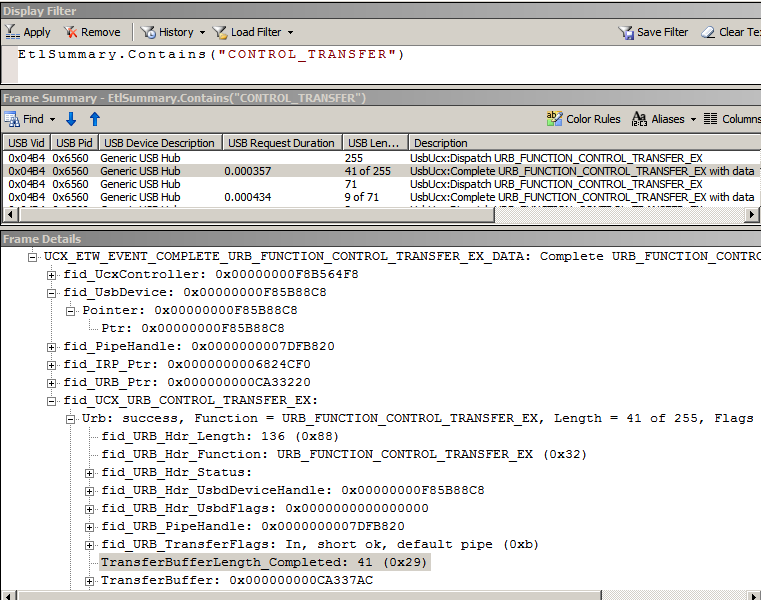
All USB event traces (USB 2.0 and USB 3.0) now show more information about the request as each URB completes. Notice values, such as, "41 of 255" under USB Length. Those values indicate the actual transfer length of each URB on completion with the context of the total request length (original TransferBufferLength specified by the client driver). Also, you can see how long (in seconds) it took for a request to complete under the USB Request Duration column.
Adding filters to the Display Filter pane
You can use capture filters to narrow down the event traces for a specific scenario. You can write new filters for event traces from USB 2.0 and USB 3.0 driver stacks:
USBIsError == 1      // Any error events from the USB drivers
USBIsDisconnect == 1 // Show when any device disconnected
All columns can be filtered. To create a filter, right-click a cell and select Add "<column name>" to Display Filter. Netmon creates a filter based on its value and the column name and adds it under the Display Filter pane.
Related topics
Feedback
Coming soon: Throughout 2024 we will be phasing out GitHub Issues as the feedback mechanism for content and replacing it with a new feedback system. For more information see: https://aka.ms/ContentUserFeedback.
Submit and view feedback for