Recording Hardware Performance (PMU) Events
Performance Monitor Unit(PMU) events are used to measure CPU performance and understand workloads CPU characterization. Each of the CPU vendors such as Arm, Intel, and AMD have detailed technical reference manual for the available PMU events on their platform. You can collect PMU Events either on ETW events such as CSwitch or sample them on the counter interrupt, whenever the event overflow occurs during execution.
Enumerating PMU events supported in the system
You can enumerate available PMU events using WPR.exe or Xperf.exe. Only a small subset of PMU events in CPU vendor’s documents are implemented in Windows HAL by default. However, WPR provides a way to extend PMU events that are not exposed as the available profile sources. The command below lists the PMU events supported on the running system.
wpr -pmcsources or xperf -pmcsources
The command output shows available PMU events, their default intervals, interval ranges, and the logger number that is currently using the events.
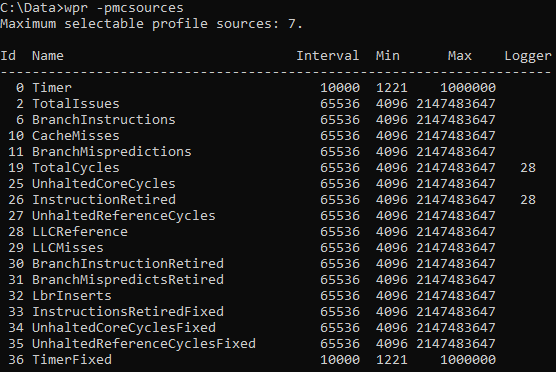
The PMU events are mapped on to Performance Monitoring Counters (PMC). However, the mapping is not necessarily 1 to 1 based on the implementation of the CPUs. Additionally, most CPUs provide a certain number of Performance Monitoring Counters (PMC) that can collect certain PMU events. For example, some CPUs provide four generic programmable counters and three fixed counters. Event names that end with ‘Fixed’ are for the fixed counters. Please make sure that you enable the right count of PMU events in the system.
Collecting PMU Events on ETW Events
CPUs have multiple Performance Monitoring Counters (PMCs) that can count PMU events. You can log those counter values whenever selected ETW events fire.
To log the PMC values with ETW events using Windows Performance Recorder (WPR), use <HardwareCounter> element to add the counter and ETW events in the custom profile. The example defines PMU events; TotalCycles and InstructionRetired and to collect them on the CSwitch events.
  <SystemProvider Id="SystemProvider_General_Mobile">
     <Keywords>
       <Keyword Value="ProcessThread" />
       <Keyword Value="Loader" />
       <Keyword Value="CSwitch" />
     </Keywords>
   </SystemProvider>

 <HardwareCounter Id="HC_PerfWorkloads.Base" Base="" Strict="true">
     <Counters>
       <Counter Value="TotalCycles"/>
       <Counter Value="InstructionRetired" />
      </Counters>
     <Events>
       <Event Value="CSwitch"/>
     </Events>
   </HardwareCounter>
The wpr profile xml element below shows how to reference the <HardwareCounter> defined above in the <SystemCollectorId>.
<SystemCollectorId Value="SystemCollector">
     <SystemProviderId Value="SystemProvider_General_Mobile" />
     <HardwareCounterId Value="HC_PerfWorkloads.Base"></HardwareCounterId>
</SystemCollectorId>
To log PMC values using Xperf.exe, use -pmc option. The example below starts one system session that collects InstructionRetired and TotalCycles on CSWITCH event and another event session.
Xperf.exe -on <tracing_flags> -pmc counters events [strict]
Ex>
xperf.exe -on BASE+CSWITCH+POWER+PROC_THREAD+LOADER+MEMINFO+MEMINFO_WS -pmc InstructionRetired,TotalCycles CSWITCH strict -start PMUPerfLogger -on ca92de02-0d94-43a3-9694-d60eb94f2f7d+Microsoft-Windows-Kernel-Pep+Microsoft-Windows-Kernel-Processor-Power:0xC2:4 -BufferSize 1024 -MinBuffers 32 -MaxBuffers 512
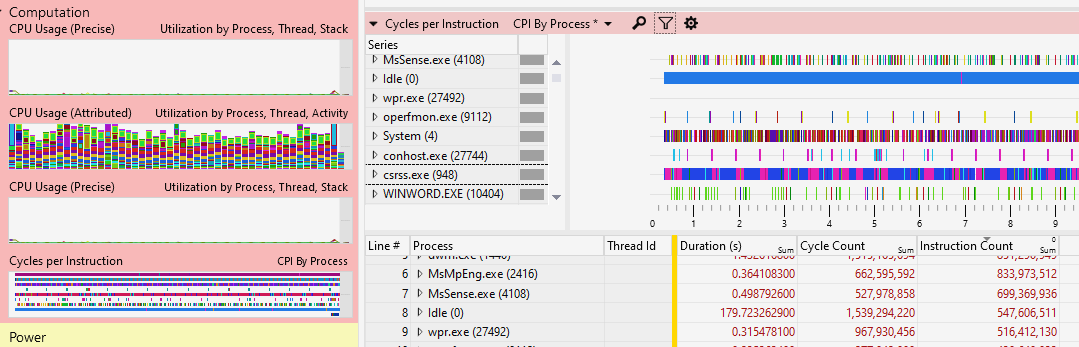
If you take trace with InstructionRetired, TotalCycles counters on CSwitch event in particular, and also with proper SystemProvider keyword such as ProcessThread , Loader, and CSwitch, latest Windows Performance Analyzer will display the Cycles per Instruction table.
Sampling on PMC Overflow
Besides sampling on time (count down of cycles) with typical sampled profiling, you can also sample the frequency of PMU events such as branch mispredicts, cache misses, or TLB misses.
To sample on PMU events in WPR, use <SampledCounters> in <HardwareCounter> element. The example below configures a hardware counter that is profiling on the InstructionRetired hardware events. Interval is in number of events of that type.
  <SystemProvider Id="SystemProvider_General_Mobile">
     <Keywords>
       <Keyword Value="ProcessThread" />
       <Keyword Value="Loader" />
       <Keyword Value="PmcProfile" />
     </Keywords>
   </SystemProvider>
   <HardwareCounter  Id="HC_Sampling.Base" Base="" Strict="true">
     <SampledCounters>
       <SampledCounter Value="InstructionRetired" Interval="100000"/>
     </SampledCounters>
   </HardwareCounter>
The WPR profile xml element below shows how to reference the <HardwareCounter> defined above in the <SystemCollectorId>.
   <SystemCollectorId Value="SystemCollector_General_Mobile">
     <SystemProviderId Value="SystemProvider_General_Mobile" />
     <HardwareCounterId Value="HC_Sampling.Base"/>
   </SystemCollectorId>
To sample on PMU events using Xperf.exe, use -pmcprofile option. The example below starts one system session that samples on InstructionRetired.
xperf -on proc_thread+loader+cswitch+dpc+interrupt+pmc_profile -pmcprofile instructionretired -stackwalk pmcinterrupt
Configuring Extended PMU Counter Configurations
Besides the architectural PMU events that you can enumerate through the command (-pmcsources), You can also configure non-architectural PMU events through either WPR custom profile or via registry settings. This capability was added to the Win10 Version 1903. Custom PMU event descriptions can be found in the data sheets or as shared by a hardware vendor. These counters are often specific for the exact processor model used.
Configuration using WPRP Custom Profile
The example below shows how to define such counters in the custom profile. Note that the Architecture attribute value is all upper case and case sensitive. WPR will however remind you with an exact error message if you forget.
   <MicroArchitecturalConfig Id="CounterConfig_Mine" Base="">
     <ProfileSources Architecture="ARM64" Family="8" Model="211" Description="Qualcomm Snapdragon 820">
        <ProfileSource Name="SomeCustomCounter" Event="0x3C" Interval="0x02000003" AllowsHalt="false" Persist="false"/>
     </ProfileSources>
     <ProfileSources Architecture="ARM64" Description="Some Generic Arm counter">
        <ProfileSource Name="SomeOtherCustomCounter" Event="0x3D" Interval="0x02000003" AllowsHalt="false" Persist="false"/>
     </ProfileSources>
   </MicroArchitecturalConfig>
Then use the extended counter configuration in <MicroArchitecturalConfigId> just like the built-in architectural counters.
<HardwareCounter Id="HC_PerfWorkloads.Base" Base="" Strict="true">
     <MicroArchitecturalConfigId Value="CounterConfig_Mine"></MicroArchitecturalConfigId>
     <Counters>
         <Counter Value="SomeCustomCounter"/>
         <Counter Value="InstructionRetired"/>
         <Counter Value="L3CacheAccess"/>
     </Counters>
     <Events>
       <Event Value="CSwitch"/>
     </Events>
   </HardwareCounter>
The strict flag in HardwareCounter will determine whether WPR will hard fault when registration fails. If strict is not specified, the tools will silently ignore the error and continue. If registration fails and one uses an unregistered event, it will still fail later. This allows flexibility as there are other legacy tools like registry settings to register the counters. Registering an PMU event with the same name will succeed if the existing event data has the same values. If the new programming conflicts with the old, the new registration will fail leaving the old one in place.
For Arm, one specifies custom counters by Event and AllowsHalt is optional. The values are found in Arm's core family datasheets, or the processor maker (e.g. Qualcomm) specific processor datasheet. For AMD and Intel processors one specifies Event and Unit as specified in their datasheets. For Intel in addition to Event and Unit, also some extended bits are available. These ExtendedBits are “CMask CMaskInvert AnyThread EdgeDetect” with each two digits as unsigned char. This field is optional, so you can omit it if you don’t need the special bits. For example;
<ProfileSource Name="L1D_PEND_MISS.PENDING_CYCLES_ANY" Event="0x48" Unit="0x01" Interval="0x02000003" ExtendedBits="01000100" />
Configuration Using the registry
You can also use the registry settings to configure non-architctural counters. Below registry example configures non-architecutural counters for Intel architecture. The mechanisms also work on other CPU implementations and refer to the vendor’s technical reference manual.
[HKEY_LOCAL_MACHINE\SYSTEM\CurrentControlSet\Control\WMI\ProfileSource\<Model>]
"Architecture"=dword:00000002
"Family"=dword:00000006
"Model"=dword:0000002D
[HKEY_LOCAL_MACHINE\SYSTEM\CurrentControlSet\Control\WMI\ProfileSource\<Model>\BR_INST_EXEC.NONTAKEN_CONDITIONAL]
"Event"=dword:00000088
"Unit"=dword:00000041
"Interval"=dword:00200003
[HKEY_LOCAL_MACHINE\SYSTEM\CurrentControlSet\Control\WMI\ProfileSource\<Model>\BR_INST_EXEC.TAKEN_CONDITIONAL]
"Event"=dword:00000088
"Unit"=dword:00000081
"Interval"=dword:00200003