Debug your app using Remote Console App Debugging
Here's how to debug your IoT Core console application remotely in Visual Studio:
You will first need to set up the Remote Debugger on your Windows IoT Core device. First follow the steps here to deploy any other Universal Windows Application on your device (try the HelloWorld project). This will copy all the required binaries to your device.
To start the remote debugger on your device, open a Web Browser on your PC and point it to
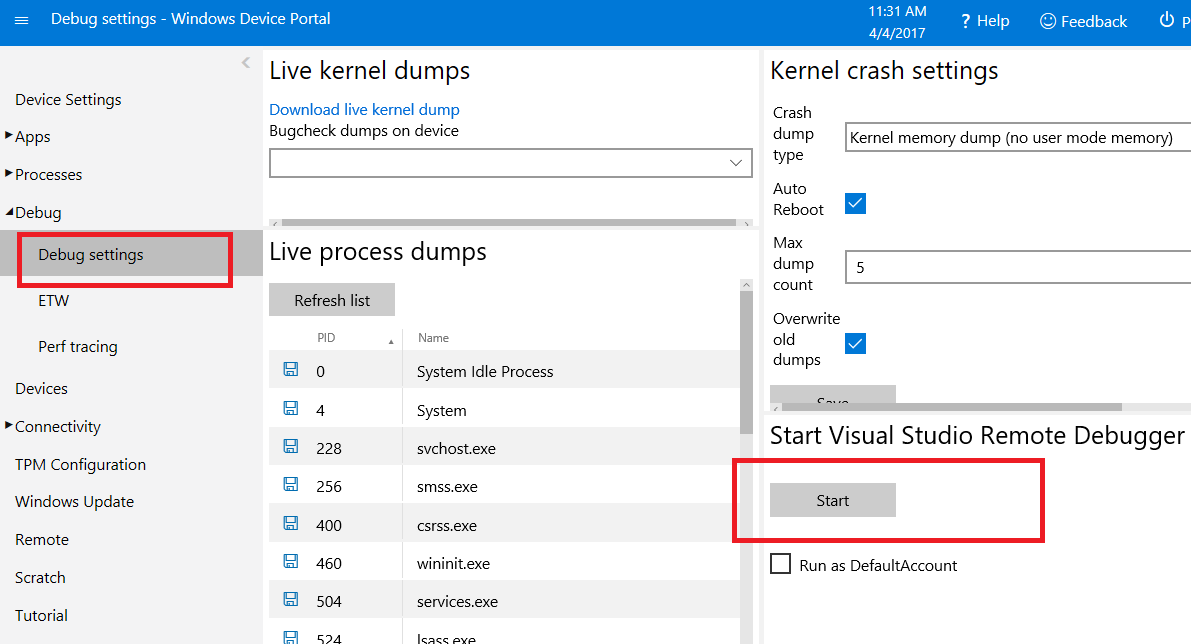
http://<device name/IP address>:8080to launch Windows Device Portal. In the credentials dialog, use the default username and password:Administrator,p@ssw0rd. Windows Device Management should launch and display the web management home screen.Now navigate to the Debug settings section of Windows Device Portal and click the Start button under Start Visual Studio Remote Debugger.

This will show pop-up a message box and give you the connection information.
In Visual Studio, you can configure your target by editing your project's properties (be sure to make all of the highlighted changes as appropriate to your board's name or IP address):

Note
If you're not seeing the image above, please go to the "Solution Explorer" in the context menu, and go to "Project Properties". You can find more information for project properties [here](/visualstudio/ide/managing-project-and-solution-properties?preserve-view=true.&view=vs-2017
Tip
You can use the IP address instead of the Windows IoT Core device name.
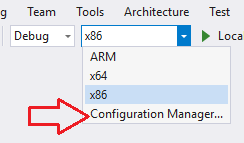
The project configuration needs to be modified to enable deployment. To do this, open the Configuration Manager by selecting the Configuration manger from the Solution Configuration drop-down menu on the toolbar.

From the Configuration Manager, ensure that the Deploy checkbox is selected for your project configuration (if this option is disabled, it is likely that the deployment options have not been fully entered into the Debugging tab of the project properties)

Now we're ready to deploy to the remote Windows IoT Core device. Simply press F5 (or select Debug | Start Debugging) to start debugging our app. You can also use Build | Deploy Solution to simply deploy your application without starting a debug session.
Note
When run from Visual Studio, the output will not display anywhere, but you will be able to set breakpoints, see variable values, etc.
To stop the app, press on the 'Stop Debugging' button (or select Debug | Stop Debugging).
You can now run the application. Simply open a PowerShell/SSH connection (instructions can be found here for PowerShell and here for SSH) and enter the Remote Command you specified above.

Once you are done debugging your application, remember to stop the remote debugger on the Windows IoT Core device. You can do this by navigating to Debug settings section of Windows Device Portal and clicking on the Stop Remote Debugger button.
