Exchange transport rule report in the new Exchange admin center in Exchange Online
The Exchange transport rule report in the new Exchange admin center (new EAC) displays information on messages that were affected by mail flow rules (also known as transport rules).
Note
By default, the report shows data for the last 7 days. If the report is empty, try changing the date range. It could take up to 24 hours to reflect the Transport Rule data in the Transport Rule report. For permissions that are required to use this report, see Permissions required to view mail flow reports.
To view the report in the new EAC at https://admin.exchange.microsoft.com, go to Reports > Mail flow > and then select Exchange transport rule report on the Mail flow reports page. To go directly to the report, open https://admin.exchange.microsoft.com/#/reports/transportruledetails.
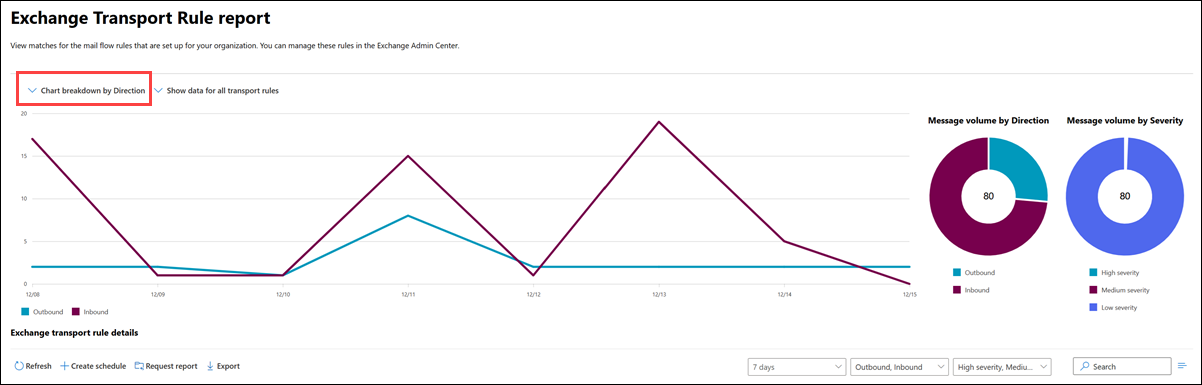
By default, Chart breakdown by Severity is selected, and the follow charts are shown:
- A line graph that shows the number of inbound and outbound messages per day that were affected by mail flow rules.*
- Message volume by direction: A doughnut graph that shows the total number of messages and portion of Outbound and Inbound messages that were affected by mail flow rules.***
- Message volume by severity A doughnut graph that shows the total number of messages and portion of messages that were affected by High severity, Medium severity, and Low severity mail flow rules.**
* If you hover over the line on the chart for a specific day, you'll see the number of messages for that day.
** If you hover over a specific color in the chart, you'll see the total number of messages in the category for the entire time period.
If you change the chart view to Chart breakdown by severity, the line graph changes to show the number of messages that were affected by High severity, Medium severity, and Low severity mail flow rules.
By default, Show data for all transport rules is selected, but if you click on that value, you can select a specific mail flow rule to show data for.
The following information is shown in the details table below the graph:
- Date
- Transport rule
- Subject
- Sender address
- Recipient address
- Severity
- Direction
You can sort the information in the details table by clicking on a column header.
To quickly filter the results by Transport rule or Subject, click Search ![]() and start typing a value.
and start typing a value.
To filter the results, use the boxes. The following filters are available:
- Date: 7 days is selected by default, but you can select 30 days, 90 days or a Custom start date that's less than 90 days.
- Direction: Outbound, Inbound is selected by default, but you can select either value by itself.
- Severity: High severity, Medium severity, Low severity are selected by default, but you can select one or more severity values.
Click Export to export the displayed results to a .csv file.
See also
For more information about other mail flow reports, see Mail flow reports in the new EAC.