Set general performance session options
Applies to: ![]() Visual Studio
Visual Studio ![]() Visual Studio for Mac
Visual Studio for Mac
Note
This article applies to Visual Studio 2017. If you're looking for the latest Visual Studio documentation, see Visual Studio documentation. We recommend upgrading to the latest version of Visual Studio. Download it here
You can set the collection method and profiling data naming conventions for a Visual Studio Profiling Tools performance session on the General page of the properties dialog box for the performance session. To open this dialog box from Performance Explorer, right-click the performance session, and then click Properties.
Choosing data collection methods
You set the base collection method by selecting one of the options under Profiling collection. The options are described in the following table:
| Option | Article |
|---|---|
| Sampling. The sampling method collects profiling information at regular intervals. This method is useful for finding processor utilization issues and is the suggested method for starting most performance investigations. | - Collecting Performance Statistics by Using Sampling |
| Instrumentation. The instrumentation method injects into a copy of a module profiling code that records each entry, exit, and function call of the functions in the module during a profiling run. This method is useful for gathering detailed timing information about a section of your code and for understanding the impact of input and output operations on application performance. | - Collecting Detailed Timing Data by Using Instrumentation |
| Concurrency. The concurrency method collects data for each event that blocks execution of your code, such as when a thread waits for locked access to an application resource to be freed. This method is useful for analyzing multi-threaded applications. | - Collecting Thread and Process Concurrency Data |
You can collect .NET memory data by using the sampling or instrumentation methods. You select the type of data under .NET memory profiling.
| Option | Article |
|---|---|
| Collect .NET object allocation information. By default, data includes the number and size of allocated objects. Select or clear this check box to enable or disable .NET memory data collection. | - Collecting .NET Memory Allocation and Lifetime Data |
| Also collect .NET object lifetime information. Select this check box to include data about the garbage collection generations that were used to reclaim the memory objects. | - Collecting .NET Memory Allocation and Lifetime Data |
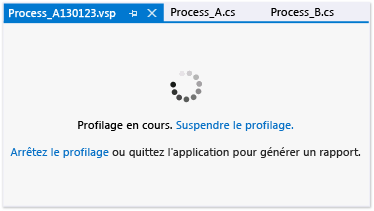
A profiling session page appears when you start to profile an application, where you can pause, resume, and stop profiling.

Set profiling data file options
| Option | Article |
|---|---|
| Report. By default, the profiling data (.vsp) file is given the name of the profiled application and is located in the solution or project folder. A date string is also appended to the name, and an incremented number is added to data files that otherwise would have duplicate names. You can change these options. | - How to: Set Performance Data File Name Options |