Analyzing coded UI tests using coded UI test logs
Applies to: ![]() Visual Studio
Visual Studio ![]() Visual Studio for Mac
Visual Studio for Mac
Note
This article applies to Visual Studio 2017. If you're looking for the latest Visual Studio documentation, see Visual Studio documentation. We recommend upgrading to the latest version of Visual Studio. Download it here
Coded UI test logs filter and record important information about your coded UI test runs. The logs are presented in a format that allows for debugging issues quickly.
Note
Coded UI Test for automated UI-driven functional testing is deprecated. Visual Studio 2019 is the last version where Coded UI Test will be fully available. We recommend using Playwright for testing web apps and Appium with WinAppDriver for testing desktop and UWP apps. Consider Xamarin.UITest for testing iOS and Android apps using the NUnit test framework. To reduce the impact on users some minimum support will still be available in Visual Studio 2022 Preview 4 or later.
Step 1: Enable logging
Depending on your scenario, use one of the following methods to enable the log:
If there's no App.config file present in your test project:
Determine which QTAgent*.exe process is launched when you run your test. One way to do this is to watch the Details tab in Windows Task Manager.
Open the corresponding .config file from the %ProgramFiles(x86)%\Microsoft Visual Studio\<version>\<edition>\Common7\IDE folder. For example, if the process that runs is QTAgent_40.exe, open QTAgent_40.exe.config.
Modify the value of EqtTraceLevel to the log level you want.
<!-- You must use integral values for "value".
     Use 0 for off, 1 for error, 2 for warn, 3 for info, and 4 for verbose. -->
<add name="EqtTraceLevel" value="4" />
Save the file.
If there's an App.config file present in your test project:
Open the App.config file in the project, and add the following code under the configuration node:
<system.diagnostics>
  <switches>
    <add name="EqtTraceLevel" value="4" />
  </switches>
</system.diagnostics>`
Enable logging from the test code itself:
Microsoft.VisualStudio.TestTools.UITesting.PlaybackSettings.LoggerOverrideState = HtmlLoggerState.AllActionSnapshot;
Step 2: Run your coded UI test and view the log
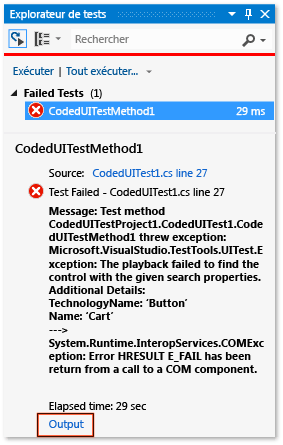
When you run a coded UI test with the modifications to the QTAgent*.exe.config file in place, you see an output link in the Test Explorer results. Log files are produced not only when your test fails but also for successful tests when the trace level is set to verbose.
On the Test menu, choose Windows and then select Test Explorer.
On the Build menu, choose Build Solution.
In Test Explorer, select the coded UI test you want to run, open its shortcut menu, and then choose Run Select Tests.
The automated tests run and indicate if they passed or failed.
Tip
To view Test Explorer, choose Test > Windows, and then choose Test Explorer.
Choose the Output link in the Test Explorer results.
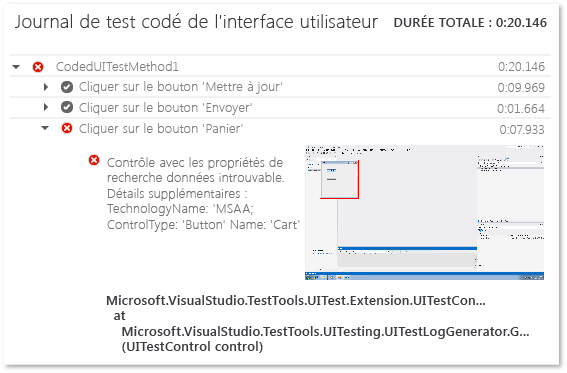
This displays the output for the test, which includes a link to the action log.
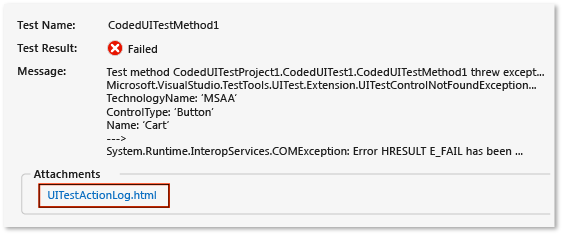
Choose the UITestActionLog.html link.
The log is displayed in your web browser.