Tutorial: Create a paginated report and upload it to the Power BI service
APPLIES TO: ![]() Power BI Report Builder
Power BI Report Builder ![]() Power BI Desktop
Power BI Desktop
This tutorial explains how to connect to a sample Azure SQL database, use a wizard in Power BI Report Builder to create a paginated report with a table that wraps to multiple pages, and then upload the paginated report to any workspace in the Power BI service.
Here are the steps you complete in this tutorial:
- Create an Azure sample database.
- Create a matrix in Power BI Report Builder with the help of a wizard.
- Format the report with title, page numbers, and column headings on each page.
- Format the currency.
- Upload the report to the Power BI service.
Prerequisites
Here are the prerequisites for creating the paginated report:
Install Power BI Report Builder from the Microsoft Download Center for free.
If you don't have an Azure subscription, create a free account.
Follow the quickstart Create an Azure SQL database sample in the Azure portal. Copy and save the value in the Server name box on the Overview tab. Remember the user name and password you created in Azure.
License requirements for publishing Power BI paginated reports (.rdl files) are the same as for Power BI reports (.pbix files).
- With a free license, you can publish paginated reports to My Workspace in the Power BI service. For more information, see Feature availability for users with free licenses in the Power BI service.
- With a Power BI Pro license or a PPU license, you can publish paginated reports to other workspaces. You also need at least a contributor role in the workspace.
Create the matrix with a wizard
Start Power BI Report Builder from your computer.
The Getting Started dialog box opens.
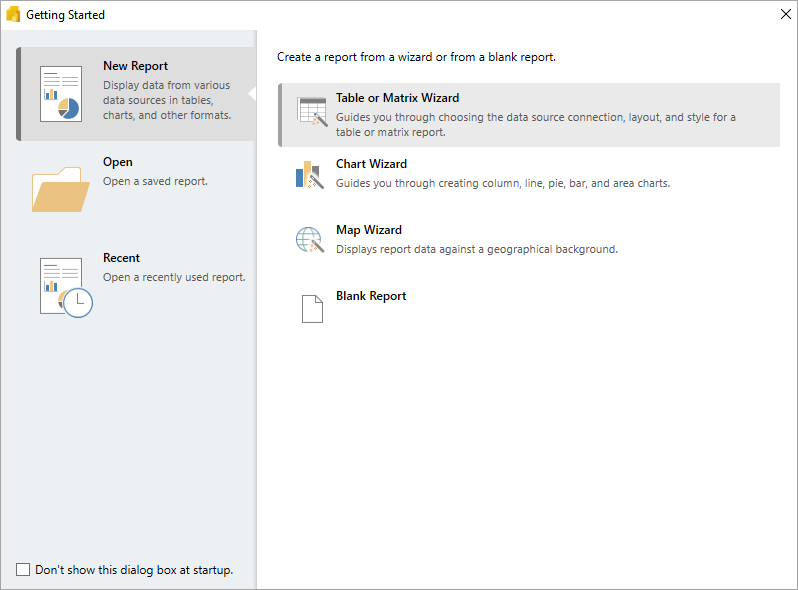
In the left pane, verify that New Report is selected, and in the right pane, select Table or Matrix Wizard.
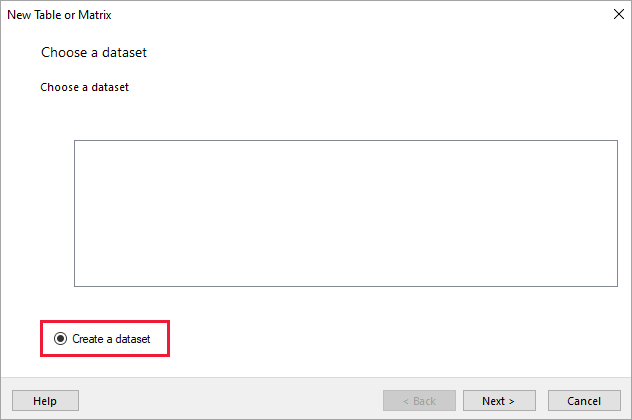
In the Choose a dataset page, select Create a dataset > Next.
In the Choose a connection to a data source page, select New.
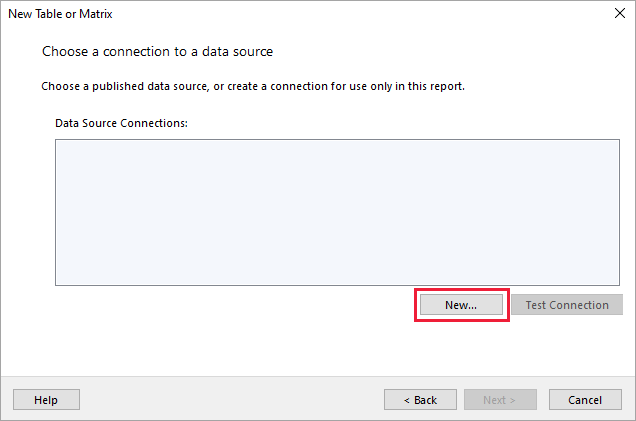
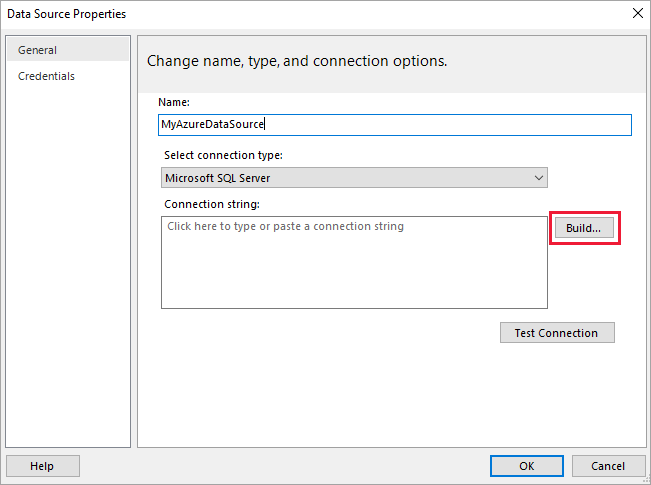
The Data Source Properties dialog box opens.
You can name a data source anything you want, using characters and underscores. For this tutorial, in the Name box, type MyAzureDataSource.
In the Select connection type box, select Microsoft Azure SQL Database.
Select Build next to the Connection string box.
The Connection Properties dialog box opens.
In the Azure portal: Go back to the Azure portal and select SQL databases.
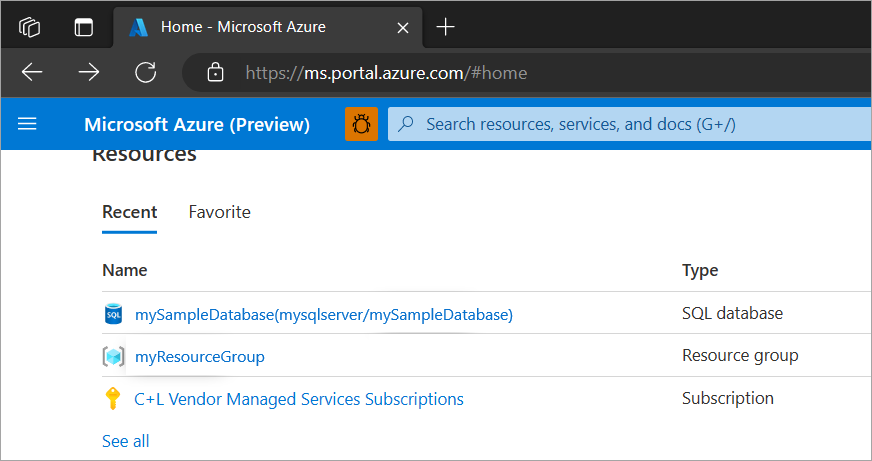
Select the Azure SQL database you created in the quickstart "Create an Azure SQL database sample in the Azure portal" in the Prerequisites section of this article.
On the Overview tab, copy the value in the Server name box.
In Report Builder: Go back to Report Builder. In the Connection Properties dialog box, under Server name, paste the server name you copied.
For Log on to the server, make sure Use SQL Server Authentication is selected, then type the user name and password you created in Azure for the sample database.
Under Connect to a database, select the drop-down arrow and select the database name you created in Azure.

Select Test Connection. You see the Test results message that Test connection succeeded.
Select OK > OK.
Now in the Connection string box, Report Builder displays the connection string you just created.
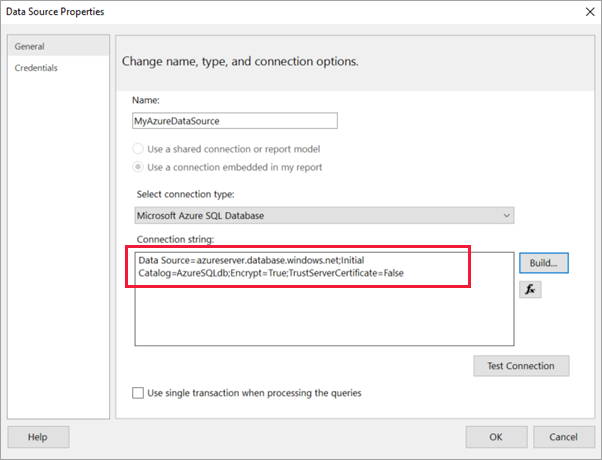
Select OK.
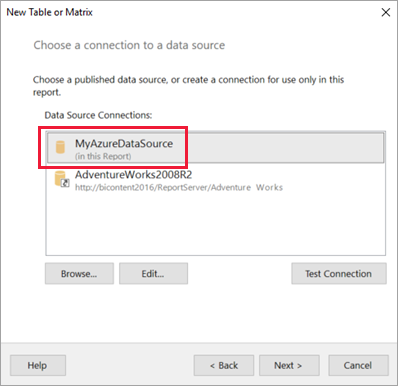
In the Choose a connection to a data source page, you see "(in this Report)" under the data source connection you just created. Select that data source > Next.
Enter the same user name and password in the box > Next.
In the Design a query page, expand SalesLT, expand Tables, and select these tables:
- Address
- Customer
- Product
- ProductCategory
- SalesOrderDetail
- SalesOrderHeader
Because Relationships > Auto Detect is selected, Report Builder detects the relationships between these tables.
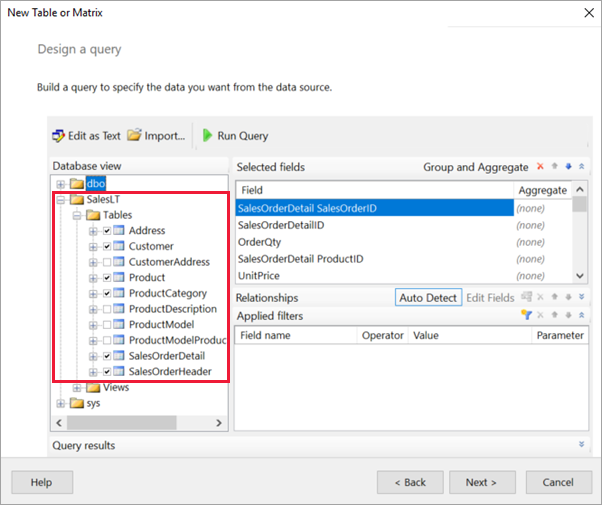
Select Run Query. Report Builder displays the Query results.
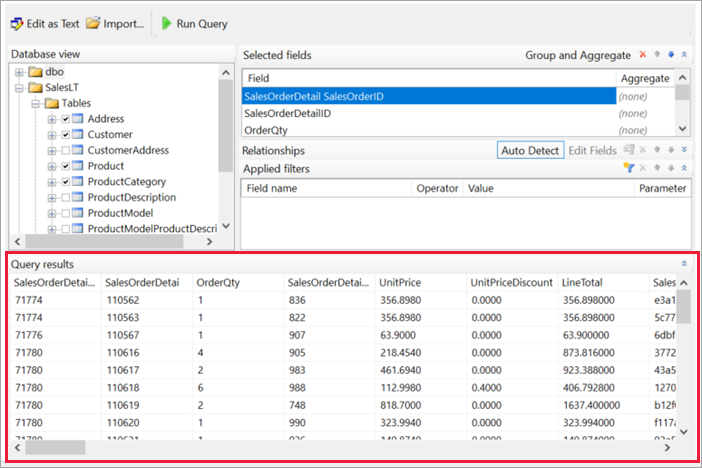
Select Next.
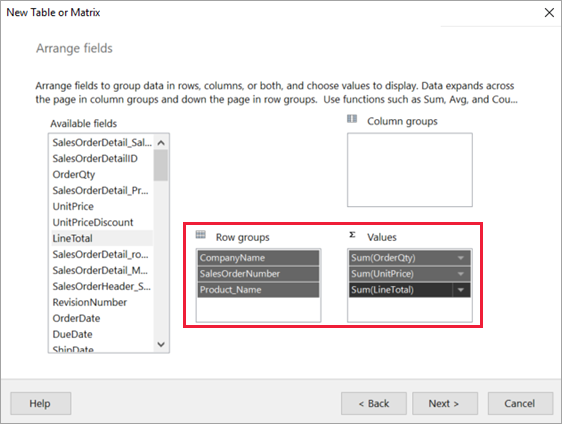
In the Arrange fields page, drag these fields from the Available fields box to the Row groups box:
- CompanyName
- SalesOrderNumber
- Product_Name
Drag these fields from the Available fields box to the Values box:
- OrderQty
- UnitPrice
- LineTotal
Report Builder automatically made the fields in the Values box sums.
In the Choose the layout page, keep all the default settings, but clear the checkbox next to Expand/collapse groups. In general, the expand/collapse groups feature is great, but this time you want the table to wrap to multiple pages.
Select Next > Finish. The table is displayed on the design surface.
What you've created
Let's pause for a moment to look at the results of the wizard.
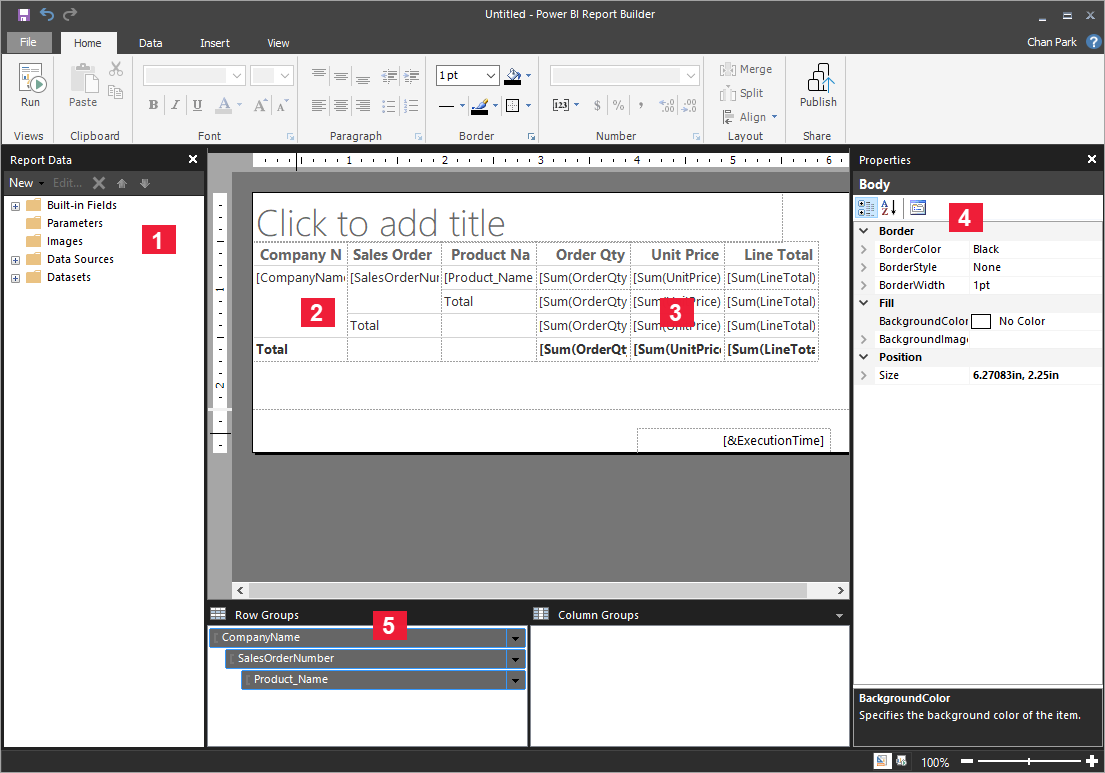
In the Report Data pane, you see the embedded Azure data source and the embedded dataset based on it, both of which you created.
The design surface is about 6 inches wide. On the design surface, you see the matrix, displaying column headings and placeholder values. The matrix has six columns and appears to be only five rows tall.
Order Qty, Unit Price, and Line Total are all sums, and each row group has a subtotal.
You still don't see actual data values. You need to run the report to see them.
In the Properties pane, the selected matrix is called Tablix1. A tablix in Report Builder is a data region that displays data in rows and columns. It can be either a table or a matrix.
In the Grouping pane, you see the three row groups you created in the wizard:
- CompanyName
- Sales Order
- Product Name
This matrix doesn't have any column groups.
Run the report
To see the actual values, you need to run the report.
Select Run in the Home toolbar.
Now you see the values. The matrix has many more rows than you saw in Design view! Note that Report Builder says it's page 1 of 2?. Report Builder loads the report as quickly as possible, so it only retrieves enough data for a few pages at a time. The question mark indicates that Report Builder hasn't loaded all the data yet.
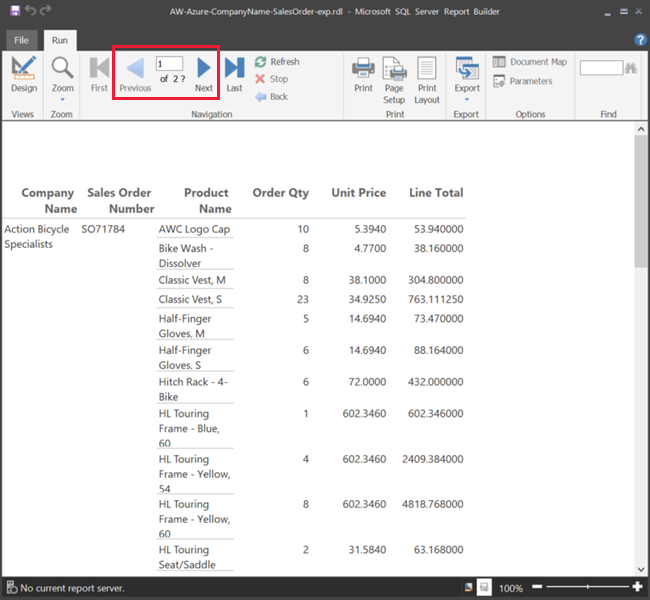
Select Print Layout. The report will be in this format when you print it. Report Builder now knows the report has 33 pages, and has automatically added a date and time stamp in the footer.
Format the report
Now you have a report with a matrix that wraps to 33 pages. Let's add some other features and improve how it looks. You can run the report after every step, if you want to see how it's coming along.
- On the Run tab of the ribbon, select Design, so you can continue modifying it.
Set page width
Typically a paginated report is formatted for printing, and a typical page is 8 1/2 X 11 inches.
Drag the ruler to make the design surface 7 inches wide. The default margins are 1 inch on each side, so the side margins need to be narrower.
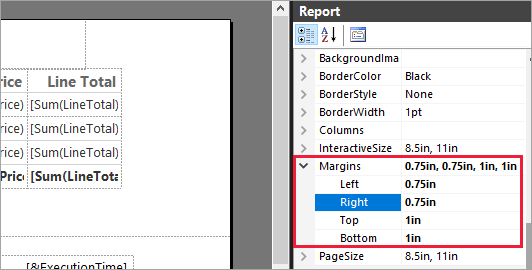
Click in the gray area around the design surface to show the Report properties.
If you don’t see the Properties pane, select the View tab > Properties.
Expand Margins and change Left and Right from 1 inch to 0.75 inch.
Add a report title
Select the words Click to add title at the top of the page, then type Sales by Company.
Select the title text, and in the Properties pane under Font, change Color to Blue.
Add a page number
You noticed the report has a date and time stamp in the footer. You can add a page number to the footer, too.
At the bottom of the design surface, you see [&ExecutionTime] on the right in the footer.
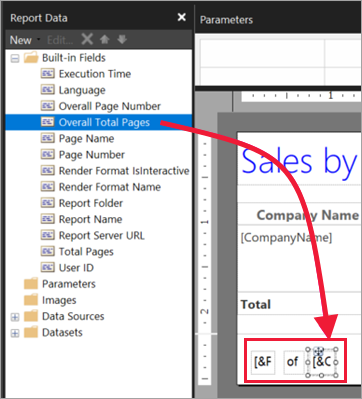
In the Report Data pane, expand the Built-in Fields folder. Drag Page Number to the left side of the footer, at the same height as [&ExecutionTime].
Drag the right side of the [&PageNumber] box to make it square.
On the Insert tab, select Text Box.
Click to the right of [&PageNumber], type "of", then make the text box square.
Drag Overall Total Pages to the footer, to the right of "of", then drag its right side to make it square, too.
Make the table wider
Now you can make the matrix wide enough to fill the width of the page, and make the text columns wider so the names don't scroll as much.
Select the matrix, then select the Company Name column.
Hover over the gray bar at the top of the matrix at the right edge of the Company Name column. Drag to the right, until the column ends at 1 3/8 inches.
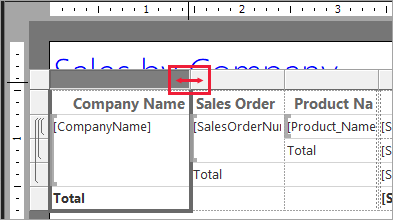
Drag the right edge of Product Name until the column ends at 3 3/4 inches.
Now the matrix is almost as wide as the print area.
Format the currency
If you noticed when you ran the report, the dollar amounts aren't formatted as currency yet.
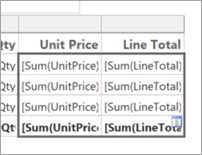
Select the upper-left [Sum(OrderQty)] cell, hold down the Shift key, and select the lower-right [Sum(LineTotal)] cell.
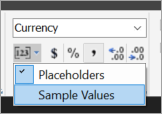
On the Home tab, select the dollar sign ($) currency symbol, then select the arrow next to Placeholder styles > Sample Values.
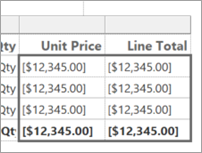
Now you can see the values are formatted as currency.
Add column headers on each page
One more formatting improvement before publishing the report to the Power BI service: making the column headers show up on each page in the report.
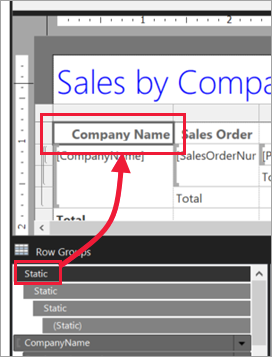
In the far-right end of the top bar in the Grouping pane, select the drop-down arrow > Advanced Mode.
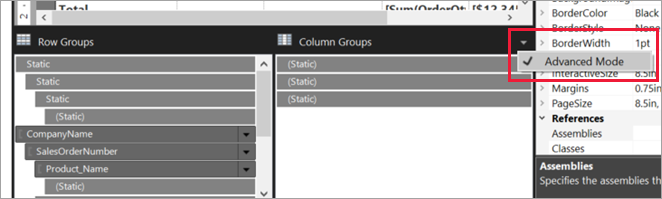
Select the top Static bar in the Row Groups. You see that the Company Name cell in the matrix is selected.
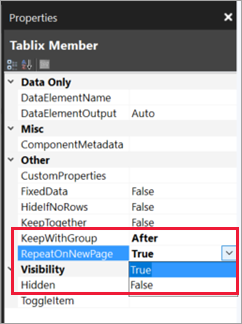
In the Properties pane, you're looking at the properties for Tablix Member. Set KeepWithGroup to After and RepeatOnNewPage to True.
It's time to run the report and see how it looks now.
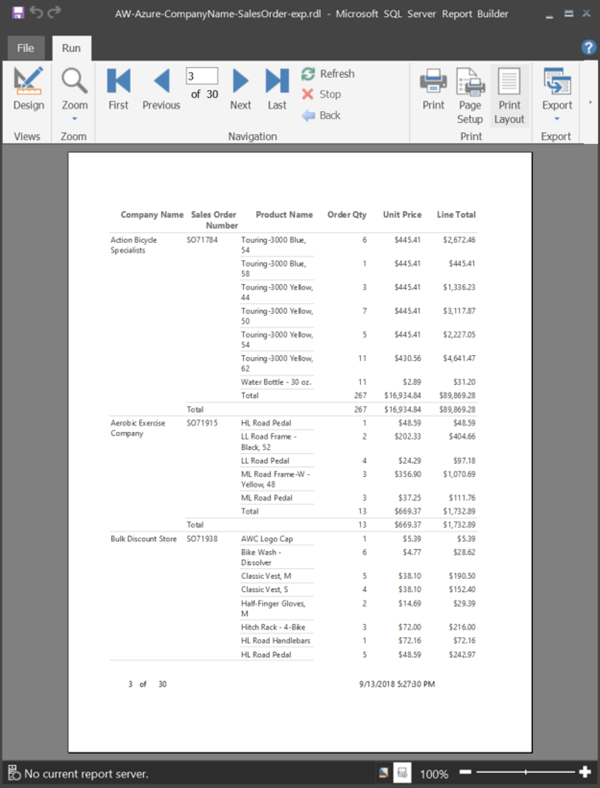
Select Run on the Home tab.
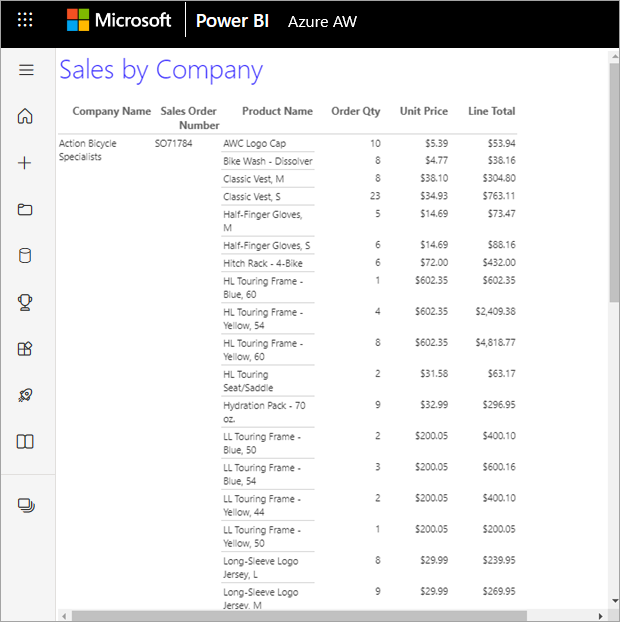
Select Print Layout, if it's not already selected. Now the report has 29 pages. Scroll through a few pages. You see the currency is formatted, the columns have headings on every page, and the report has a footer with page numbers and date and time stamp on every page.
Save the report to your computer.
Upload the report to the service
Now that you've created this paginated report, it's time to upload it to the Power BI service.
In the Power BI service nav pane, select Workspaces > Create workspace.
Name your workspace Azure AW or other unique name. You're the only member for now.
In your new workspace, select Upload > Browse. Navigate to where you saved the file > Open.
Power BI imports your file, and you see it under Reports on the App list page.
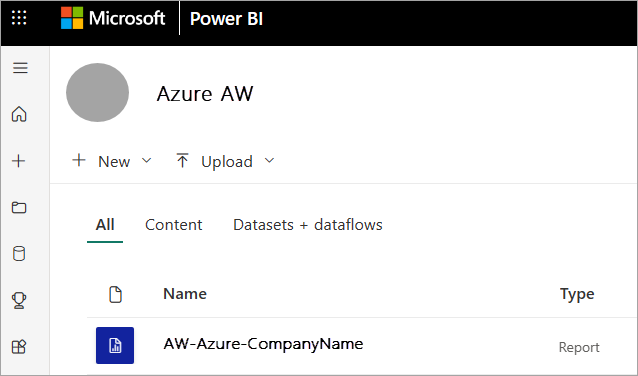
Select the report to view it.
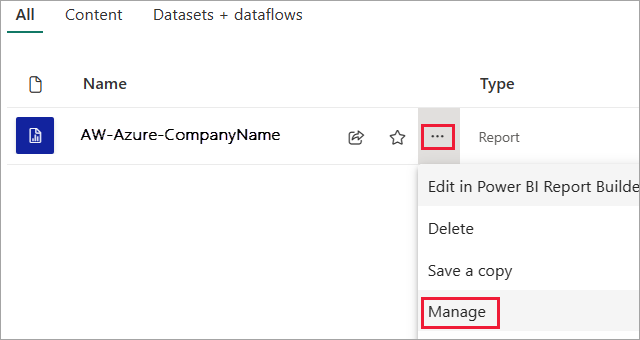
If you get an error, you might need to reenter your credentials. Select the ellipses to the right of the report, then choose Manage.
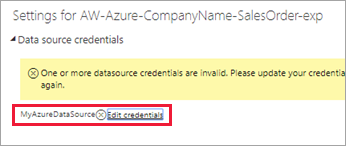
Select Edit credentials and enter the credentials you used in Azure when you created the Azure database.
Now you can view your paginated report in the Power BI service.
Next steps
משוב
בקרוב: במהלך 2024, נפתור בעיות GitHub כמנגנון המשוב לתוכן ונחליף אותו במערכת משוב חדשה. לקבלת מידע נוסף, ראה: https://aka.ms/ContentUserFeedback.
שלח והצג משוב עבור