Azure Kubernetes ネットワーク ポリシー
ネットワーク ポリシーは、ネットワーク セキュリティ グループ (NSG) が VM にマイクロセグメンテーションを提供するのと同じように、ポッドにマイクロセグメント化を提供します。 Azure ネットワーク ポリシーマネージャーの実装では、標準の Kubernetes ネットワーク ポリシーの仕様がサポートされます。 ラベルを使用してポッドのグループを選択し、これらのポッドとの間のトラフィックをフィルター処理するイングレスとエグレスの規則の一覧を定義できます。 Kubernetes ネットワーク ポリシーの詳細については、Kubernetes のドキュメントを参照してください。

Azure ネットワークポリシー Management の実装は、コンテナーの仮想ネットワーク統合を提供する Azure CNI と連携します。 ネットワーク ポリシー マネージャーは、Linux および Windows Server でサポートされています。 この実装でトラフィック フィルター処理を適用するには、Linux IPTables または Windows Server の Host Network Service (HNS) ACLPolicies に定義されているポリシーに基づいて許可と拒否の IP 規則を構成します。
Kubernetes クラスターのセキュリティの計画
ご自身のクラスターにセキュリティを実装する場合は、ネットワーク セキュリティ グループ (NSG) を使用して、クラスター サブネットを出入りするトラフィック (南北のトラフィック) をフィルター処理します。 クラスター内のポッド間のトラフィック (東西のトラフィック) には Azure ネットワーク ポリシー マネージャー を使用します。
Azure ネットワーク ポリシー マネージャーの使用
次の方法で Azure ネットワーク マネージャーを使用して、ポッドにマイクロセグメンテーションを提供できます。
Azure Kubernetes Service (AKS)
ネットワークポリシーマネージャー は AKS でネイティブに使用でき、クラスターの作成時に有効にすることができます。
詳細については、「Azure Kubernetes Service (AKS) のネットワーク ポリシーを使用したポッド間のトラフィックの保護」を参照してください。
Azure 内での自作 (DIY) Kubernetes クラスター
DIY クラスターの場合は、最初に CNI プラグインをインストールし、クラスター内のすべての仮想マシンで有効にします。 詳細については、自身でデプロイした Kubernetes クラスター用プラグインのデプロイに関するページをご覧ください。
クラスターがデプロイされたら、次の kubectl コマンドを実行して、Azure ネットワーク ポリシー デーモンセット をダウンロードして、クラスターに適用します。
Linux の場合:
kubectl apply -f https://raw.githubusercontent.com/Azure/azure-container-networking/master/npm/azure-npm.yaml
Windows の場合:
kubectl apply -f https://raw.githubusercontent.com/Azure/azure-container-networking/master/npm/examples/windows/azure-npm.yaml
また、ソリューションはオープン ソースで、コードは Azure コンテナー ネットワーク リポジトリから入手できます。
Azure NPM を使用したネットワーク構成の監視と視覚化
Azure ネットワーク ポリシー マネージャーには、お客様の構成を監視して理解を深めることができる有益な Prometheus メトリックが含まれています。 Azure portal または Grafana Labs に組み込まれている視覚化を提供します。 これらのメトリックの収集を開始するには、Azure Monitor または Prometheus サーバーを使用します。
Azure ネットワークポリシーマネージャー メトリックのベネフィット
以前はユーザーがネットワーク構成について学習するには、クラスター ノード内で iptables および ipset のコマンドを実行するしかなく、これによる詳細は中断して、出力を理解するのが困難でした。
全体的に、メトリックには次のものが用意されています。
ポリシー、ACL ルール、ipsets、ipset エントリ、および特定の ipset 内のエントリの数
個々の OS 呼び出しと kubernetes リソース イベントの処理の実行時間 (中央値、90番目の パーセンタイル、99番目の パーセンタイル)
kubernetes リソース イベントを処理するためのエラー情報 (リソースイベントはOS 呼び出しが失敗すると失敗します)
メトリックのユース ケースの例
Prometheus AlertManager を使用したアラート
以下のアラートの構成を参照してください。
OS 呼び出しで ネットワークポリシーマネージャー に障害が発生したとき、またはネットワーク ポリシーを変換するときにアラートを生成します。
create イベントの変更を適用する中央値の時間が 100 ミリ秒を超えたときにアラートを生成します。
Grafana ダッシュボードまたは Azure Monitor ブックを使用した視覚化とデバッグ
ポリシーによって作成される IPTable の規則の数を確認します (大量の数の IPTable の規則を使用すると、待機時間が少し長くなる可能性があります)。
クラスター数 (ACL など) を実行時間に関連付けます。
特定の IPTables 規則で ipset のわかりやすい名前を取得します (例:
azure-npm-487392はpodlabel-role:databaseを表す)。
サポートされるすべてのメトリック
サポート対象のメトリックのリストは次のとおりです。 任意の quantile ラベルには取りうる値 0.5、0.9 および 0.99 があります。 任意の had_error ラベルには取りうる値 false および true があり、操作が成功したか失敗したかを表します。
| メトリックの名前 | 説明 | Prometheus のメトリックの種類 | ラベル |
|---|---|---|---|
npm_num_policies |
ネットワーク ポリシーの数 | ゲージ | - |
npm_num_iptables_rules |
IPTables ルールの数 | ゲージ | - |
npm_num_ipsets |
IPSets の数 | ゲージ | - |
npm_num_ipset_entries |
すべての IPSets 内の IP アドレス エントリの数 | ゲージ | - |
npm_add_iptables_rule_exec_time |
IPTables ルールを追加するためのランタイム | まとめ | quantile |
npm_add_ipset_exec_time |
IPSet ルールを追加するためのランタイム | まとめ | quantile |
npm_ipset_counts (詳細) |
個々の IPSet 内のエントリの数 | GaugeVec | set_name および set_hash |
npm_add_policy_exec_time |
ネットワーク ポリシーを追加するためのランタイム | まとめ | quantile および had_error |
npm_controller_policy_exec_time |
ネットワーク ポリシーを更新/削除するためのランタイム | まとめ | quantile および had_error および operation (値 update または delete) |
npm_controller_namespace_exec_time |
名前空間を作成/更新/削除するためのランタイム | まとめ | quantile および had_error および operation (値 create、update、または delete) |
npm_controller_pod_exec_time |
ポッドを作成/更新/削除するためのランタイム | まとめ | quantile および had_error および operation (値 create、update、または delete) |
また、"exec_time" サマリー メトリックごとに "exec_time_count" と "exec_time_sum" のメトリックもあります。
メトリックは、Azure Monitor for Containers または Prometheus 全体でスクレイピングできます。
Azure Monitor のセットアップ
最初の手順は、Kubernetes クラスター用に Azure Monitor for containers を有効にします。 手順は「Azure Monitor for containers の概要」から見つけることができます。 コンテナー用Azure Monitor を有効にしたら、コンテナー用Azure Monitor ConfigMap を構成して、ネットワークポリシーマネージャー 統合と Prometheus ネットワークポリシーマネージャー メトリックの収集を有効にします。
コンテナー用Azure monitor ConfigMap には、ネットワークポリシーマネージャー メトリックを収集するための設定を含む integrations セクションがあります。
これらの設定は、ConfigMap では既定で無効になっています。 基本設定 collect_basic_metrics = trueを有効にすると、ネットワーク ポリシー マネージャーの基本的なメトリックが収集されます。 詳細設定 collect_advanced_metrics = true を有効にすると、基本的なメトリックに加えて高度なメトリックが収集されます。
ConfigMap を編集したら、ローカルに保存し、次のように ConfigMap をクラスターに適用します。
kubectl apply -f container-azm-ms-agentconfig.yaml
次に示すスニペットは、高度なメトリックの収集が有効になっている ネットワーク ポリシー マネージャー統合を示す コンテナー用Azure monitor ConfigMap からです。
integrations: |-
    [integrations.azure_network_policy_manager]
        collect_basic_metrics = false
        collect_advanced_metrics = true
高度なメトリックはオプションであり、オンにすると自動的に基本メトリックの収集が有効になります。 現在のところ、高度なメトリックには Network Policy Manager_ipset_counts のみが含まれています。
構成マップでの コンテナー用Azure monitor のコレクション設定の詳細を参照してください。
Azure Monitor の視覚化オプション
ネットワークポリシーマネージャー メトリック コレクションを有効にすると、Azure portal で コンテナー分析情報 を使用して、または Grafana 内でメトリックを表示できます。
Azure portal の 分析情報 でのクラスターの表示
Azure portal を開きます。 クラスターの分析情報で、ブックに移動し、ネットワーク ポリシー マネージャー (NPM) の構成 を開きます。
ブック を表示するだけでなく、分析情報セクションの 「ログ」 で Prometheus メトリックを直接照会することもできます。 たとえば、このクエリでは、収集されるすべてのメトリックが返されます。
| where TimeGenerated > ago(5h)
| where Name contains "npm_"
また、Log Analytics でメトリックの直接クエリを実行することもできます。 詳細については、Log Analytics Queriesの起動と開始を参照してください。
Grafana ダッシュボードでの表示
ここに説明されているように、Grafana サーバーを設定し、Log Analytics データ ソースを構成します。 次に、Log Analytics バックエンドを含む Grafana ダッシュボードを Grafana Labs にインポートします。
ダッシュボードには、Azure ブックに似た視覚エフェクトがあります。 グラフにパネルを追加し、InsightsMetrics テーブルからネットワーク ポリシー マネージャーのメトリックを視覚化できます。
Prometheus サーバーの設定
ユーザーによっては、コンテナー用Azure Monitor ではなく、Prometheus サーバーを使用してメトリックを収集することも選択できます。 ネットワークポリシーマネージャー メトリックを収集するには、スクレイピング構成に 2 つのジョブを追加する必要があります。
Prometheus サーバーをインストールするには、クラスターにこのヘルム リポジトリを追加します:
helm repo add stable https://kubernetes-charts.storage.googleapis.com
helm repo update
次に、サーバーを追加します。
helm install prometheus stable/prometheus -n monitoring \
--set pushgateway.enabled=false,alertmanager.enabled=false, \
--set-file extraScrapeConfigs=prometheus-server-scrape-config.yaml
prometheus-server-scrape-config.yaml は次の要素で構成されます:
- job_name: "azure-npm-node-metrics"
  metrics_path: /node-metrics
  kubernetes_sd_configs:
  - role: node
  relabel_configs:
  - source_labels: [__address__]
    action: replace
    regex: ([^:]+)(?::\d+)?
    replacement: "$1:10091"
    target_label: __address__
- job_name: "azure-npm-cluster-metrics"
  metrics_path: /cluster-metrics
  kubernetes_sd_configs:
  - role: service
  relabel_configs:
  - source_labels: [__meta_kubernetes_namespace]
    regex: kube-system
    action: keep
  - source_labels: [__meta_kubernetes_service_name]
    regex: npm-metrics-cluster-service
    action: keep
# Comment from here to the end to collect advanced metrics: number of entries for each IPSet
  metric_relabel_configs:
  - source_labels: [__name__]
    regex: npm_ipset_counts
    action: drop
azure-npm-node-metrics ジョブを以下のコンテンツに置き換えたり、Kubernetes ポッド用の既存のジョブに組み込むこともできます:
- job_name: "azure-npm-node-metrics-from-pod-config"
  metrics_path: /node-metrics
  kubernetes_sd_configs:
  - role: pod
  relabel_configs:
  - source_labels: [__meta_kubernetes_namespace]
    regex: kube-system
    action: keep
  - source_labels: [__meta_kubernetes_pod_annotationpresent_azure_Network Policy Manager_scrapeable]
    action: keep
  - source_labels: [__address__]
    action: replace
    regex: ([^:]+)(?::\d+)?
    replacement: "$1:10091"
    target_label: __address__
AlertManager のアラートの設定
Prometheus サーバーを使用する場合は、そのように AlertManager を設定できます。 上記の 2 つのアラート ルールの構成例を次に示します:
groups:
- name: npm.rules
  rules:
  # fire when Network Policy Manager has a new failure with an OS call or when translating a Network Policy (suppose there's a scraping interval of 5m)
  - alert: AzureNetwork Policy ManagerFailureCreatePolicy
    # this expression says to grab the current count minus the count 5 minutes ago, or grab the current count if there was no data 5 minutes ago
    expr: (npm_add_policy_exec_time_count{had_error='true'} - (npm_add_policy_exec_time_count{had_error='true'} offset 5m)) or npm_add_policy_exec_time_count{had_error='true'}
    labels:
      severity: warning
      addon: azure-npm
    annotations:
      summary: "Azure Network Policy Manager failed to handle a policy create event"
      description: "Current failure count since Network Policy Manager started: {{ $value }}"
  # fire when the median time to apply changes for a pod create event is more than 100 milliseconds.
  - alert: AzurenpmHighControllerPodCreateTimeMedian
    expr: topk(1, npm_controller_pod_exec_time{operation="create",quantile="0.5",had_error="false"}) > 100.0
    labels:
      severity: warning
      addon: azure-Network Policy Manager
    annotations:
      summary: "Azure Network Policy Manager controller pod create time median > 100.0 ms"
      # could have a simpler description like the one for the alert above,
      # but this description includes the number of pod creates that were handled in the past 10 minutes,
      # which is the retention period for observations when calculating quantiles for a Prometheus Summary metric
      description: "value: [{{ $value }}] and observation count: [{{ printf `(npm_controller_pod_exec_time_count{operation='create',pod='%s',had_error='false'} - (npm_controller_pod_exec_time_count{operation='create',pod='%s',had_error='false'} offset 10m)) or npm_controller_pod_exec_time_count{operation='create',pod='%s',had_error='false'}` $labels.pod $labels.pod $labels.pod | query | first | value }}] for pod: [{{ $labels.pod }}]"
Prometheus の視覚化オプション
Prometheus サーバーを使用する場合は、Grafana ダッシュボードのみがサポートされています。
Grafana サーバーをまだ設定していない場合は、設定して Prometheus データ ソースを構成します。 次に、Prometheus バックエンドを含む Grafana ダッシュボードを Grafana Labs にインポートします。
このダッシュボードのビジュアルは、コンテナー分析情報/ログ分析 バックエンドを持つダッシュボードと同じです。
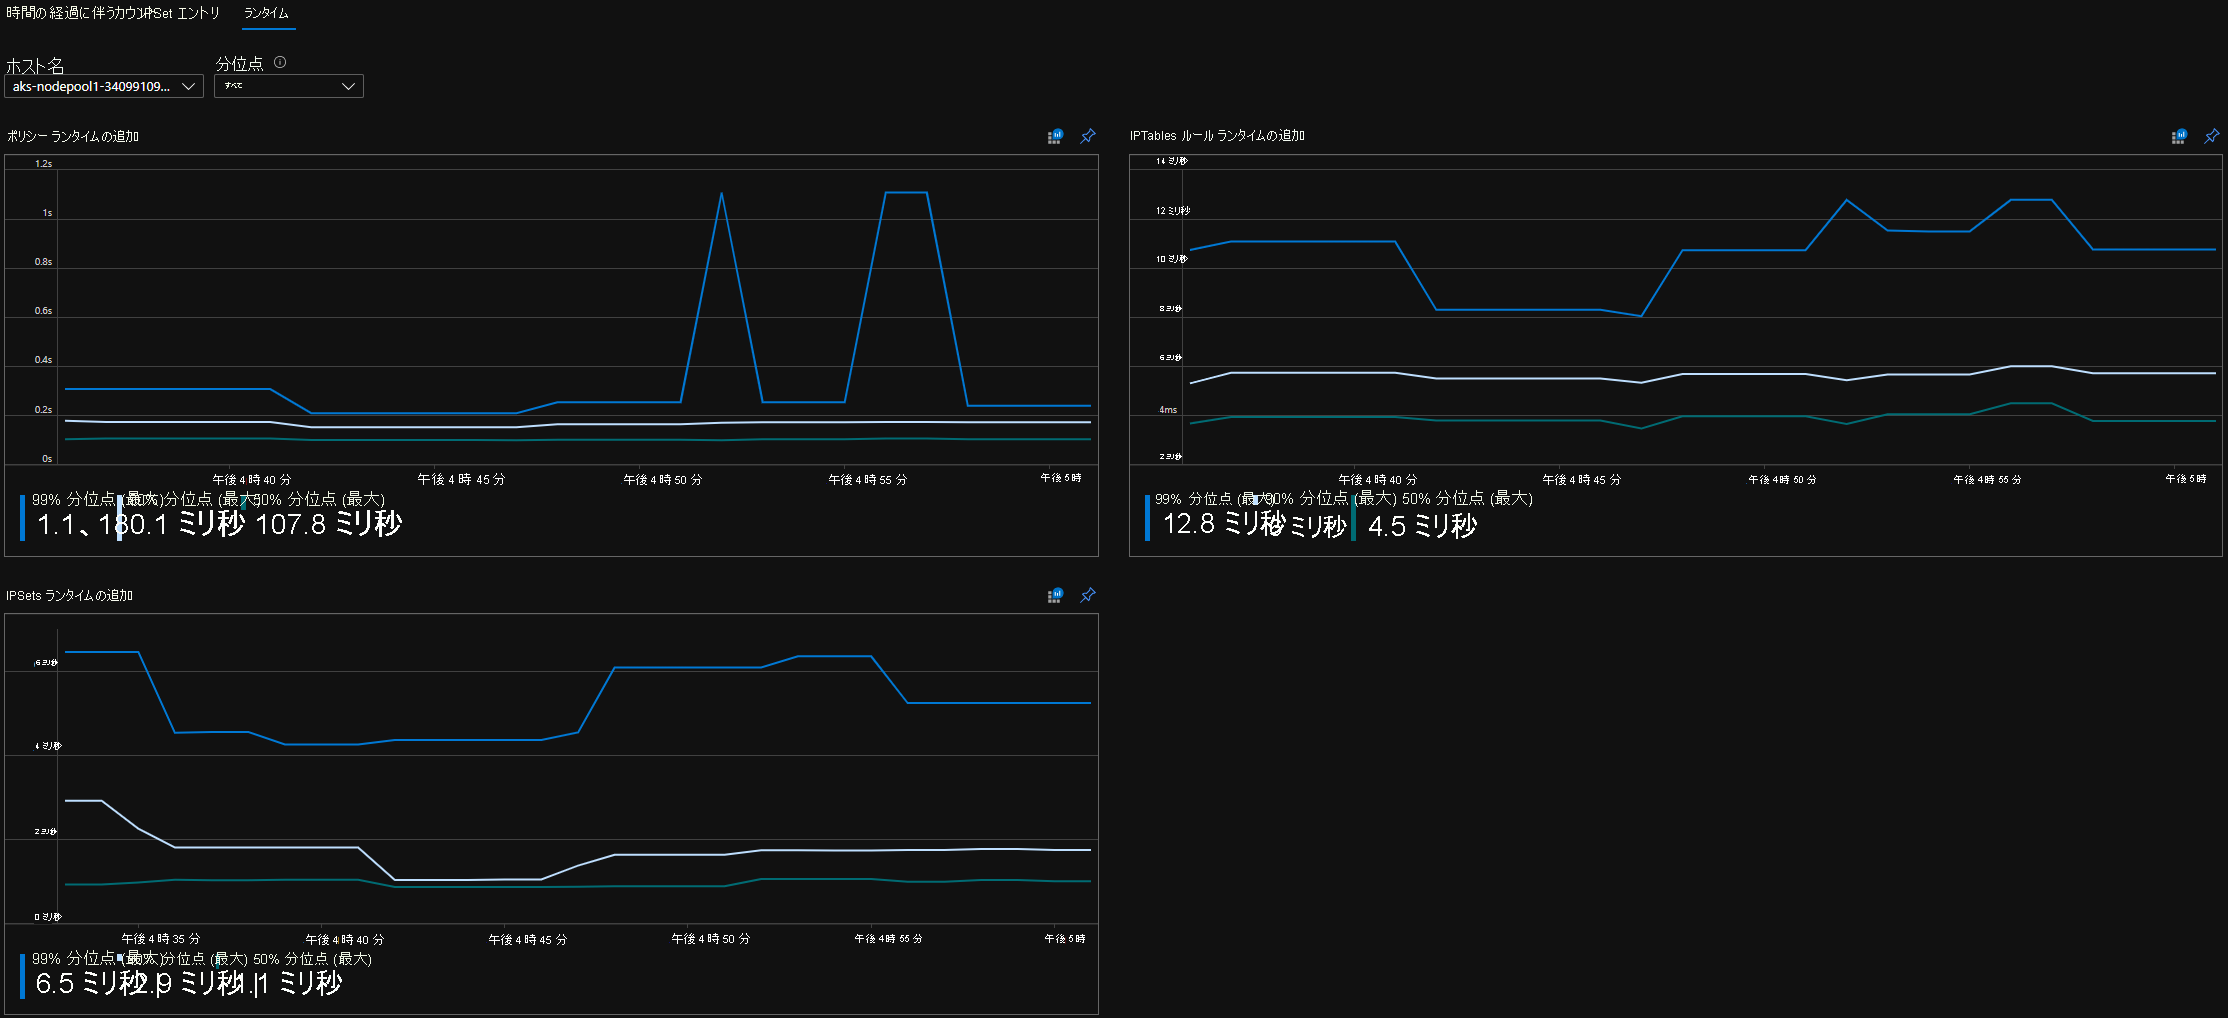
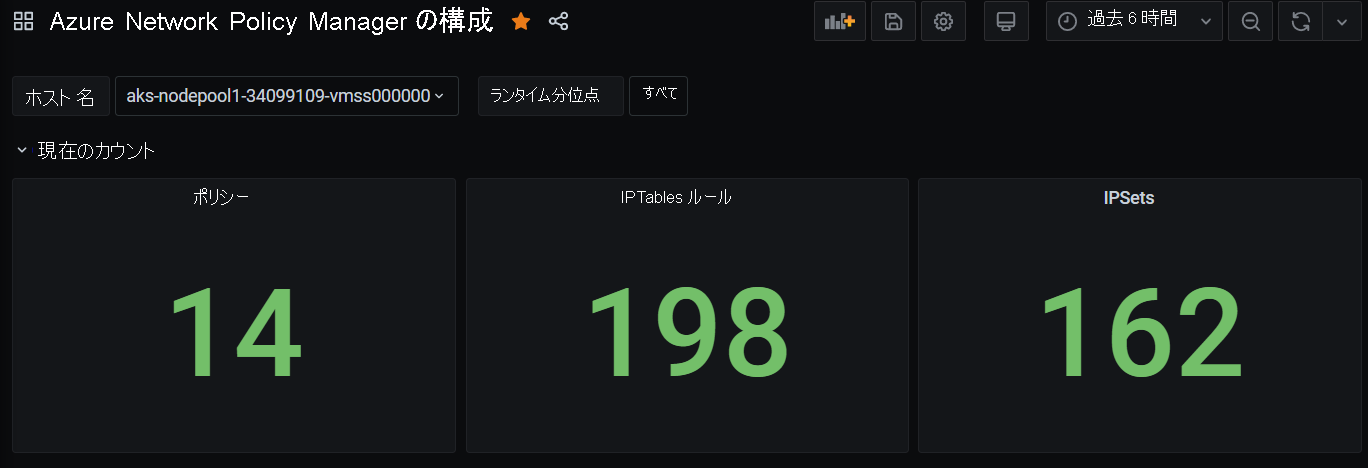
サンプル ダッシュボード
コンテナー分析情報 (CI) と Grafana の ネットワークポリシーマネージャー メトリック用のサンプル ダッシュボードを次に示します。
CI 概要カウント

時間の経過に伴う CI カウント

CI IPSet エントリ

CI ランタイム分位点
Grafana ダッシュボード概要カウント
時間の経過に伴う Grafana ダッシュボードのカウント

Grafana ダッシュボード IPSet エントリ

Grafana ダッシュボード ランタイム分位点

次のステップ
Azure Kubernetes Service について確認します。
コンテナー ネットワークについて確認します。
Kubernetes クラスターまたは Docker コンテナー用のプラグインをデプロイします。